. 2013 Sep 18;8(9):e74491.
doi: 10.1371/journal.pone.0074491. eCollection 2013.

Hepatitis C virus replication and Golgi function in brefeldin a-resistant hepatoma-derived cells

Affiliations

Hepatitis C virus replication and Golgi function in brefeldin a-resistant hepatoma-derived cells

Rayan Farhat et al. PLoS One. .

Abstract

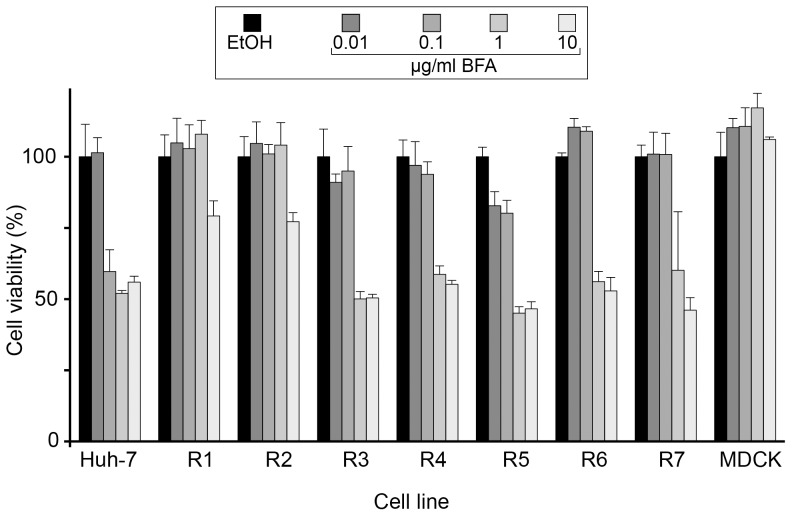
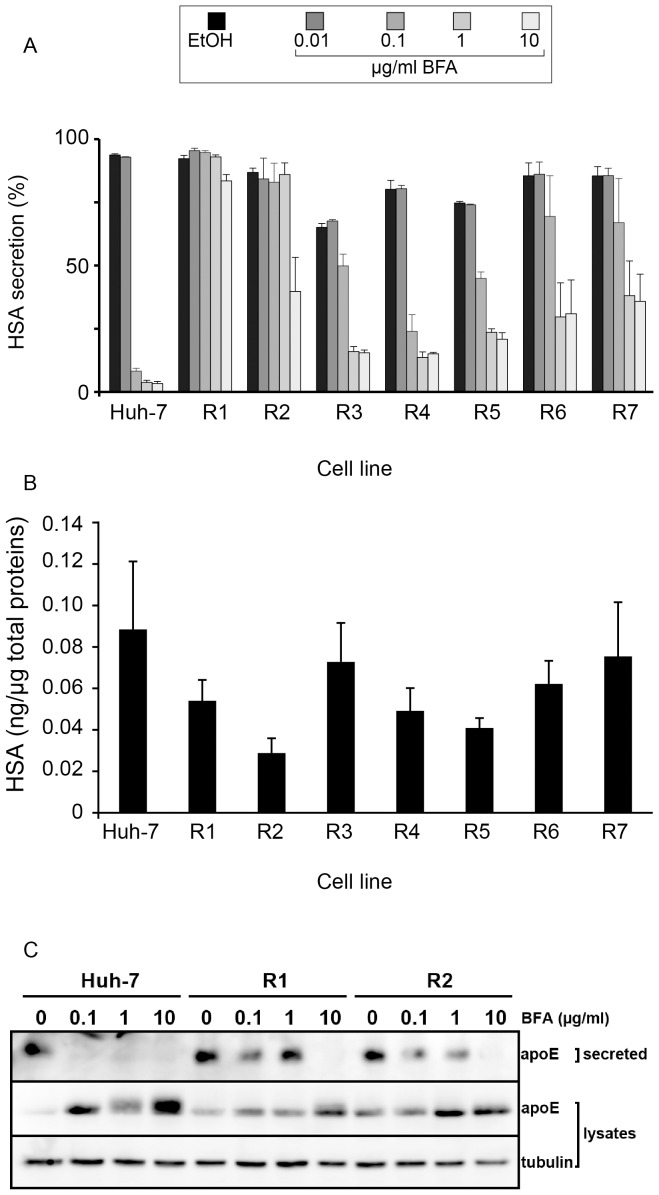
Recent reports indicate that the replication of hepatitis C virus (HCV) depends on the GBF1-Arf1-COP-I pathway. We generated Huh-7-derived cell lines resistant to brefeldin A (BFA), which is an inhibitor of this pathway. The resistant cell lines could be sorted into two phenotypes regarding BFA-induced toxicity, inhibition of albumin secretion, and inhibition of HCV infection. Two cell lines were more than 100 times more resistant to BFA than the parental Huh-7 cells in these 3 assays. This resistant phenotype was correlated with the presence of a point mutation in the Sec7 domain of GBF1, which is known to impair the binding of BFA. Surprisingly, the morphology of the cis-Golgi of these cells remained sensitive to BFA at concentrations of the drug that allowed albumin secretion, indicating a dichotomy between the phenotypes of secretion and Golgi morphology. Cells of the second group were about 10 times more resistant than parental Huh-7 cells to the BFA-induced toxicity. The EC50 for albumin secretion was only 1.5-1.8 fold higher in these cells than in Huh-7 cells. However their level of secretion in the presence of inhibitory doses of BFA was 5 to 15 times higher. Despite this partially effective secretory pathway in the presence of BFA, the HCV infection was almost as sensitive to BFA as in Huh-7 cells. This suggests that the function of GBF1 in HCV replication does not simply reflect its role of regulator of the secretory pathway of the host cell. Thus, our results confirm the involvement of GBF1 in HCV replication, and suggest that GBF1 might fulfill another function, in addition to the regulation of the secretory pathway, during HCV replication.


Conflict of interest statement

Competing Interests: The authors have declared that no competing interests exist.

Figures

Figure 1
Figure 1. Viability of BFA-resistant cells.
Sub-confluent cells of the indicated cell lines were cultured in 96-well plates in the presence of the indicated concentrations of BFA or of 0.2% ethanol (BFA stock solvent) for 24 h. Viability was assessed using an MTS assay. The absorbance of the ethanol-treated sample is expressed as 100%. Results were expressed as percentages of the values obtained with no BFA. Error bars represent the SEM of 2 independent experiments performed in triplicates.
Figure 2
Figure 2. HCV infection in BFA-resistant cells.
Cells of the indicated cell lines were infected for 2Renilla luciferase in the presence of the indicated concentrations of BFA. The virus was removed and the cells were left in the presence of BFA for another 6-h period. Cells were lysed in Renilla lysis buffer at 24 hpi, and the luciferase activity was quantified as a measure of HCV infection. Results were expressed as percentages of the values obtained with no BFA. Error bars represent the SD of 3 experiments performed in triplicates. +, values below 0.1%.
Figure 3
Figure 3. Impact of GBF1 and Arf1 depletion on HCV replication in R1 and R2 cells.
(A) Cells of the indicated cell lines were transfected with siRNA targeting GBF1, BIG1, or PI4KIIIα (PI4KA), and infected with HCVcc. Cells were lysed at 30 hpi and the expression of NS5A, GBF1, and β-tubulin were analyzed by immunoblotting. (B) For each cell line, NS5A expression is expressed as a percentage of the values obtained for mock-transfected cells. (C) Cells of the indicated cell lines were transfected with siRNA targeting Arf1 or PI4KIIIα (PI4KA), or with a non-targeting control siRNA, and infected with HCVcc. Cells were lysed at 30 hpi and the expression of NS5A, Arf1, and β-tubulin were analyzed by immunoblotting. (D) For each cell line, NS5A expression is expressed as a percentage of the values obtained for the control siRNA. Error bars represent the SD of 3 independent experiments. +, NS5A below the detection limit.
Figure 4
Figure 4. Serum albumin and apolipoprotein E secretion in BFA-resistant cells.
(A) Albumin secretion. Cells of the indicated cell lines were seeded in 12-well plates, and cultured in the presence of BFA for 24 h. The amounts of human serum albumin (HSA) in the conditioned culture media and in cell lysates were quantified with an ELISA assay and expressed as percentages of HSA secretion. Error bars represent the SEM of 4 independent experiments performed in duplicates. (B) Basal HSA expression levels. HSA of the indicated cell lines were quantified from cell lysates (in the absence of BFA treatment) by ELISA and normalized to the total protein concentration. (C) Apolipoprotein E (apoE) secretion. Cells were cultured in 24-well plates, in the presence of the indicated concentrations of BFA for 8 h. The amounts of apoE in cell lysates and culture media and of tubulin in cell lysates were analyzed by immunoblotting. Error bars represent the SEM of 3 independent experiments.
Figure 5
Figure 5. Mutation detected in GBF1 of R1 and R2 cells.
(A) A fraction of the electrophoregrams corresponding to the sequence of GBF1 from the indicated cell lines is presented. The nucleotide and amino-acid sequences are indicated. The position of the mutation is indicated by an arrow. (B) Huh-7 cells were transfected with expression plasmids for GBF1-M832L, GBF1 inactive mutant E794K, or YFP. Transfected cells were submitted to a cell viability assay, as explained in the legend of figure 1. Results were expressed as percentages of the values obtained with no BFA. Error bars represent the SEM of 3 independent experiments performed in triplicates. (C) Transfected cells were seeded in 12-well plates, and cultured in the presence of BFA for 24 h. The amounts of human serum albumin (HSA) in the conditioned culture media and in cell lysates were quantified with an ELISA assay and expressed as percentages of HSA secretion. Error bars represent the SEM of 3 independent experiments performed in duplicates.
Figure 6
Figure 6. Morphology of BFA-sensitive compartments of R1 and R2 cells.
Cells of the indicated cell lines were treated with 2.5 µg/ml (A) or 5 µg/ml (B, C) BFA for 30 minutes, fixed and processed for the immunofluorescent detection of GM130 (A), TGN46 (B), or the transferrin receptor (C). The nuclei were stained with DAPI. Representative confocal images are presented. Bar, 20 µm.
Figure 7
Figure 7. BFA sensitivity of the cis-Golgi of Huh-7, R1, R2 and MDCK cells.
Cells were treated for 30 minutes with increasing concentrations of BFA, fixed and processed for the immunofluorescent detection of GM130. For each condition, approximately 100 cells were scored for their cis-Golgi morphology, as either intact or scattered. For each cell line, the percentages of cells with intact cis-Golgi morphology were plotted against BFA concentrations.
Figure 8
Figure 8. Immunoblot analysis of GBF1 and Arf1 expression in R1 and R2 cells.
Equal amounts of lysates of the indicated cell lines were analyzed by immunoblotting for the expression of GBF1, Arf1 and β-tubulin.
Figure 9
Figure 9. Impact of Arf-GEF depletion on the cis-Golgi morphology.
Huh-7 cells were transfected with siRNA targeting GBF1, BIG1, BIG2, or both BIG1 and BIG2. Cells were fixed 3 days after transfection and processed for the immunofluorescent detection of GM130 (shown in red). The nuclei were stained with DAPI (shown in blue). Representative confocal images are presented. Bar, 20 µm.

References

    1. Egger D, Wölk B, Gosert R, Bianchi L, Blum HE, et al. (2002) Expression of hepatitis C virus proteins induces distinct membrane alterations including a candidate viral replication complex. J Virol 76: 5974–5984. - PMC - PubMed
    1. Gosert R, Egger D, Lohmann V, Bartenschlager R, Blum HE, et al. (2003) Identification of the hepatitis C virus RNA replication complex in Huh-7 cells harboring subgenomic replicons. J Virol 77: 5487–5492 doi:10.1128/JVI.77.9.5487-5492.2003 - DOI - PMC - PubMed
    1. Rouillé Y, Helle F, Delgrange D, Roingeard P, Voisset C, et al. (2006) Subcellular localization of hepatitis C virus structural proteins in a cell culture system that efficiently replicates the virus. J Virol 80: 2832–2841 doi:10.1128/JVI.80.6.2832-2841.2006 - DOI - PMC - PubMed
    1. Wölk B, Büchele B, Moradpour D, Rice CM (2008) A dynamic view of hepatitis C virus replication complexes. J Virol 82: 10519–10531 doi:10.1128/JVI.00640-08 - DOI - PMC - PubMed
    1. Ferraris P, Blanchard E, Roingeard P (2010) Ultrastructural and biochemical analyses of hepatitis C virus-associated host cell membranes. Journal of General Virology 91: 2230–2237 doi:10.1099/vir.0.022186-0 - DOI - PubMed

Publication types

MeSH terms

LinkOut - more resources