. 2013 Sep 13;8(9):e74644.
doi: 10.1371/journal.pone.0074644. eCollection 2013.

Aging and calorie restriction oppositely affect mitochondrial biogenesis through TFAM binding at both origins of mitochondrial DNA replication in rat liver

Affiliations

Aging and calorie restriction oppositely affect mitochondrial biogenesis through TFAM binding at both origins of mitochondrial DNA replication in rat liver

Anna Picca et al. PLoS One. .

Abstract

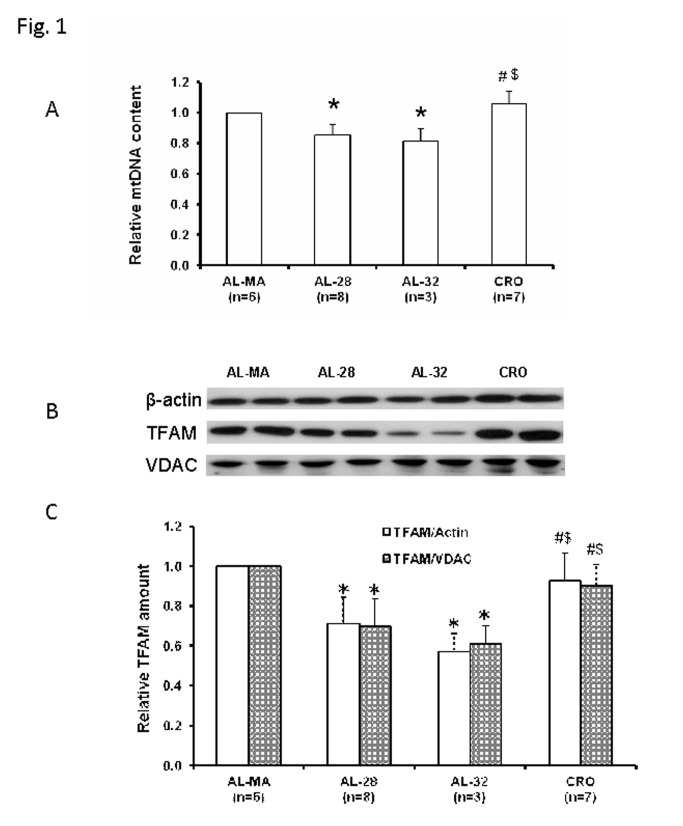
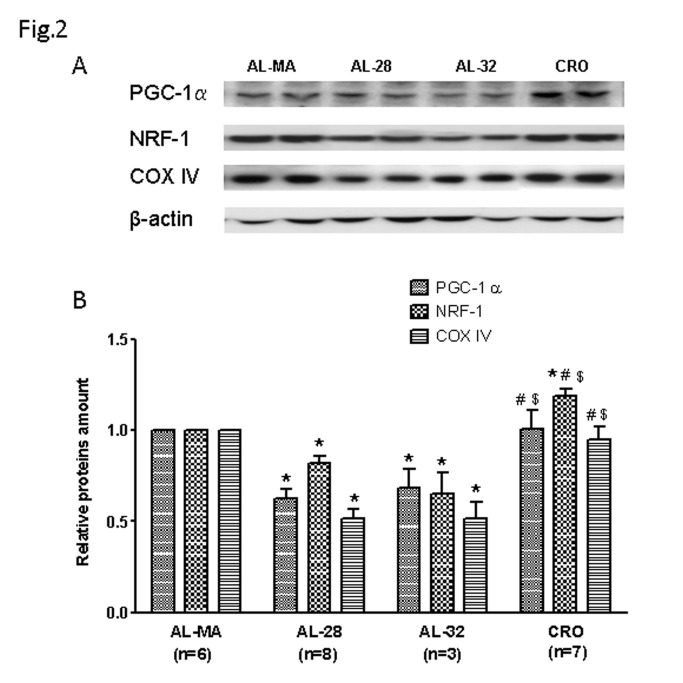
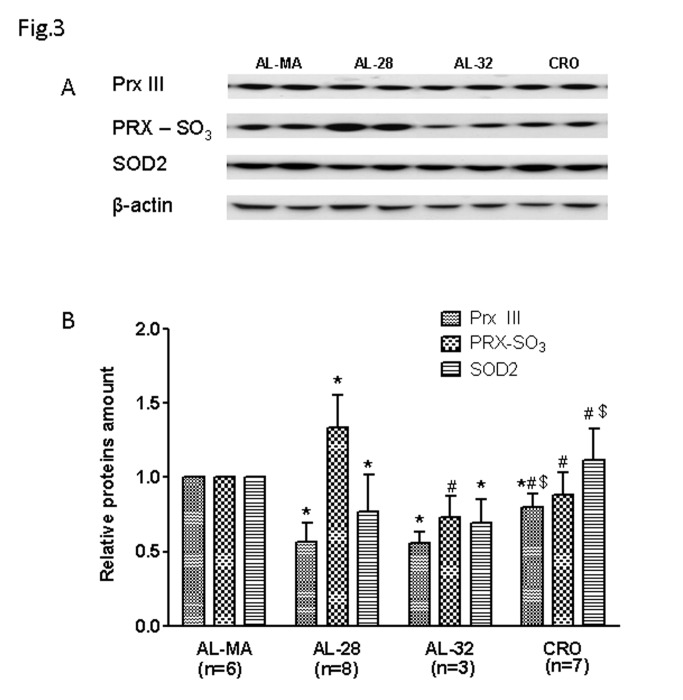
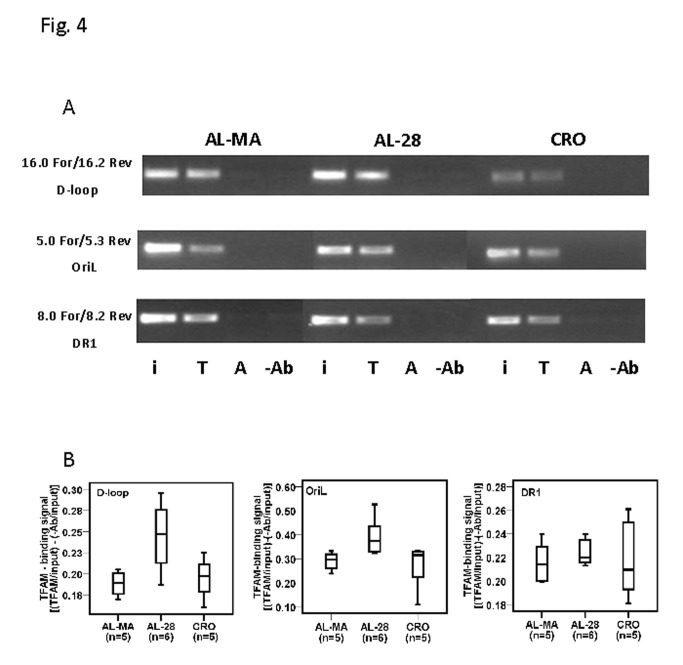
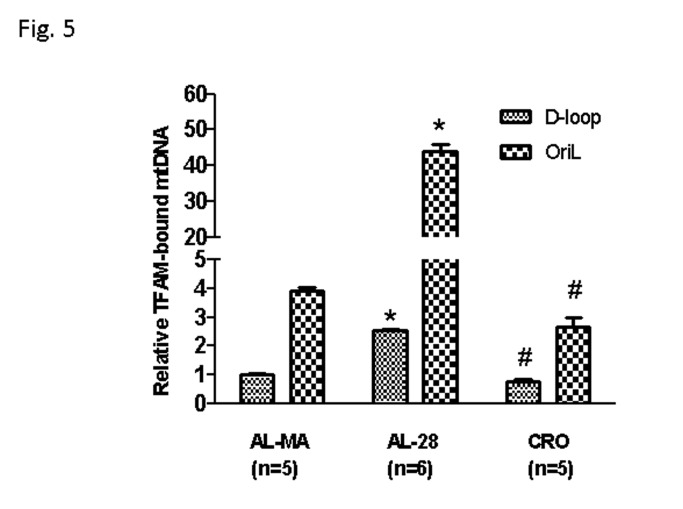
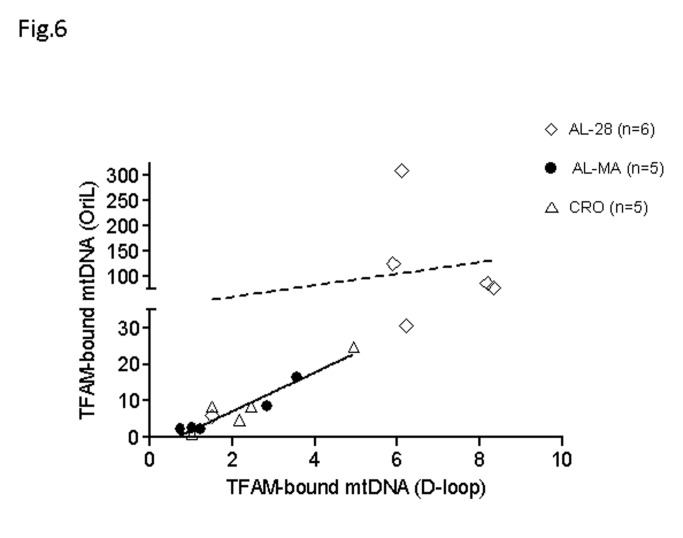
Aging affects mitochondria in a tissue-specific manner. Calorie restriction (CR) is, so far, the only intervention able to delay or prevent the onset of several age-related changes also in mitochondria. Using livers from middle age (18-month-old), 28-month-old and 32-month-old ad libitum-fed and 28-month-old calorie-restricted rats we found an age-related decrease in mitochondrial DNA (mtDNA) content and mitochondrial transcription factor A (TFAM) amount, fully prevented by CR. We revealed also an age-related decrease, completely prevented by CR, for the proteins PGC-1α NRF-1 and cytochrome c oxidase subunit IV, supporting the efficiency of CR to forestall the age-related decrease in mitochondrial biogenesis. Furthermore, CR counteracted the age-related increase in oxidative damage to proteins, represented by the increased amount of oxidized peroxiredoxins (PRX-SO3) in the ad libitum-fed animals. An unexpected age-related decrease in the mitochondrial proteins peroxiredoxin III (Prx III) and superoxide dismutase 2 (SOD2), usually induced by increased ROS and involved in mitochondrial biogenesis, suggested a prevailing relevance of the age-reduced mitochondrial biogenesis above the induction by ROS in the regulation of expression of these genes with aging. The partial prevention of the decrease in Prx III and SOD2 proteins by CR also supported the preservation of mitochondrial biogenesis in the anti-aging action of CR. To investigate further the age- and CR-related effects on mitochondrial biogenesis we analyzed the in vivo binding of TFAM to specific mtDNA regions and demonstrated a marked increase in the TFAM-bound amounts of mtDNA at both origins of replication with aging, fully prevented by CR. A novel, positive correlation between the paired amounts of TFAM-bound mtDNA at these sub-regions was found in the joined middle age ad libitum-fed and 28-month-old calorie-restricted groups, but not in the 28-month-old ad libitum-fed counterpart suggesting a quite different modulation of TFAM binding at both origins of replication in aging and CR.


Conflict of interest statement

Competing Interests: The authors have declared that no competing interests exist.

Figures

Figure 1
Figure 1. Age- and calorie restriction-related changes of mtDNA content and TFAM amount in rat liver.
Aging induced a decrease in the mtDNA content of ad libitum-fed rats, fully prevented by CR. Also the TFAM amount presented an age-related decrease in the ad libitum-fed animals, completely prevented by CR. Α The histogram shows the mean value of the ratio mtDNA/nuclear DNA, determined by qRT-PCR, in AL-28, AL-32 and CRO rats, compared to AL-MA rats. Bars represent the mean (+/- SD) obtained, respectively, from analysis in triplicate of total nucleic acids from each AL-MA, AL-28, AL-32 and CRO rat. *p<0.05 versus the value of the AL-MA rats (fixed as 1), # p<0.05 versus the value of the AL-28 rats, § p<0.05 versus the value of the AL-32 rats; n=number of analyzed animals. B Representative western blot carried out in two rats from each assayed group. The bands from top to bottom show, respectively, the signals from β-actin, TFAM and VDAC. C The histogram shows the relative amount of TFAM in AL-28, AL-32 and CRO rats, determined by densitometry analysis of the results from triplicated western blots experiments, compared to AL-MA rats. The densitometric value of OD units of every TFAM band was related to the number of OD units of the respective band of the β-actin as well as to that of the respective band of VDAC for each analyzed sample. Bars represent the mean (+/- SD) of the relative (TFAM/β-actin and TFAM/VDAC) values obtained from each AL-MA, AL-28, AL-32 and CRO rat. Comparisons were made with respect to the value of the AL-MA rats (fixed as 1). *p<0.05 versus the value of the AL-MA rats, # p<0.05 versus the value of the AL-28 rats, § p<0.05 versus the value of the AL-32 rats; n=number of analyzed animals.
Figure 2
Figure 2. Age- and calorie restriction-related changes of PGC-1α NRF-1 and COX IV amounts in rat liver.
Aging induced a decreased expression, completely prevented by CR, of the analyzed proteins, involved in mitochondrial biogenesis. A Representative western blot carried out in two rats from each assayed group. The bands from top to bottom show, respectively, the signals from PGC-1α NRF-1, COX IV and β-actin. B The histogram shows the relative amounts of PGC-1α, NRF-1 and COX IV in AL-28, AL-32 and CRO rats, compared to AL-MA rats, all normalized with respect to β-actin. Bars represent the mean (+/- SD) of the values obtained, respectively, from analysis in triplicate of the protein extract, from each AL-MA, AL-28, AL-32 and CRO rat. *p<0.05 versus the value of the AL-MA rats (fixed as 1), # p<0.05 versus the value of the AL-28 rats, $ p<0.05 versus the value of the AL-32 rats; n=number of analyzed animals.
Figure 3
Figure 3. Age- and calorie restriction-related changes of Prx III PRX-SO3 and SOD2 amounts in rat liver.
Prx III expression presented an age-related decrease, attenuated by CR. An age-related increase in PRX-SO3 was found only in the AL-28 rats and prevented by CR. Aging induced a decrease in SOD2 expression, completely prevented by CR. A Representative western blot carried out in two rats from each assayed group. The bands from top to bottom show, respectively, the signals from Prx III PRX-SO3, SOD2 and β-actin. B The histogram shows the relative amounts of Prx III PRX-SO3 and SOD2 in AL-28, AL-32 and CRO rats, compared to AL-MA rats, all normalized with respect to β-actin. Bars represent the mean (+/- SD) of the values obtained, respectively, from analysis in triplicate of the protein extract, from each AL-MA, AL-28, AL-32 and CRO rat. *p<0.05 versus the value of the AL-MA rats (fixed as 1), # p<0.05 versus the value of the AL-28 rats, $ p<0.05 versus the value of the AL-32 rats; n=number of analyzed animals.
Figure 4
Figure 4. Age- and calorie restriction-related changes of TFAM binding to rat mtDNA regions by mIP assay.
The semi-quantitative assay showed the presence of TFAM-binding at all assayed regions, while the densitometric evaluation of such results indicated the age-related increase in TFAM-binding at both D-loop and OriL regions, prevented by CR. A Representative results of semi-quantitative PCR amplifications of the mIP-derived templates from an AL-MA, an AL-28 and a CRO rat for the indicated regions. The specific primers pairs and the amplified genetic regions are indicated on the left side of the gel. The PCR reactions contained either input DNA (i) or mIP mtDNA immunoprecipitated with TFAM (T) or mIP mtDNA immunoprecipitated with β-actin (A) or mIP mtDNA immunoprecipitated with no antibody (-Ab). B Semi-quantitative evaluation by densitometry of TFAM binding in the three groups of animals after the mIP assay performed at three mtDNA regions. For each rat the signal value of every region was calculated in the three replicas by subtracting the value of the intensity of the aliquot precipitated without primary antibody from that of the TFAM-immunoprecipitated aliquot, both normalized to the value of the respective input aliquot made equal to 1. The respective mean was used in the box-plot representation of the corresponding group of rats. The “box” contains the middle 50% of the data (with the upper and the lower edges representing the 75th and 25th percentiles, respectively), the “horizontal line” within the box represents the median value. The filled lines indicate minimum and maximum data values for each rats group; n=number of analyzed animals.
Figure 5
Figure 5. Age- and calorie restriction-related changes of TFAM-bound mtDNA amount at two mtDNA regions by RT-PCR.
An age-related increase in the amount of TFAM-bound mtDNA was found at both assayed regions, while it was prevented by CR. The amplified products enclose sections, respectively, of the D-loop region and of the OriL region delimited by the primers pairs listed in the bottom part of Table 1. The calculation of the relative amount of TFAM-bound mtDNA was performed according to the formula 2ΔCTx -2ΔCTb, where ΔCTx is the CT difference between the CT values of the input and of the immunoprecipitated sample and ΔCTb is the CT difference between the CT values of the input and of the –Ab sample. The obtained results were then normalized with respect to the mean value of TFAM-bound mtDNA in the D-loop region from AL-MA animals (fixed as 1). Bars represent the mean (+/- SD) of the relative amounts of TFAM-bound mtDNA derived from each of the assayed animals in the specific group. *p<0.05 versus the value of the AL-MA rats; # p<0.05 versus the amount from the same region of AL-28 rats; n=number of analyzed animals.
Figure 6
Figure 6. Correlation between TFAM-bound mtDNA amounts at the D-loop region and at the OriL region.
A strong positive correlation was found between the TFAM-bound amounts of mtDNA at the assayed sub-regions in the joined animals from the AL-MA and CRO groups, but not in the AL-28 rats. The relative amounts of mtDNA immunoprecipitated by TFAM were determined by quantitative Real Time PCR (qRT-PCR) using primers for the D-loop and OriL sub-regions. Each sample was analyzed in triplicate. The calculation of the relative amount of TFAM-bound mtDNA was performed according to the formula 2ΔCTx -2ΔCTb, where ΔCTx is the CT difference between the CT values of the input and of the immunoprecipitated sample and ΔCTb is the CT difference between the CT values of the input and of the –Ab sample. Pearson’s tests were performed to determine whether the amounts of TFAM-bound mtDNA at both origins of replication correlate with each other. The correlation was highly significant (p<0.005, correlation coefficient: 0.952) in the AL-MA and CRO joined groups (n=10, filled line); the correlation was not statistically significant and reached a lower value (p= N.S., correlation coefficient: 0.409) in the AL-28 group (n=6, dashed line).

References

    1. Wallace DC (1992) Mitochondrial genetics: a paradigm for aging and degenerative diseases? Science 256: 628-632. doi:10.1126/science.1533953. PubMed: 1533953. - DOI - PubMed
    1. Huang JH, Hood DA (2009) Age-associated mitochondrial dysfunction in skeletal muscle: Contributing factors and suggestions for long-term interventions. IUBMB Life 61: 201-214. doi:10.1002/iub.164. PubMed: 19243006. - DOI - PubMed
    1. Navarro A, Boveris A (2010) Brain mitochondrial dysfunction in aging, neurodegeneration, and Parkinson’s disease. Front Aging Neurosci 2: 1-11. PubMed: 20552041. - PMC - PubMed
    1. Navarro A, Boveris A (2007) The mitochondrial energy transduction system and the aging process. Am J Physiol Cell Physiol 292: C670-C686. PubMed: 17020935. - PubMed
    1. Harman D (1972) The biologic clock: the mitochondria? J Am Geriatr Soc 20: 145-147. PubMed: 5016631. - PubMed

Publication types