. 2013 Sep 23:14:644.
doi: 10.1186/1471-2164-14-644.

Genetic diversity in black South Africans from Soweto

Affiliations

Genetic diversity in black South Africans from Soweto

Andrew May et al. BMC Genomics. .

Abstract

Background: Due to the unparalleled genetic diversity of its peoples, Africa is attracting growing research attention. Several African populations have been assessed in global initiatives such as the International HapMap and 1000 Genomes Projects. Notably excluded, however, is the southern Africa region, which is inhabited predominantly by southeastern Bantu-speakers, currently suffering under the dual burden of infectious and non-communicable diseases. Limited reference data for these individuals hampers medical research and prevents thorough understanding of the underlying population substructure. Here, we present the most detailed exploration, to date, of genetic diversity in 94 unrelated southeastern Bantu-speaking South Africans, resident in urban Soweto (Johannesburg).

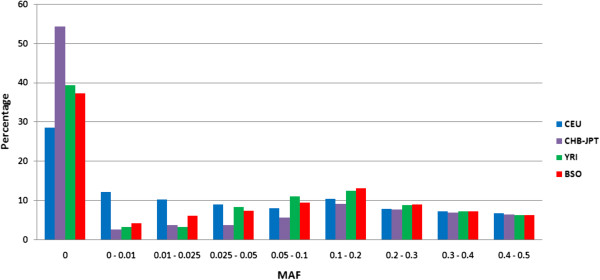
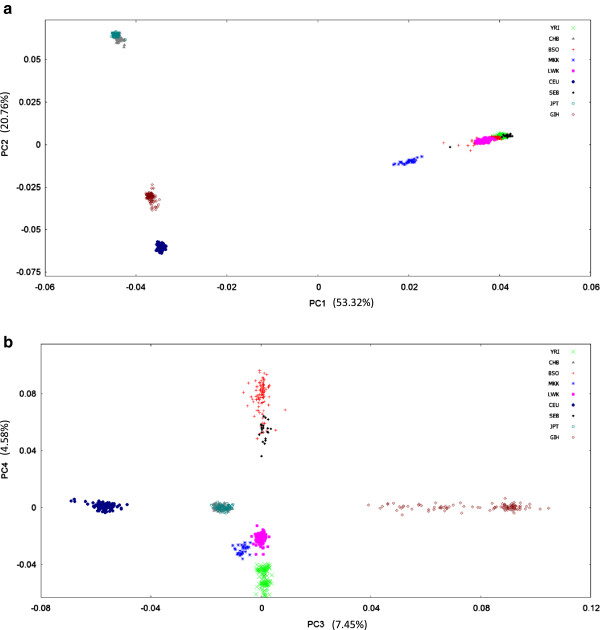
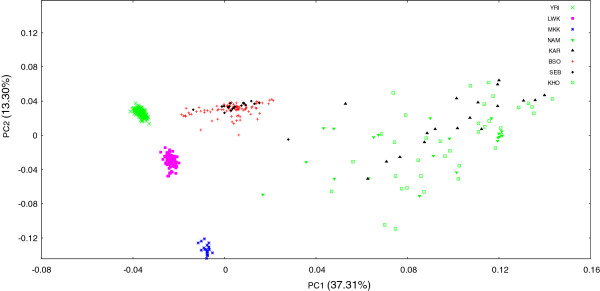
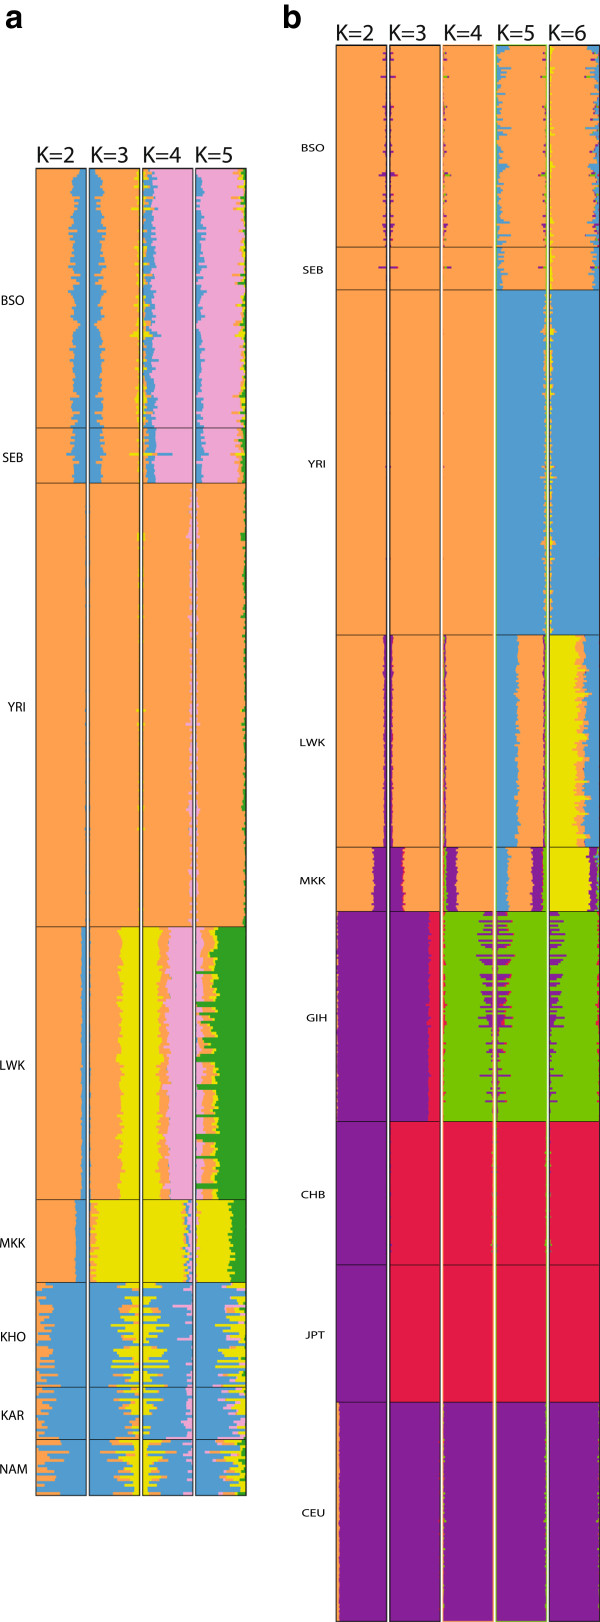
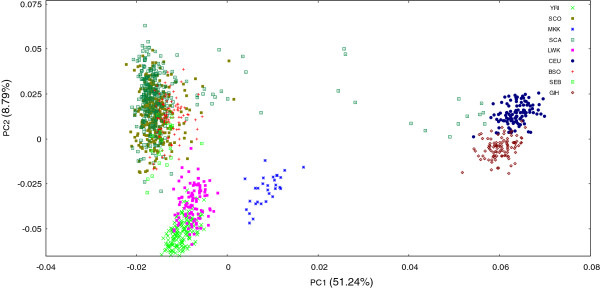
Results: Participants were typed for ~4.3 million SNPs using the Illumina Omni5 beadchip. PCA and ADMIXTURE plots were used to compare the observed variation with that seen in selected populations worldwide. Results indicated that Sowetans, and other southeastern Bantu-speakers, are a clearly distinct group from other African populations previously investigated, reflecting a unique genetic history with small, but significant contributions from diverse sources. To assess the suitability of our sample as representative of Sowetans, we compared our results to participants in a larger rheumatoid arthritis case-control study. The control group showed good clustering with our sample, but among the cases were individuals who demonstrated notable admixture.

Conclusions: Sowetan population structure appears unique compared to other black Africans, and may have clinical implications. Our data represent a suitable reference set for southeastern Bantu-speakers, on par with a HapMap type reference population, and constitute a prelude to the Southern African Human Genome Programme.


Figures

Figure 1
Figure 1
Minor allele frequency comparison for different populations typed on the Omni5 chip. We compared the distribution of minor allele frequencies for black Sowetan (BSO; n = 94) individuals to those generated in-house, by Illumina, for the CEU, CHB, JPT and YRI populations. Note that minor allele designation was dependent on genotyping frequencies per population, thus the minor allele per SNP may be different between populations. BSO individuals had an increased fraction of SNPs with minor allele frequencies between 0 and 2.5%, as well as a lower proportion of monomorphic SNPs (0 MAF), when compared to their African counterparts, the Yoruba (n = 55). Between frequencies of 2.5 and 10%, the YRI had a marginally larger fraction of SNPs, but levels remained comparable between the two African groups for common variants with frequencies between 10 and 50%. Performance was best for CEU (n = 113), with a low percentage of monomorphic SNPs and a significantly greater proportion of rare (1-5%) markers. Conversely, Asian [CHB (n = 44) and JPT (n = 40)] populations fared poorly, with over half of all markers on the Omni5 panel lacking variation.
Figure 2
Figure 2
Intercontinental PCA plots comparing Sowetan genetic variation to populations worldwide. Sowetan genetic variation was compared to that seen worldwide using principal component analysis. Our data were combined with Omni2.5 data generated as part of the 1000 Genomes Project. We incorporated the main representatives for the European (CEU), Asian (CHB and JPT) and African (LWK, MKK and YRI) continents, as well as Gujarati Indians (GIH) based on reported Indian contributions to the Sowetan gene pool. a) Principal components (PC) 1 and 2 divide populations into broad continental clusters, with the exception of GIH. The BSO overlap well with other Africans of the Niger-Kordofanian linguistic group. Nilo-Saharan speaking Maasai are positioned nearby, reflecting the separate history of this linguistic branch. Several BSO individuals separate out from the cluster, indicating possible admixture. b) PC3 separates Asian, European and Indian populations, whilst PC4 disaggregates Africans along a north–south gradient. BSO and SEB are clearly distinguished from other black Africans and are more loosely clustered. Plots are based on a panel of 460 568 markers. Refer to Table 1 for sample sizes per population.
Figure 3
Figure 3
Intracontinental PCA plot comparing Sowetan genetic variation to other black Africans. To examine African genetic variation in more detail, a PCA plot was generated that incorporated only BSO, SEB, YRI, MKK, LWK, KAR, KHO and NAM populations. PC1 separated populations along a north–south split, whilst the Nilo-Saharan speaking Maasai separated out along PC2. Khoe-San groups (KAR, KHO and NAM) displayed limited clustering in line with previous reports on their unparalleled genetic diversity. Noticeably, BSO clustering was weaker than that seen in northern Africans, suggesting a greater degree of interindividual variation. Plot was based on a panel of 460 568 markers. Refer to Table 1 for sample sizes per population. BSO - Southeastern Bantu-speakers from the Soweto region; KAR - Karretjie in South Africa; KHO - Khomani in South Africa; LWK - Luhya in Webuye, Kenya; MKK - Maasai in Kinyawa, Kenya; NAM - Nama in Namibia; SEB - Southeastern Bantu-speakers; YRI - Yoruba in Ibadan, Nigeria.
Figure 4
Figure 4
ADMIXTURE plots comparing genetic variation in Sowetans to that seen worldwide. ADMIXTURE was used to compare genetic composition of Sowetans to other populations worldwide, based on 460 568 SNP markers. a) When incorporating African populations only, the Yoruba (YRI) are distinguished from other Africans from K=2. At K=3, southeastern Bantu-speakers (BSO and SEB) are discerned from the Luhya (LWK) and Maasai (MKK), but share a degree of ancestry with Khoe-San groups (KAR, KHO, NAM). Both K=4 and K=5 increasingly depict each African population as a unique entity, in line with the diverse genetic architecture of the continent. b) At an intercontinental level, K=2 separates Africans from non-Africans whilst K=3 groups populations broadly into Asian (CHB, JPT), European (CEU) and African categories. K=4 then differentiates Gujarati Indians (GIH) beyond a simple mix of European and Asian genetic variation. Increasing K values separate out African populations along the lines described in a). At K=6, BSO and SEB appear highly diverse, possessing contributions from all six ancestral clusters.
Figure 5
Figure 5
Principal component analysis of Sowetan cases and controls recruited for a rheumatoid arthritis association study. To assess the validity of our own sample as a suitable reference for the black Sowetan population, we used PCA to compare results with independently recruited case (SCA; n = 304) and control (SCO; n = 318) samples selected for a rheumatoid arthritis study. Cases and controls matched the clustering pattern of BSO individuals, supporting the use of the latter as a reference sample. However, a minority of cases displayed wider dispersal, with several individuals positioned more closely to Indian and European populations. Plot was based on a panel of 21 412 SNPs. BSO - Southeastern Bantu-speakers from the Soweto region; CEU - Utah residents of European ancestry; GIH - Gujarati Indians from Houston, Texas; LWK - Luhya in Webuye, Kenya; MKK - Maasai in Kinyawa, Kenya; SCA - Black Sowetan case individuals with rheumatoid arthritis; SCO - Black Sowetan control individuals; SEB - Southeastern Bantu-speakers; YRI - Yoruba in Ibadan, Nigeria.

References

    1. Ramsay M. Africa: continent of genome contrasts with implications for biomedical research and health. FEBS Lett. 2012;586:2813–2819. doi: 10.1016/j.febslet.2012.07.061. - DOI - PubMed
    1. Tishkoff SA, Reed FA, Friedlaender FR, Ehret C, Ranciaro A, Froment A, Hirbo JB, Awomoyi AA, Bodo JM, Doumbo O. et al.The genetic structure and history of Africans and African Americans. Science. 2009;324:1035–1044. doi: 10.1126/science.1172257. - DOI - PMC - PubMed
    1. Cann HM, de-Toma C, Cazes L, Legrand MF, Morel V, Piouffre L, Bodmer J, Bodmer WF, Bonne-Tamir B, Cambon-Thomsen A. et al.A human genome diversity cell line panel. Science. 2002;296:261–262. - PubMed
    1. Joubert BR, North KE, Wang Y, Mwapasa V, Franceschini N, Meshnick SR, Lange EM. Comparison of genome-wide variation between Malawians and African ancestry HapMap populations. J Hum Genet. 2010;55:366–374. doi: 10.1038/jhg.2010.41. - DOI - PMC - PubMed
    1. Pagani L, Kivisild T, Tarekegn A, Ekong R, Plaster C, Gallego Romero I, Ayub Q, Mehdi SQ, Thomas MG, Luiselli D. et al.Ethiopian genetic diversity reveals linguistic stratification and complex influences on the Ethiopian gene pool. Am J Hum Genet. 2012;91:83–96. doi: 10.1016/j.ajhg.2012.05.015. - DOI - PMC - PubMed

Publication types

LinkOut - more resources