

Hepatocellular carcinoma: perfusion quantification with dynamic contrast-enhanced MRI
- PMID: 24059368
- PMCID: PMC4144815
- DOI: 10.2214/AJR.12.9798
Hepatocellular carcinoma: perfusion quantification with dynamic contrast-enhanced MRI
Abstract
Objective: The objective of our study was to report our initial experience with dynamic contrast-enhanced MRI (DCE-MRI) for perfusion quantification of hepatocellular carcinoma (HCC) and surrounding liver.
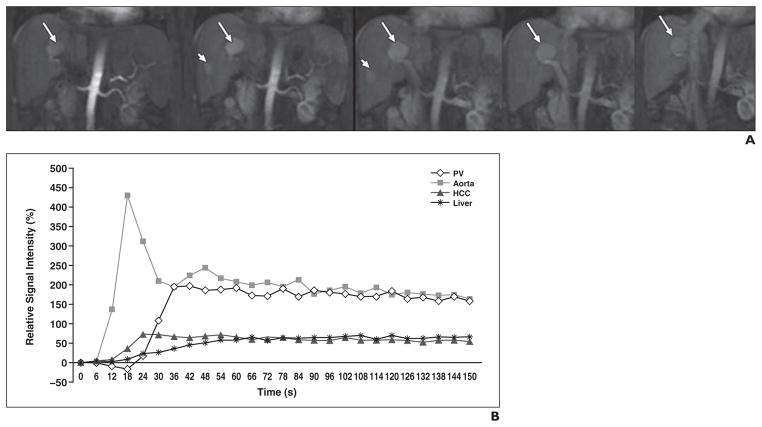
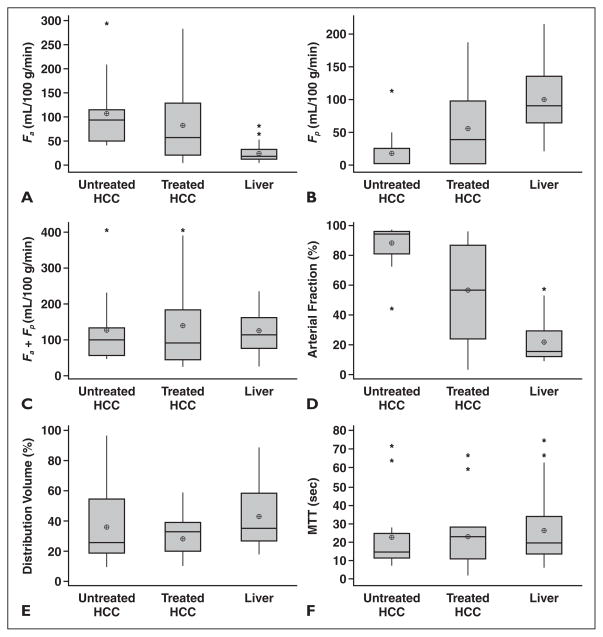
Subjects and methods: DCE-MRI of the liver was prospectively performed on 31 patients with HCC (male-female ratio, 26:5; mean age, 61 years; age range, 41-83 years). A dynamic coronal 3D FLASH sequence was performed at 1.5 T before and after injection of gadolinium-based contrast agent with an average temporal resolution of 3.8 seconds. Regions of interest were drawn on the abdominal aorta, portal vein, liver parenchyma, and HCC lesions by two observers in consensus. Time-activity curves were analyzed using a dual-input single-compartment model. The following perfusion parameters were obtained: arterial flow, portal venous flow, arterial fraction, distribution volume, and mean transit time (MTT).
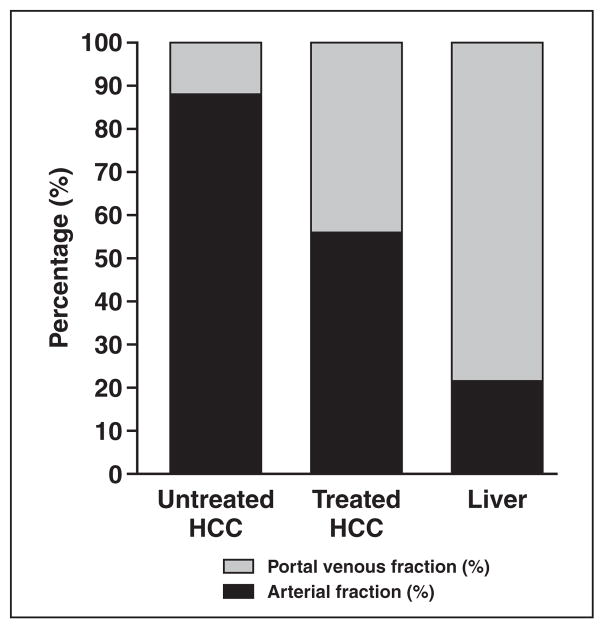
Results: Thirty-three HCCs (mean size, 3.9 cm; range, 1.1-12.6 cm) were evaluated in 26 patients. When compared with liver parenchyma, HCC showed significantly higher arterial hepatic blood flow and arterial fraction (p < 0.0001) and significantly lower distribution volume and portal venous hepatic blood flow (p < 0.0001-0.023), with no difference in MTT. Untreated HCCs (n = 16) had a higher arterial fraction and lower portal venous hepatic blood flow value than chemoembolized HCCs (n = 17, p < 0.04).
Conclusion: DCE-MRI can be used to quantify perfusion metrics of HCC and liver parenchyma and to assess perfusion changes after HCC chemoembolization.
Figures
References
-
- Nakashima T, Kojiro M. Pathologic characteristics of hepatocellular carcinoma. Semin Liver Dis. 1986;6:259–266. - PubMed
-
- Ng IO, Poon RT, Lee JM, Fan ST, Ng M, Tso WK. Microvessel density, vascular endothelial growth factor and its receptors Flt-1 and Flk-1/KDR in hepatocellular carcinoma. Am J Clin Pathol. 2001;116:838–845. - PubMed
-
- Dhar DK, Naora H, Yamanoi A, et al. Requisite role of VEGF receptors in angiogenesis of hepatocellular carcinoma: a comparison with angiopoietin/Tie pathway. Anticancer Res. 2002;22:379–386. - PubMed
-
- Connolly DT. Vascular permeability factor: a unique regulator of blood vessel function. J Cell Biochem. 1991;47:219–223. - PubMed
Publication types
MeSH terms
Substances
Grants and funding
LinkOut - more resources
Full Text Sources
Other Literature Sources
Medical
