

In silico profiling of Escherichia coli and Saccharomyces cerevisiae as terpenoid factories
- PMID: 24059635
- PMCID: PMC3852115
- DOI: 10.1186/1475-2859-12-84
In silico profiling of Escherichia coli and Saccharomyces cerevisiae as terpenoid factories
Abstract
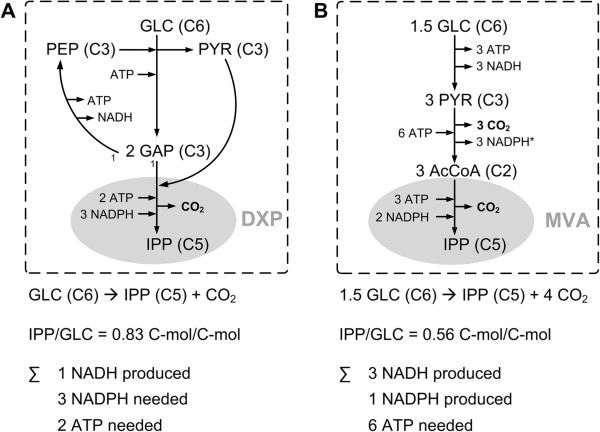
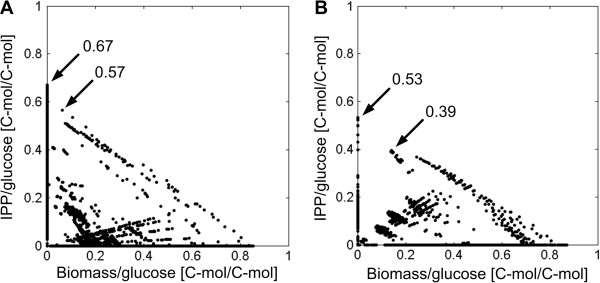
Background: Heterologous microbial production of rare plant terpenoids of medicinal or industrial interest is attracting more and more attention but terpenoid yields are still low. Escherichia coli and Saccharomyces cerevisiae are the most widely used heterologous hosts; a direct comparison of both hosts based on experimental data is difficult though. Hence, the terpenoid pathways of E. coli (via 1-deoxy-D-xylulose 5-phosphate, DXP) and S. cerevisiae (via mevalonate, MVA), the impact of the respective hosts metabolism as well as the impact of different carbon sources were compared in silico by means of elementary mode analysis. The focus was set on the yield of isopentenyl diphosphate (IPP), the general terpenoid precursor, to identify new metabolic engineering strategies for an enhanced terpenoid yield.
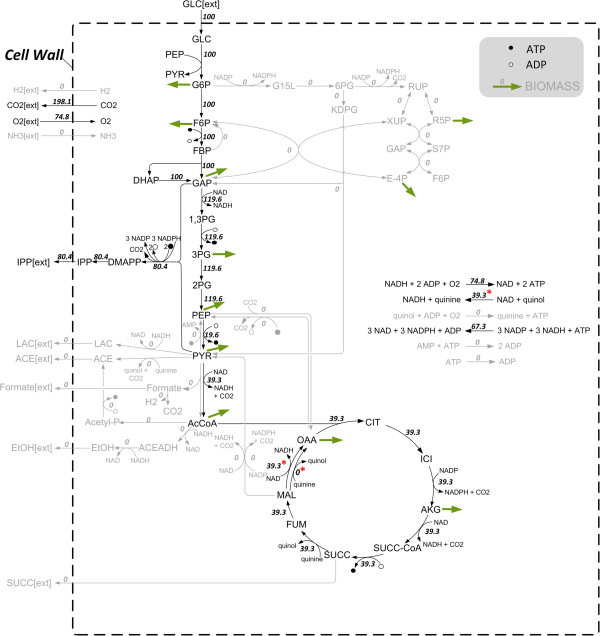
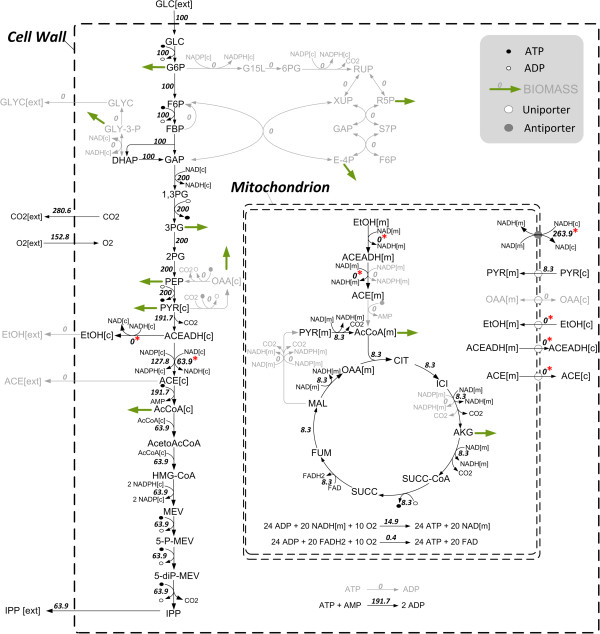
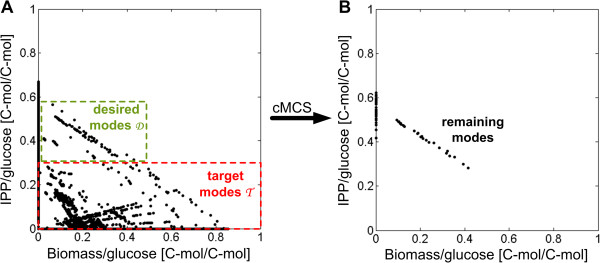
Results: Starting from the respective precursor metabolites of the terpenoid pathways (pyruvate and glyceraldehyde-3-phosphate for the DXP pathway and acetyl-CoA for the MVA pathway) and considering only carbon stoichiometry, the two terpenoid pathways are identical with respect to carbon yield. However, with glucose as substrate, the MVA pathway has a lower potential to supply terpenoids in high yields than the DXP pathway if the formation of the required precursors is taken into account, due to the carbon loss in the formation of acetyl-CoA. This maximum yield is further reduced in both hosts when the required energy and reduction equivalents are considered. Moreover, the choice of carbon source (glucose, xylose, ethanol or glycerol) has an effect on terpenoid yield with non-fermentable carbon sources being more promising. Both hosts have deficiencies in energy and redox equivalents for high yield terpenoid production leading to new overexpression strategies (heterologous enzymes/pathways) for an enhanced terpenoid yield. Finally, several knockout strategies are identified using constrained minimal cut sets enforcing a coupling of growth to a terpenoid yield which is higher than any yield published in scientific literature so far.
Conclusions: This study provides for the first time a comprehensive and detailed in silico comparison of the most prominent heterologous hosts E. coli and S. cerevisiae as terpenoid factories giving an overview on several promising metabolic engineering strategies paving the way for an enhanced terpenoid yield.
Figures
Similar articles
-
Engineering a functional 1-deoxy-D-xylulose 5-phosphate (DXP) pathway in Saccharomyces cerevisiae.Metab Eng. 2016 Nov;38:494-503. doi: 10.1016/j.ymben.2016.10.017. Epub 2016 Oct 27. Metab Eng. 2016. PMID: 27989805 Free PMC article.
-
Primary and Secondary Metabolic Effects of a Key Gene Deletion (ΔYPL062W) in Metabolically Engineered Terpenoid-Producing Saccharomyces cerevisiae.Appl Environ Microbiol. 2019 Mar 22;85(7):e01990-18. doi: 10.1128/AEM.01990-18. Print 2019 Apr 1. Appl Environ Microbiol. 2019. PMID: 30683746 Free PMC article.
-
Identifying and engineering the ideal microbial terpenoid production host.Appl Microbiol Biotechnol. 2019 Jul;103(14):5501-5516. doi: 10.1007/s00253-019-09892-y. Epub 2019 May 25. Appl Microbiol Biotechnol. 2019. PMID: 31129740 Free PMC article. Review.
-
In Vivo Validation of In Silico Predicted Metabolic Engineering Strategies in Yeast: Disruption of α-Ketoglutarate Dehydrogenase and Expression of ATP-Citrate Lyase for Terpenoid Production.PLoS One. 2015 Dec 23;10(12):e0144981. doi: 10.1371/journal.pone.0144981. eCollection 2015. PLoS One. 2015. PMID: 26701782 Free PMC article.
-
Metabolic Engineering Strategies for Sustainable Terpenoid Flavor and Fragrance Synthesis.J Agric Food Chem. 2020 Sep 23;68(38):10252-10264. doi: 10.1021/acs.jafc.9b06203. Epub 2020 Jan 7. J Agric Food Chem. 2020. PMID: 31865696 Review.
Cited by
-
Recent advances in elementary flux modes and yield space analysis as useful tools in metabolic network studies.World J Microbiol Biotechnol. 2015 Sep;31(9):1315-28. doi: 10.1007/s11274-015-1887-1. Epub 2015 Jun 12. World J Microbiol Biotechnol. 2015. PMID: 26066363 Review.
-
Biotechnological production of limonene in microorganisms.Appl Microbiol Biotechnol. 2016 Apr;100(7):2927-38. doi: 10.1007/s00253-016-7337-7. Epub 2016 Feb 26. Appl Microbiol Biotechnol. 2016. PMID: 26915992 Free PMC article. Review.
-
Modeling of Dolichol Mass Spectra Isotopic Envelopes as a Tool to Monitor Isoprenoid Biosynthesis.Plant Physiol. 2017 Jun;174(2):857-874. doi: 10.1104/pp.17.00036. Epub 2017 Apr 6. Plant Physiol. 2017. PMID: 28385729 Free PMC article.
-
An Artificial Pathway for Isoprenoid Biosynthesis Decoupled from Native Hemiterpene Metabolism.ACS Synth Biol. 2019 Feb 15;8(2):232-238. doi: 10.1021/acssynbio.8b00383. Epub 2019 Jan 16. ACS Synth Biol. 2019. PMID: 30648856 Free PMC article.
-
Patchoulol Production with Metabolically Engineered Corynebacterium glutamicum.Genes (Basel). 2018 Apr 17;9(4):219. doi: 10.3390/genes9040219. Genes (Basel). 2018. PMID: 29673223 Free PMC article.
References
Publication types
MeSH terms
Substances
LinkOut - more resources
Full Text Sources
Other Literature Sources
Molecular Biology Databases
