

Benchmarking of protein descriptor sets in proteochemometric modeling (part 2): modeling performance of 13 amino acid descriptor sets
- PMID: 24059743
- PMCID: PMC4015169
- DOI: 10.1186/1758-2946-5-42
Benchmarking of protein descriptor sets in proteochemometric modeling (part 2): modeling performance of 13 amino acid descriptor sets
Abstract
Background: While a large body of work exists on comparing and benchmarking descriptors of molecular structures, a similar comparison of protein descriptor sets is lacking. Hence, in the current work a total of 13 amino acid descriptor sets have been benchmarked with respect to their ability of establishing bioactivity models. The descriptor sets included in the study are Z-scales (3 variants), VHSE, T-scales, ST-scales, MS-WHIM, FASGAI, BLOSUM, a novel protein descriptor set (termed ProtFP (4 variants)), and in addition we created and benchmarked three pairs of descriptor combinations. Prediction performance was evaluated in seven structure-activity benchmarks which comprise Angiotensin Converting Enzyme (ACE) dipeptidic inhibitor data, and three proteochemometric data sets, namely (1) GPCR ligands modeled against a GPCR panel, (2) enzyme inhibitors (NNRTIs) with associated bioactivities against a set of HIV enzyme mutants, and (3) enzyme inhibitors (PIs) with associated bioactivities on a large set of HIV enzyme mutants.
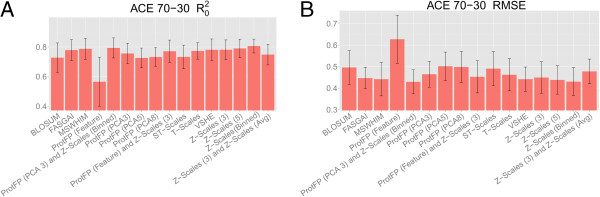
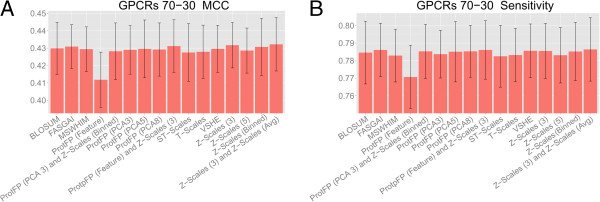
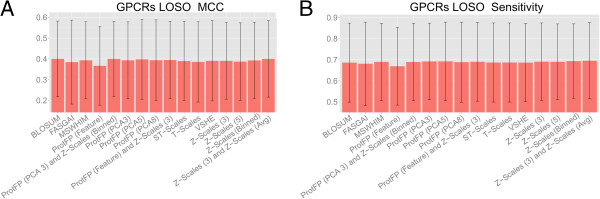
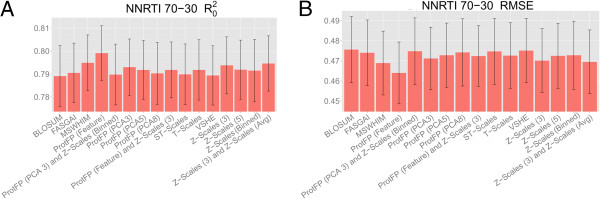
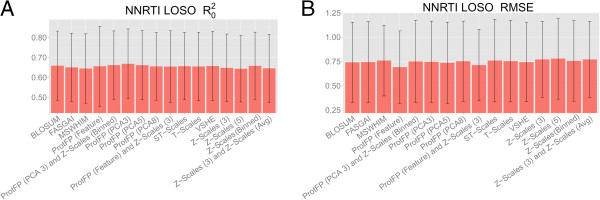
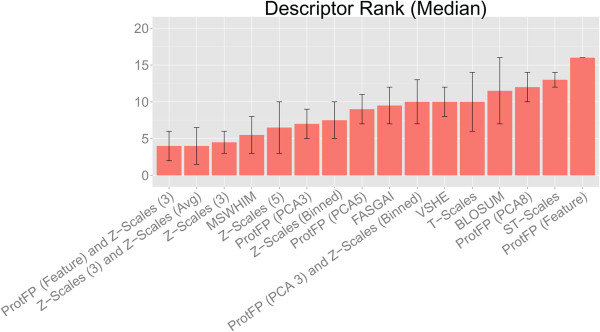
Results: The amino acid descriptor sets compared here show similar performance (<0.1 log units RMSE difference and <0.1 difference in MCC), while errors for individual proteins were in some cases found to be larger than those resulting from descriptor set differences ( > 0.3 log units RMSE difference and >0.7 difference in MCC). Combining different descriptor sets generally leads to better modeling performance than utilizing individual sets. The best performers were Z-scales (3) combined with ProtFP (Feature), or Z-Scales (3) combined with an average Z-Scale value for each target, while ProtFP (PCA8), ST-Scales, and ProtFP (Feature) rank last.
Conclusions: While amino acid descriptor sets capture different aspects of amino acids their ability to be used for bioactivity modeling is still - on average - surprisingly similar. Still, combining sets describing complementary information consistently leads to small but consistent improvement in modeling performance (average MCC 0.01 better, average RMSE 0.01 log units lower). Finally, performance differences exist between the targets compared thereby underlining that choosing an appropriate descriptor set is of fundamental for bioactivity modeling, both from the ligand- as well as the protein side.
Figures


Similar articles
-
Benchmarking of protein descriptor sets in proteochemometric modeling (part 1): comparative study of 13 amino acid descriptor sets.J Cheminform. 2013 Sep 23;5(1):41. doi: 10.1186/1758-2946-5-41. J Cheminform. 2013. PMID: 24059694 Free PMC article.
-
Comprehensive comparison of twenty structural characterization scales applied as QSAM of antimicrobial dodecapeptides derived from Bac2A against P. aeruginosa.J Mol Graph Model. 2017 Jan;71:88-95. doi: 10.1016/j.jmgm.2016.11.003. Epub 2016 Nov 9. J Mol Graph Model. 2017. PMID: 27863328
-
Efficacy of different protein descriptors in predicting protein functional families.BMC Bioinformatics. 2007 Aug 17;8:300. doi: 10.1186/1471-2105-8-300. BMC Bioinformatics. 2007. PMID: 17705863 Free PMC article.
-
Data on the sequence-derived properties of gastric cancer - binding peptides.Data Brief. 2020 Feb 29;29:105351. doi: 10.1016/j.dib.2020.105351. eCollection 2020 Apr. Data Brief. 2020. PMID: 32181310 Free PMC article.
-
The recent progress in proteochemometric modelling: focusing on target descriptors, cross-term descriptors and application scope.Brief Bioinform. 2017 Jan;18(1):125-136. doi: 10.1093/bib/bbw004. Epub 2016 Feb 11. Brief Bioinform. 2017. PMID: 26873661 Review.
Cited by
-
ProtDCal: A program to compute general-purpose-numerical descriptors for sequences and 3D-structures of proteins.BMC Bioinformatics. 2015 May 16;16:162. doi: 10.1186/s12859-015-0586-0. BMC Bioinformatics. 2015. PMID: 25982853 Free PMC article.
-
Molecular Mingling: Multimodal Predictions of Ligand Promiscuity in Pentameric Ligand-Gated Ion Channels.Front Mol Biosci. 2022 May 9;9:860246. doi: 10.3389/fmolb.2022.860246. eCollection 2022. Front Mol Biosci. 2022. PMID: 35615739 Free PMC article.
-
Unprecedently Large-Scale Kinase Inhibitor Set Enabling the Accurate Prediction of Compound-Kinase Activities: A Way toward Selective Promiscuity by Design?J Chem Inf Model. 2016 Sep 26;56(9):1654-75. doi: 10.1021/acs.jcim.6b00122. Epub 2016 Aug 11. J Chem Inf Model. 2016. PMID: 27482722 Free PMC article.
-
PSnpBind-ML: predicting the effect of binding site mutations on protein-ligand binding affinity.J Cheminform. 2023 Mar 2;15(1):31. doi: 10.1186/s13321-023-00701-3. J Cheminform. 2023. PMID: 36864534 Free PMC article.
-
CalcAMP: A New Machine Learning Model for the Accurate Prediction of Antimicrobial Activity of Peptides.Antibiotics (Basel). 2023 Apr 7;12(4):725. doi: 10.3390/antibiotics12040725. Antibiotics (Basel). 2023. PMID: 37107088 Free PMC article.
References
-
- Wikberg JES, Mutulis F, Mutule I, Veiksina S, Lapinsh M, Petrovska R, Prusis P. In: Annals of the New York Academy of Sciences Volume 994. Braaten D, editor. New York: Blackwell Publishing Ltd; 2003. Melanocortin receptors: ligands and proteochemometrics modeling; pp. 21–26. - PubMed
-
- Van Westen GJP, Wegner JK, Ijzerman AP, Van Vlijmen HWT, Bender A. Proteochemometric modeling as a tool for designing selective compounds and extrapolating to novel targets. Med Chem Commun. 2011;5:16–30. doi: 10.1039/c0md00165a. - DOI
-
- Van Westen GJP, Van den Hoven OO, Van der Pijl R, Mulder-Krieger T, de Vries H, Wegner JK, Ijzerman AP, Van Vlijmen HWT, Bender A. Identifying novel adenosine receptor ligands by simultaneous proteochemometric modeling of Rat and human bioactivity data. J Med Chem. 2012;5(16):7010–7020. doi: 10.1021/jm3003069. - DOI - PubMed
LinkOut - more resources
Full Text Sources
Other Literature Sources
Miscellaneous
