

Archetypal analysis of diverse Pseudomonas aeruginosa transcriptomes reveals adaptation in cystic fibrosis airways
- PMID: 24059747
- PMCID: PMC3870984
- DOI: 10.1186/1471-2105-14-279
Archetypal analysis of diverse Pseudomonas aeruginosa transcriptomes reveals adaptation in cystic fibrosis airways
Abstract
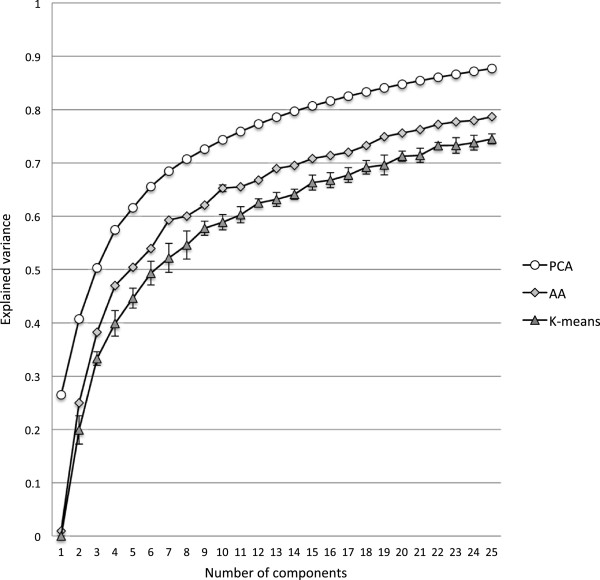
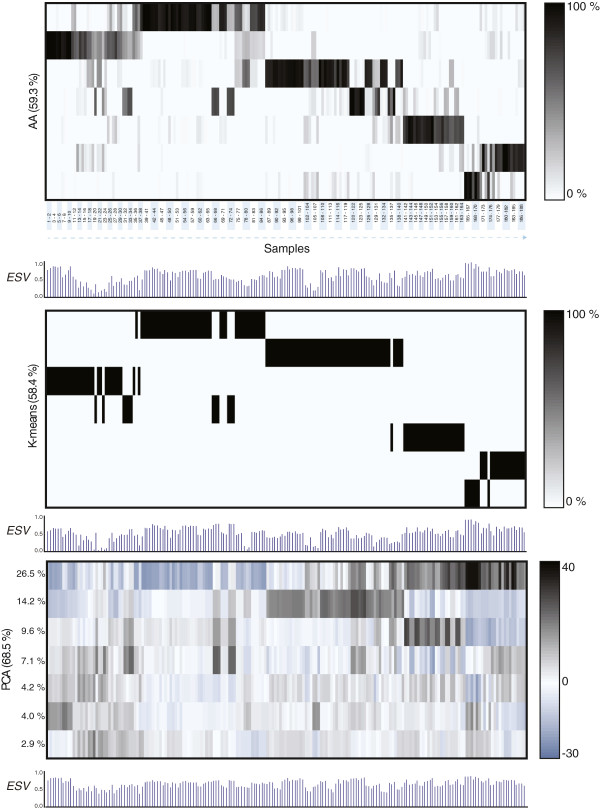
Background: Analysis of global gene expression by DNA microarrays is widely used in experimental molecular biology. However, the complexity of such high-dimensional data sets makes it difficult to fully understand the underlying biological features present in the data.The aim of this study is to introduce a method for DNA microarray analysis that provides an intuitive interpretation of data through dimension reduction and pattern recognition. We present the first "Archetypal Analysis" of global gene expression. The analysis is based on microarray data from five integrated studies of Pseudomonas aeruginosa isolated from the airways of cystic fibrosis patients.
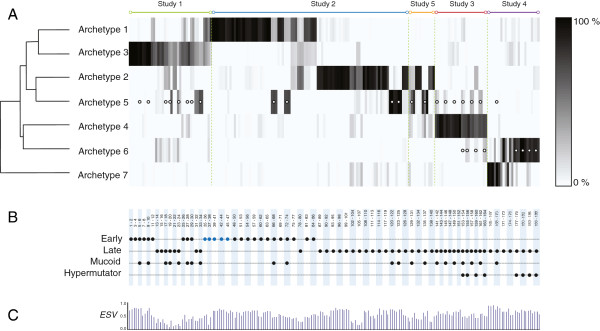
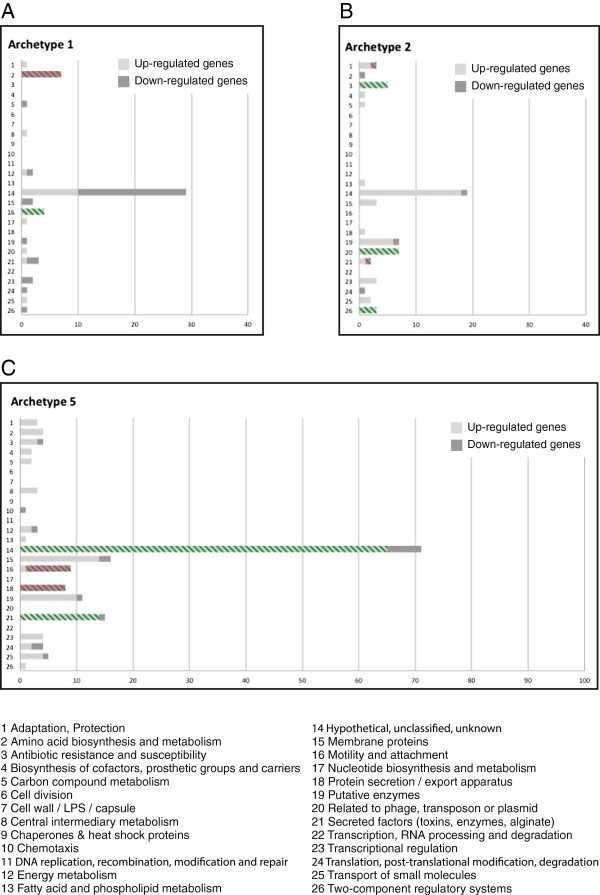
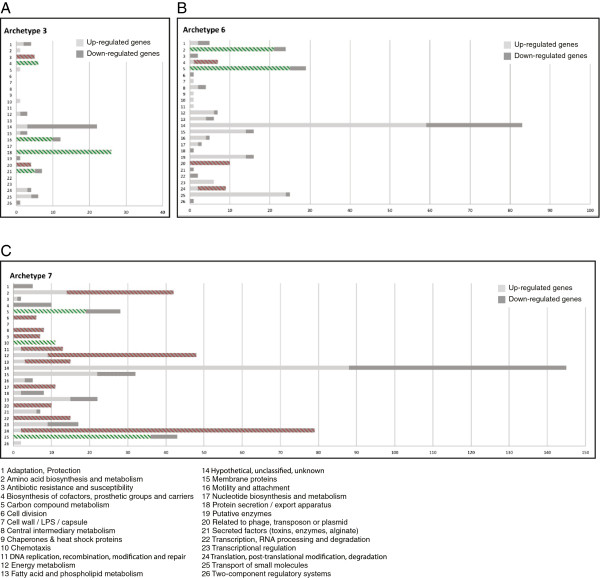
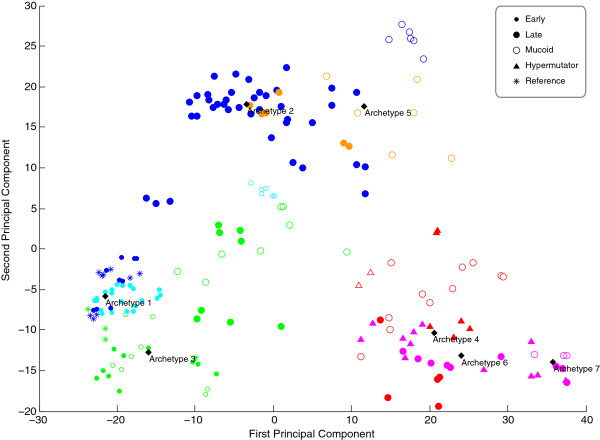
Results: Our analysis clustered samples into distinct groups with comprehensible characteristics since the archetypes representing the individual groups are closely related to samples present in the data set. Significant changes in gene expression between different groups identified adaptive changes of the bacteria residing in the cystic fibrosis lung. The analysis suggests a similar gene expression pattern between isolates with a high mutation rate (hypermutators) despite accumulation of different mutations for these isolates. This suggests positive selection in the cystic fibrosis lung environment, and changes in gene expression for these isolates are therefore most likely related to adaptation of the bacteria.
Conclusions: Archetypal analysis succeeded in identifying adaptive changes of P. aeruginosa. The combination of clustering and matrix factorization made it possible to reveal minor similarities among different groups of data, which other analytical methods failed to identify. We suggest that this analysis could be used to supplement current methods used to analyze DNA microarray data.
Figures

Similar articles
-
Genome mosaicism is conserved but not unique in Pseudomonas aeruginosa isolates from the airways of young children with cystic fibrosis.Environ Microbiol. 2003 Dec;5(12):1341-9. doi: 10.1111/j.1462-2920.2003.00518.x. Environ Microbiol. 2003. PMID: 14641578
-
Genetic adaptation of Pseudomonas aeruginosa to the airways of cystic fibrosis patients is catalyzed by hypermutation.J Bacteriol. 2008 Dec;190(24):7910-7. doi: 10.1128/JB.01147-08. Epub 2008 Oct 10. J Bacteriol. 2008. PMID: 18849421 Free PMC article.
-
Convergent evolution and adaptation of Pseudomonas aeruginosa within patients with cystic fibrosis.Nat Genet. 2015 Jan;47(1):57-64. doi: 10.1038/ng.3148. Epub 2014 Nov 17. Nat Genet. 2015. PMID: 25401299
-
Pseudomonas aeruginosa Evolutionary Adaptation and Diversification in Cystic Fibrosis Chronic Lung Infections.Trends Microbiol. 2016 May;24(5):327-337. doi: 10.1016/j.tim.2016.01.008. Epub 2016 Mar 3. Trends Microbiol. 2016. PMID: 26946977 Free PMC article. Review.
-
Evolutionary insight from whole-genome sequencing of Pseudomonas aeruginosa from cystic fibrosis patients.Future Microbiol. 2015;10(4):599-611. doi: 10.2217/fmb.15.3. Future Microbiol. 2015. PMID: 25865196 Review.
Cited by
-
Inferring biological tasks using Pareto analysis of high-dimensional data.Nat Methods. 2015 Mar;12(3):233-5, 3 p following 235. doi: 10.1038/nmeth.3254. Epub 2015 Jan 26. Nat Methods. 2015. PMID: 25622107
-
Archetypal analysis of COVID-19 in Montana, USA, March 13, 2020 to April 26, 2022.PLoS One. 2024 Jan 3;19(1):e0283265. doi: 10.1371/journal.pone.0283265. eCollection 2024. PLoS One. 2024. PMID: 38170725 Free PMC article.
-
Tumour heterogeneity and the evolutionary trade-offs of cancer.Nat Rev Cancer. 2020 Apr;20(4):247-257. doi: 10.1038/s41568-020-0241-6. Epub 2020 Feb 24. Nat Rev Cancer. 2020. PMID: 32094544 Review.
-
Environmental heterogeneity drives within-host diversification and evolution of Pseudomonas aeruginosa.mBio. 2014 Sep 16;5(5):e01592-14. doi: 10.1128/mBio.01592-14. mBio. 2014. PMID: 25227464 Free PMC article.
-
Analysis of Genome-scale Expression Network in Four Major Bacterial Residents of Cystic Fibrosis Lung.Curr Genomics. 2014 Oct;15(5):408-18. doi: 10.2174/1389202915666140818205444. Curr Genomics. 2014. PMID: 25435803 Free PMC article.
References
-
- Liu W, Wang B, Glassey J, Martin E, Zhao J. A novel methodology for finding the regulation on gene expression data. Proc Natl Acad Sci U S A. 2009;19:267–272.
-
- Quackenbush J. Computational analysis of microarray data: nature reviews. Genetics. 2001;2:418–427. - PubMed
-
- Mørup M, Hansen LK. Archetypal analysis for machine learning and data mining. Neurocomputing. 2012;80:54–63.
Publication types
MeSH terms
LinkOut - more resources
Full Text Sources
Other Literature Sources
Medical
