Review
. 2013;5(5):553-68.
doi: 10.2217/epi.13.43.

DNA methylation and differentiation: silencing, upregulation and modulation of gene expression

Affiliations
Review

DNA methylation and differentiation: silencing, upregulation and modulation of gene expression

Melanie Ehrlich et al. Epigenomics. 2013.

Abstract

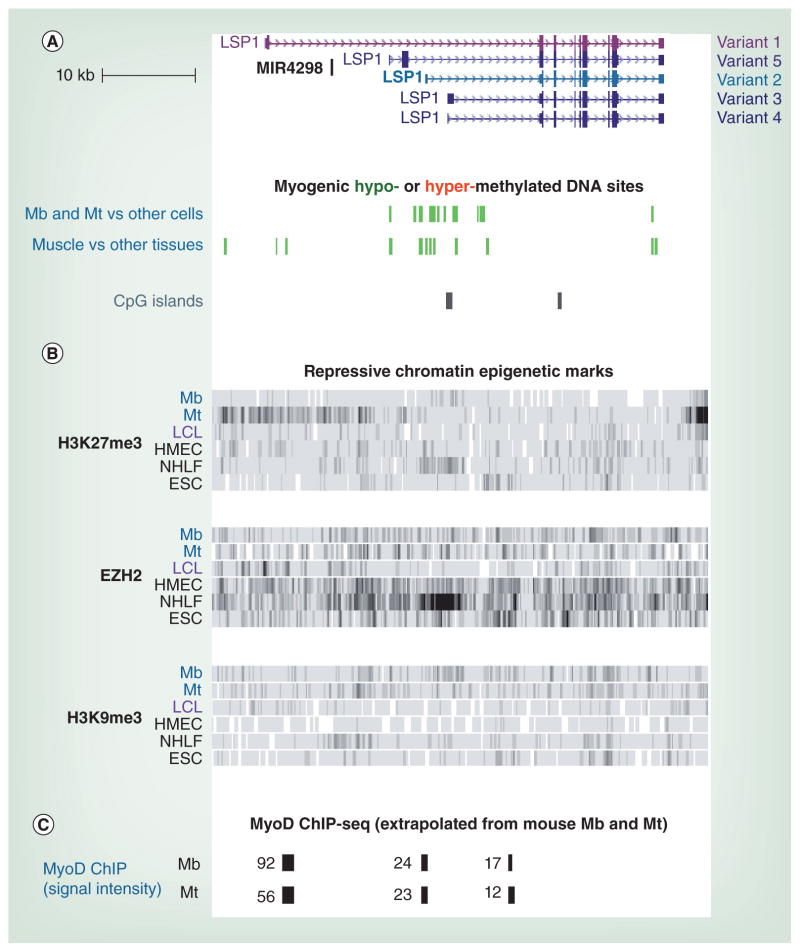
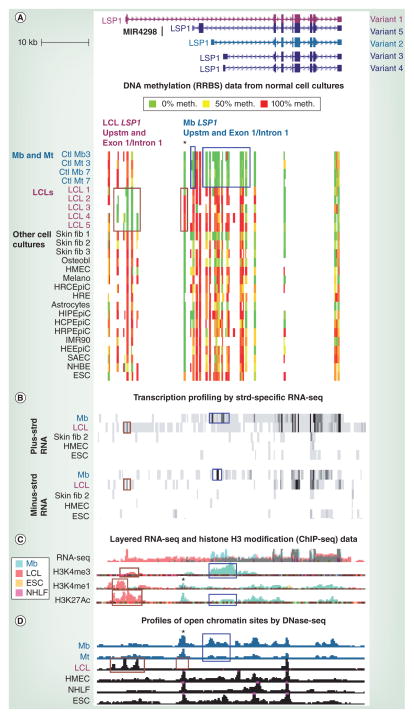
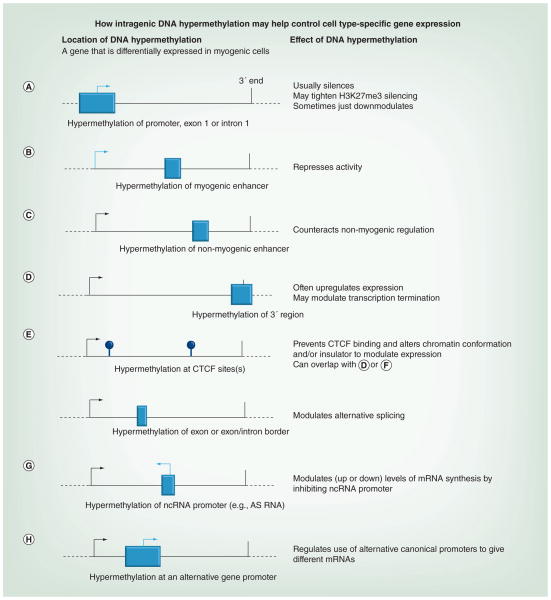
Differentiation-related DNA methylation is receiving increasing attention, partly owing to new, whole-genome analyses. These revealed that cell type-specific differential methylation in gene bodies is more frequent than in promoters. We review new insights into the functionality of DNA methylation during differentiation, with emphasis on the methylomes of myoblasts, myotubes and skeletal muscle versus non-muscle samples. Biostatistical analyses of data from reduced representation bisulfite sequencing are discussed. Lastly, a model is presented for how promoter and intragenic DNA hypermethylation affect gene expression, including increasing the efficiency of polycomb silencing at some promoters, downmodulating other promoters rather than silencing them, counteracting enhancers with heterologous specificity, altering chromatin conformation by inhibiting the binding of CTCF, modulating mRNA transcript levels by inhibiting overlapping promoters of noncoding RNA genes or by regulating the use of alternative mRNA promoters, modulating transcription termination, regulating alternative splicing and acting as barriers to the spread of activating chromatin.


Figures

Figure 1
Figure 1. Myoblast-specific differential DNA methylation, but not H3K27 or H3K9 trimethylation, is implicated in myoblast-specific promoter usage for LSP1
(A) RefSeq gene variants for LSP1 are shown. The lymphoid-specific gene variant and the most prominent Mb-specific variant are indicated in pink and blue, respectively. Underneath are custom tracks for differential methylation between myogenic and non-myogenic samples (p < 0.01 difference). Significant myogenic hypomethylation, but not myogenic hypermethylation, was observed. The depicted region in this figure and Figure 2 is chromosome 11: 1,868,993–1,917,902 (hg19). All tracks are aligned. At this scale, most individual differentially methylated sites cannot be resolved from neighboring differentially methylated sites. (B) ChIP-seq profiles of characteristically repressive chromatin marks are shown (ENCODE/histone modifications, Broad Institute [MA, USA]). The shading of the bars is proportional to the intensity of the signal. In the Mb sample, note the lack of H3K27me3, EZH2 and H3K9me3 signal at the 5′ region of LCL-specific variant 1. Reciprocally, in the LCL, there was no signal for these typically repressive chromatin marks at the 5′ region of the major Mb-specific variant 2. (C) Data from Myod ChIP-seq on murine C2C12 Mb and Mt cell cultures was extrapolated to orthologous human sequences. The numbers indicate the relative signal intensity, with >50 indicating strong binding. ChIP-seq: Chromatin immunoprecipitation coupled with next-generation DNA sequencing; ESC: Embryonic stem cell; HMEC: Human mammary epithelial cell; LCL: Lymphoblastoid cell line; Mb: Myoblast; Mt: Myotube; NHLF: Normal human lung fibroblast. (B) Data taken from [101]. (C) Data taken from [67].
Figure 2
Figure 2. Opposite distributions of DNA methylation and open chromatin in myoblast and lymphoblastoid cell line samples were correlated with LSP1 alternative promoter usage (facing page)
(A) RRBS data tracks (ENCODE/DNA methylation by reduced representation bisulfite sequencing; HudsonAlpha Institute for Biotechnology, AL, USA) for the region in Figure 1 are illustrated. Each culture is from a different individual except for Mb and Mt samples with the same number. The average methylation level of each detected CpG is shown according to the indicated color scheme; intermediate values are indicated by intermediate colors. At this scale, almost all the signal seen in the figure is from clusters of CpGs rather than individual CpGs. Blue boxes show myogenic DNA hypomethylation at the Mb-specific variant 2 upstm region, exon 1 and part of intron 1. Wide or narrow brown boxes show LCL-specific hypomethylation or hypermethylation, respectively. (B) Strd-specific RNA-seq profiles (ENCODE/long RNA-seq, polyA+, Cold Spring Harbor [NY, USA]) are shown for the indicated cell types (vertical viewing range 1–100 for the plus strd and 1–10 for the minus strd). Blue and brown boxes denote Mb- and LCL-specific signal, respectively, for exon 1 sense RNA or nearby antisense RNA signal. The multiple exons in the blue boxed region for Mb are from the first exons of variant 2 and other, less prevalent, Mb-specific RNAs that are similar, but not identical to, variants 3 and 4 (Cufflinks analysis [69]). (C) RNA-seq (not strd-specific; ENCODE/ CalTech [CA, USA]) and modified-H3 ChIP-seq (ENCODE/histone modification, Broad Institute [MA, USA]) are shown with results for four cell types superimposed, as indicated by the color key. Blue boxes denote Mb-specific H3 modifications characteristic of active promoters and brown boxes show LCL-specific H3 modifications typical of active promoters or enhancers. (D) DNaseI hypersensitivity mapping (ENCODE/DNase sequencing, Duke University [NC, USA]) using Mb and Mt samples that overlapped those of (A). Combined results from two to three biological replicates are shown. Boxes show the Mb-, Mt- or LCL-specific DNase sequencing peaks in promoter or enhancer regions. The only LCL shown is LCL1, but the other four LCL samples gave similar results. Asterisks mark the subregion with LCL-associated hypermethylation and a DNase-seq peak seen in all cell types other than in LCLs. ChIP-seq: Chromatin immunoprecipitation coupled with next-generation DNA sequencing; Ctl: Control; ESC: Embryonic stem cell; HCPEpiC: Choroid plexus epithelial cell; HEEpiC: Esophageal epithelial cell; HIPEpiC: Iris pigment epithelial cell; HMEC: Human mammary epithelial cell; HRCEpiC: Retinal pigment epithelial cell; HRE: Renal epithelial cell; HRPEpiC: Retinal pigment epithelial cell; IMR90: Fetal lung fibroblast; LCL: Lymphoblastoid cell line; Melano: Melanocyte; Mb: Myoblast; Mt: Myotube; NHBE: Bronchial epithelial cell; NHLF: Normal human lung fibroblast; Osteobl: Osteoblast; RNA-seq: RNA sequencing; RRBS: Reduced representation bisulfite sequencing; SAEC: Small airway epithelial cell; Skin fib 1: Fibroblast cell strain from a child; Skin fib 2: A neonatal foreskin fibroblast cell strain; Skin fib 3: A different neonatal foreskin fibroblast cell strain; Strd: Strand; Upstm: Upstream. Data taken from [101].
Figure 3
Figure 3. Model for the differentiation-associated regulation of gene expression by DNA hypermethylation
Some known or proposed types of DNA methylation-dependent control of gene expression using the example of myogenesis-associated DNA hypermethylation are shown. The model depicts just cis-acting regulation from within the gene or from its canonical promoter. DNA methylation changes may be stabilizing and/or initiating the depicted changes in transcription. Boxes show hypermethylated differentially methylated regions. Light arrows indicate inhibited transcription start sites and black arrows indicate active transcription start sites that were not silenced by DNA methylation. (A) Hypermethylation of the promoter region, exon 1 or intron 1. (B) Hypermethylation of a myogenic enhancer in nonmyogenic cells. (C) Hypermethylation of a non-myogenic enhancer in myogenic cells. (D) Hypermethylation of the 3′ region. (E) Hypermethylation at CTCF sites (lollipops) somewhere in the gene. (F) Hypermethylation in an exon or at an exon/ intron border. (G) Hypermethylation of an intragenic ncRNA promoter. (H) Hypermethylation of an alternative promoter for a gene. AS: Antisense.

References

    1. Meissner A, Mikkelsen TS, Gu H, et al. Genome-scale DNA methylation maps of pluripotent and differentiated cells. Nature. 2008;454(7205):766–770. - PMC - PubMed
    1. Ndlovu MN, Denis H, Fuks F. Exposing the DNA methylome iceberg. Trends Biochem Sci. 2011;36(7):381–387. - PubMed
    1. Lister R, Pelizzola M, Dowen RH, et al. Human DNA methylomes at base resolution show widespread epigenomic differences. Nature. 2009;462(7271):315–322. - PMC - PubMed
    1. Wang H, Maurano MT, Qu H, et al. Widespread plasticity in CTCF occupancy linked to DNA methylation. Genome Res. 2012;22(9):1680–1688. - PMC - PubMed
    1. Zhou Y, Lu Y, Tian W. Epigenetic features are significantly associated with alternative splicing. BMC Genome. 2012;13:123. - PMC - PubMed

Website

    1. UCSC Genome Bioinformatics. http://genome.ucsc.edu.

Publication types

LinkOut - more resources