. 2014 Jan 1:84:796-809.
doi: 10.1016/j.neuroimage.2013.09.025. Epub 2013 Sep 20.

Characterization of a normal control group: are they healthy?

Affiliations

Characterization of a normal control group: are they healthy?

C J Aine et al. Neuroimage. .

Abstract

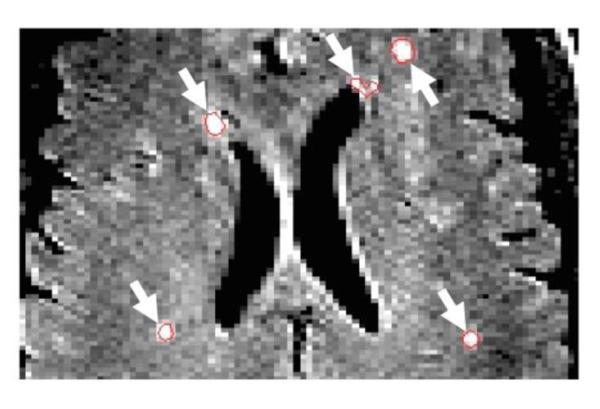
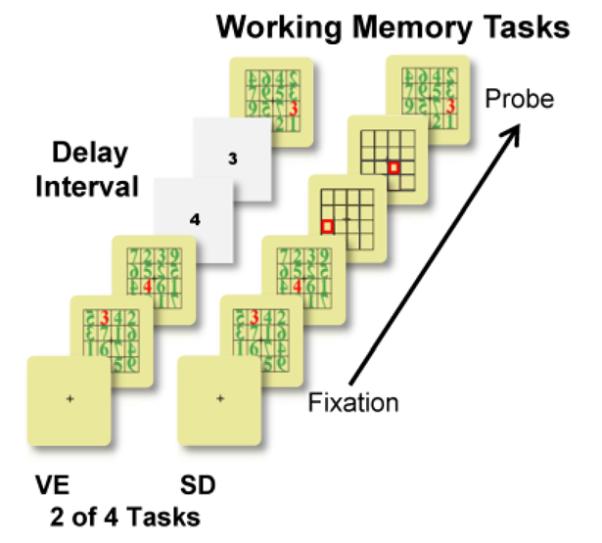
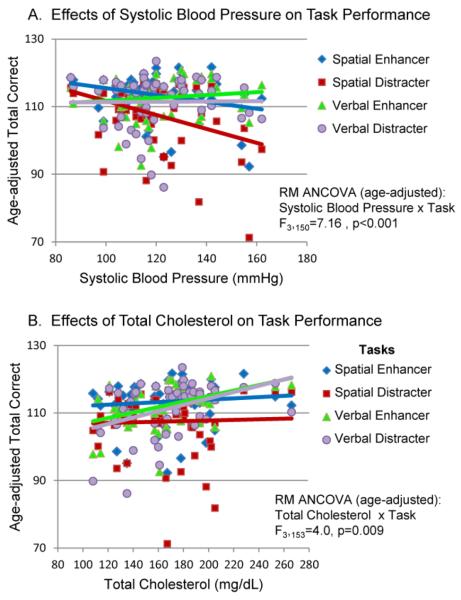
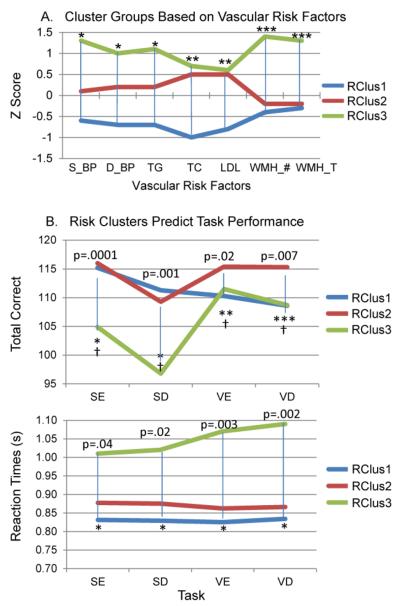
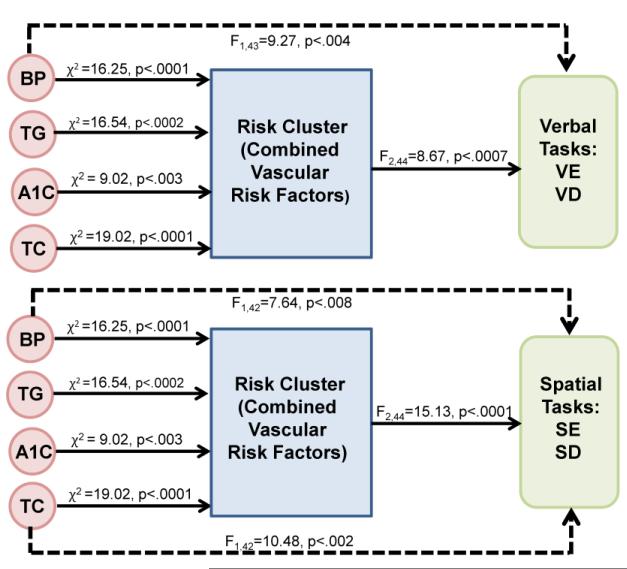
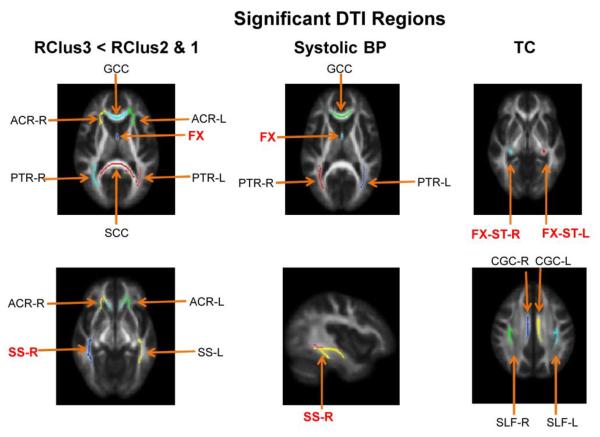
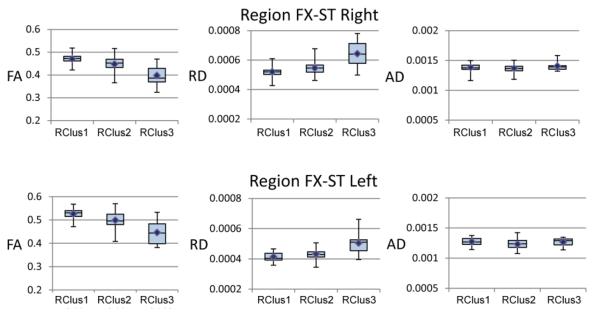
We examined the health of a control group (18-81years) in our aging study, which is similar to control groups used in other neuroimaging studies. The current study was motivated by our previous results showing that one third of the elder control group had moderate to severe white matter hyperintensities and/or cortical volume loss which correlated with poor performance on memory tasks. Therefore, we predicted that cardiovascular risk factors (e.g., hypertension, high cholesterol) within the control group would account for significant variance on working memory task performance. Fifty-five participants completed 4 verbal and spatial working memory tasks, neuropsychological exams, diffusion tensor imaging (DTI), and blood tests to assess vascular risk. In addition to using a repeated measures ANOVA design, a cluster analysis was applied to the vascular risk measures as a data reduction step to characterize relationships between conjoint risk factors. The cluster groupings were used to predict working memory performance. The results show that higher levels of systolic blood pressure were associated with: 1) poor spatial working memory accuracy; and 2) lower fractional anisotropy (FA) values in multiple brain regions. In contrast, higher levels of total cholesterol corresponded with increased accuracy in verbal working memory. An association between lower FA values and higher cholesterol levels were identified in different brain regions from those associated with systolic blood pressure. The conjoint risk analysis revealed that Risk Cluster Group 3 (the group with the greatest number of risk factors) displayed: 1) the poorest performance on the spatial working memory tasks; 2) the longest reaction times across both spatial and verbal memory tasks; and 3) the lowest FA values across widespread brain regions. Our results confirm that a considerable range of vascular risk factors are present in a typical control group, even in younger individuals, which have robust effects on brain anatomy and function. These results present a new challenge to neuroimaging studies both for defining a cohort from which to characterize 'normative' brain circuitry and for establishing a control group to compare with other clinical populations.

Keywords: Aging; Blood pressure; Cholesterol; DTI; Vascular risk; Working memory.


Figures

Fig. 1
Fig. 1
WMHs Identified on FLAIR Axial Slices. Numbers and volumes of WMHs were calculated using JIM software. ROIs (see white arrows) highlight WMHs on an axial FLAIR MR slice.
Fig. 2
Fig. 2
Verbal and Spatial Working Memory Tasks. Four modified Sternberg tasks (2 spatial and 2 verbal) were used to test memory performance across age. Verbal and spatial tasks contained either: 1) enhancers in the delay interval (VE=verbal and SE=spatial tasks); or 2) distracters in the delay interval (VD=verbal and SD=spatial tasks). Two of the four are shown here (VE and SD). Displays appeared sequentially every 1.2 s with a 2 s inter-stimulus interval. Stimulus duration was 266 ms.
Fig. 3
Fig. 3
(A) Age-adjusted Task Performance and Systolic Blood Pressure. When task performance was age-adjusted across 4 working memory tasks an interaction between systolic blood pressure and task was found. Red (SD) and blue (SE) lines reflect significant negative linear relationships between systolic blood pressure and accuracy on the spatial tasks. (B) Age-adjusted verbal working memory performance measures and total cholesterol. Violet (VD) and green (VE) lines reflect significant positive linear relationships between total cholesterol and accuracy (Total correct) on the verbal memory tasks.
Fig. 4
Fig. 4
Cluster Groups based on Vascular Risk Factors Predict Task Performance. (A) All 3 cluster groups differed significantly in terms of blood pressure and triglyceride measures (*). RClus1 (blue lines) differed from RClus2 (red lines) & RClus3 (green lines) on TC and LDL measures (**). RClus3 differed from RClus1 & RClus2 in terms of total number of WMHs and total volume of WMHs (***). A1C and HDL measures were not included since they did not help to differentiate between the cluster groups. (B). RClus3, showing higher values on the risk factors, performed more poorly on spatial tasks (fewer Total correct and longer RTs) and had longer RTs on the verbal tasks. RClus2 performed better on verbal enhancer and distracter tasks (Total correct). For Total Correct: (*)=RClus3 < RClus1 & RClus2; (**)=RClus2 > RClus1; (***)=RClus2 > RClus1 & RClus3. For RT: (*)=RClus3 > RClus 2 & RClus1. Effects were still significant after age-correction: (†)=Age-adjusted differences in task performance (Total correct) at p<.05.
Fig. 5
Fig. 5
Path Analysis. Effects of Risk Cluster groups on verbal and spatial task accuracy along with independent and simultaneous effects of risk factors on task accuracy. These 4 risk factors (systolic blood pressure or BP, triglycerides or TG, total cholesterol or TC, and A1C) were entered into a path analysis based on Table 2 results. Solid lines at right of figure represent how well the Risk Cluster groups (combined risk factors for groups 1–3) predict performance on the verbal and spatial working memory tasks. Dashed lines represent how well the 4 risk factors independently predict performance on the verbal and spatial working memory tasks when Risk Cluster was in the model. Solid lines to the left of the Risk Cluster reflect results from a logistic regression (cumulative logit model) representing the 3 Risk Clusters.
Fig. 6
Fig. 6
DTI results. (A) Left column. Regions showing lower FA values (after FWER multiple comparison tests) for the RClus3 group (relative to RClus2 & 1). Middle column. Regions showing a significant negative correlation between systolic blood pressure and FA, with age correction. Right column. Regions showing a negative correlation between FA and TC, with age correction.
Fig. 7
Fig. 7
Box plots showing the pattern of effects across Risk Cluster groups for FA, RD and AD and region FX-ST (right and left).

References

    1. Abdul-Rahman MF, Qiu A, Sim K. Regionally specific white matter disruptions of fornix and cingulum in schizophrenia. PLoS One. 2011;6:e18652. - PMC - PubMed
    1. Aggleton JP, Vann SD, Saunders RC. Projections from the hippocampal region to the mammillary bodies in macaque monkeys. Eur J Neurosci. 2005;22:2519–2530. - PubMed
    1. Ahlskog JE, Geda YE, Graff-Radford NR, Petersen RC. Physical exercise as a preventive or disease-modifying treatment of dementia and brain aging. Mayo Clin Proc. 2011;86:876–884. - PMC - PubMed
    1. Aine CJ, Bryant JE, Knoefel JE, Adair JC, Hart B, Donahue CH, Montano R, Hayek R, Qualls C, Ranken D, Stephen JM. Different strategies for auditory word recognition in healthy versus normal aging. Neuroimage. 2010;49:3319–3330. - PMC - PubMed
    1. Aine CJ, Sanfratello L, Adair JC, Knoefel JE, Caprihan A, Stephen JM. Development and decline of memory functions in normal, pathological and healthy successful aging. Brain Topogr. 2011;24:323–339. - PMC - PubMed

Publication types