

Pleural ultrasonography versus chest radiography for the diagnosis of pneumothorax: review of the literature and meta-analysis
- PMID: 24060427
- PMCID: PMC4057340
- DOI: 10.1186/cc13016
Pleural ultrasonography versus chest radiography for the diagnosis of pneumothorax: review of the literature and meta-analysis
Abstract
Introduction: Ultrasonography is being increasingly utilized in acute care settings with expanding applications. Pneumothorax evaluation by ultrasonography is a fast, safe, easy and inexpensive alternative to chest radiographs. In this review, we provide a comprehensive analysis of the current literature comparing ultrasonography and chest radiography for the diagnosis of pneumothorax.
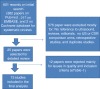
Methods: We searched English-language articles in MEDLINE, EMBASE and Cochrane Library dealing with both ultrasonography and chest radiography for diagnosis of pneumothorax. In eligible studies that met strict inclusion criteria, we conducted a meta-analysis to evaluate the diagnostic accuracy of pleural ultrasonography in comparison with chest radiography for the diagnosis of pneumothorax.
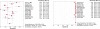
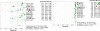
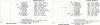
Results: We reviewed 601 articles and selected 25 original research articles for detailed review. Only 13 articles met all of our inclusion criteria and were included in the final analysis. One study used lung sliding sign alone, 12 studies used lung sliding and comet tail signs, and 6 studies searched for lung point in addition to the other two signs. Ultrasonography had a pooled sensitivity of 78.6% (95% CI, 68.1 to 98.1) and a specificity of 98.4% (95% CI, 97.3 to 99.5). Chest radiography had a pooled sensitivity of 39.8% (95% CI, 29.4 to 50.3) and a specificity of 99.3% (95% CI, 98.4 to 100). Our meta-regression and subgroup analyses indicate that consecutive sampling of patients compared to convenience sampling provided higher sensitivity results for both ultrasonography and chest radiography. Consecutive versus nonconsecutive sampling and trauma versus nontrauma settings were significant sources of heterogeneity. In addition, subgroup analysis showed significant variations related to operator and type of probe used.
Conclusions: Our study indicates that ultrasonography is more accurate than chest radiography for detection of pneumothorax. The results support the previous investigations in this field, add new valuable information obtained from subgroup analysis, and provide accurate estimates for the performance parameters of both bedside ultrasonography and chest radiography for pneumothorax evaluation.
Figures
Comment in
-
Thoracic ultrasonography versus chest radiography for detection of pneumothoraces: challenges in deriving and interpreting summary diagnostic accuracy estimates.Crit Care. 2014 Mar 6;18(2):416. doi: 10.1186/cc13759. Crit Care. 2014. PMID: 24976173 Free PMC article. No abstract available.
-
Thoracic ultrasonography versus chest radiography for detection of pneumothoraces: challenges in deriving and interpreting summary diagnostic accuracy estimates. Authors' response.Crit Care. 2014 Mar 6;18(2):416. Crit Care. 2014. PMID: 25180353 No abstract available.
References
-
- Lichtenstein DA, Menu Y. A bedside ultrasound sign ruling out pneumothorax in the critically ill. Lung Sliding Chest. 1995;17:1345–1348. - PubMed
-
- Havelock T, Teoh R, Laws D, Gleeson F. BTS Pleural Disease Guideline Group. Pleural procedures and thoracic ultrasound: British Thoracic Society Pleural Disease Guideline 2010. Thorax. 2010;17:ii61–76. doi:10.1136/thx.2010.137026. - PubMed
Publication types
MeSH terms
LinkOut - more resources
Full Text Sources
Other Literature Sources
Medical
Miscellaneous
