. 2013 Nov;33(22):4594-605.
doi: 10.1128/MCB.00695-13. Epub 2013 Sep 23.

Downregulation of PHLPP expression contributes to hypoxia-induced resistance to chemotherapy in colon cancer cells

Affiliations

Downregulation of PHLPP expression contributes to hypoxia-induced resistance to chemotherapy in colon cancer cells

Yang-An Wen et al. Mol Cell Biol. 2013 Nov.

Abstract

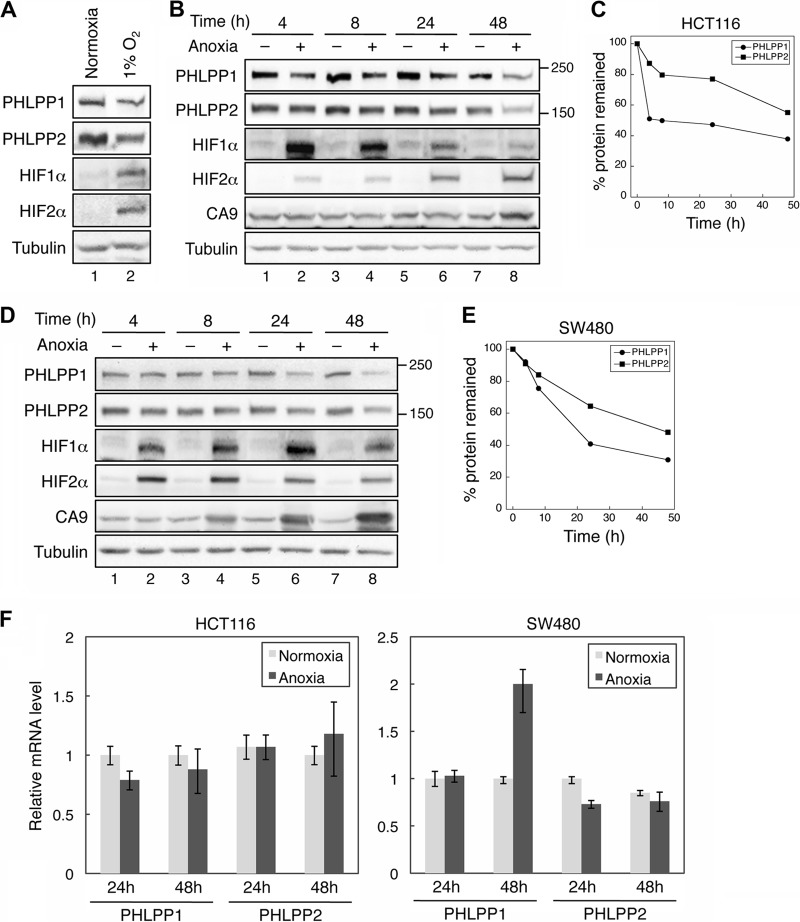
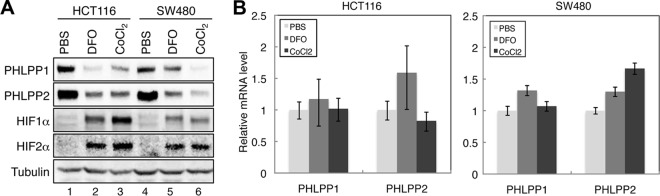
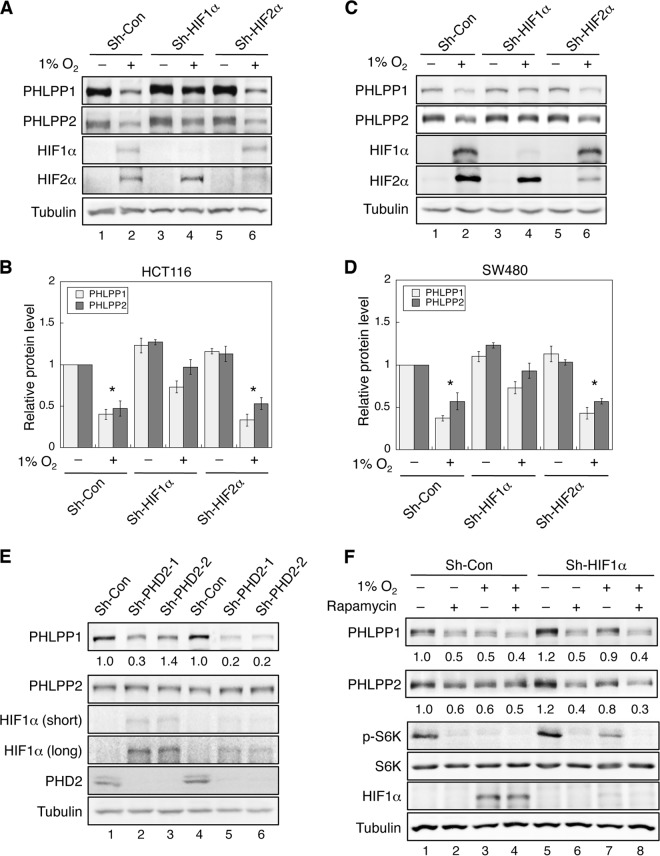
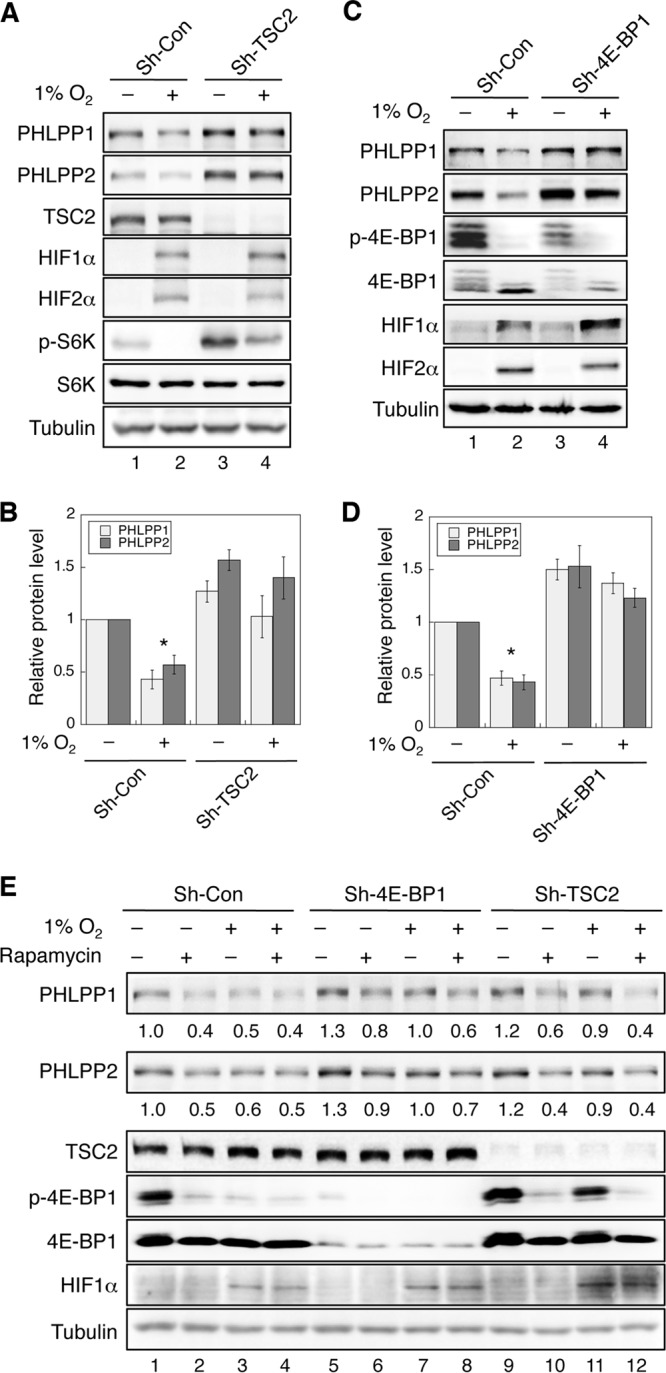
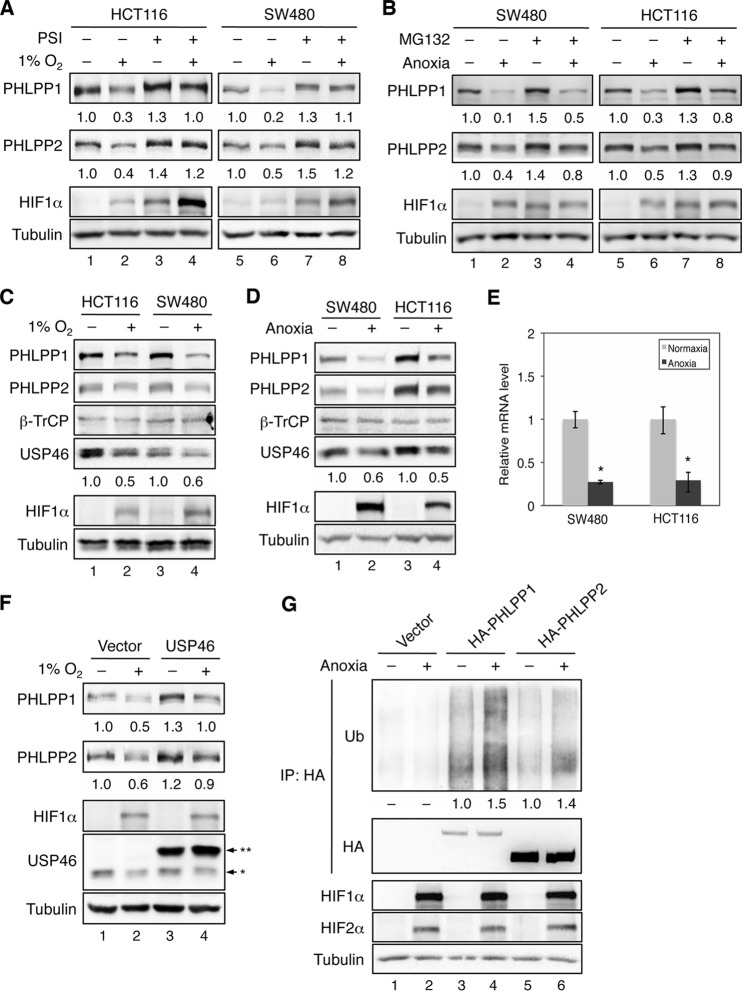
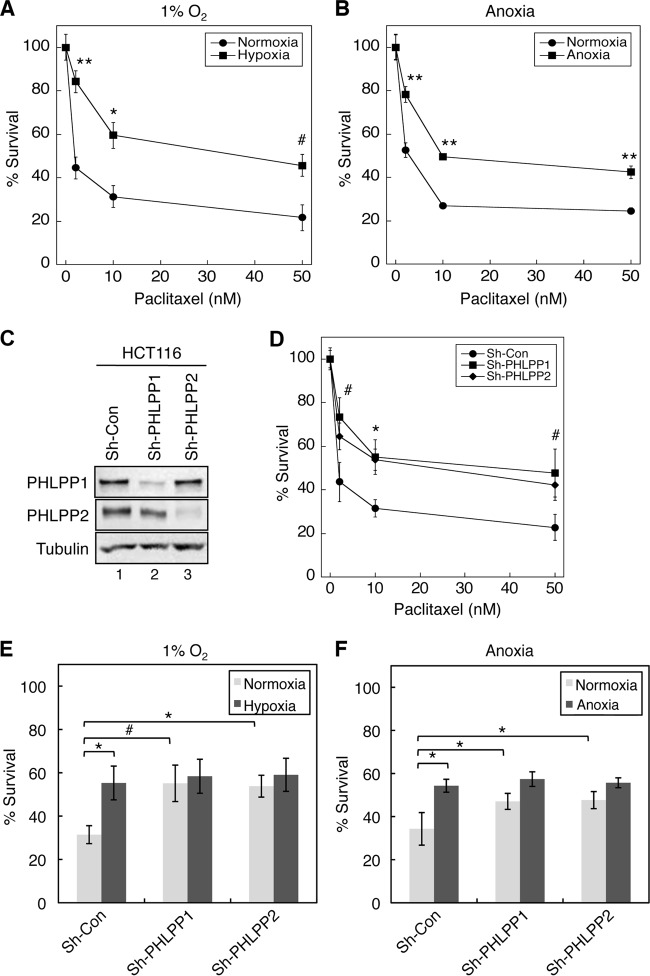
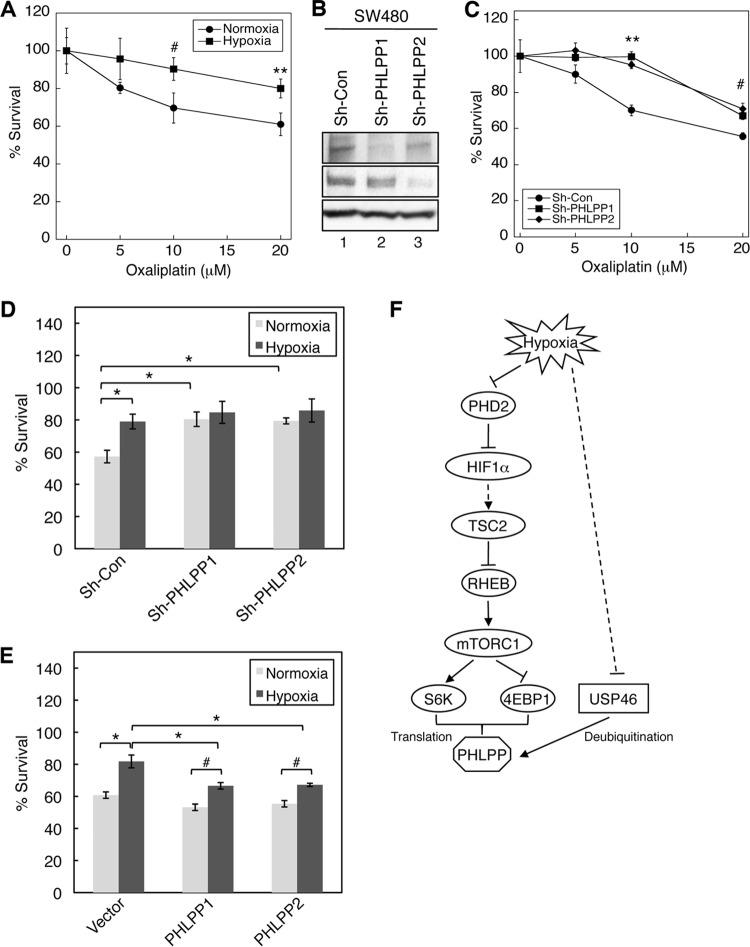
Hypoxia is a feature of solid tumors. Most tumors are at least partially hypoxic. This hypoxic environment plays a critical role in promoting resistance to anticancer drugs. PHLPP, a novel family of Ser/Thr protein phosphatases, functions as a tumor suppressor in colon cancers. Here, we show that the expression of both PHLPP isoforms is negatively regulated by hypoxia/anoxia in colon cancer cells. Interestingly, a hypoxia-induced decrease of PHLPP expression is attenuated by knocking down HIF1α but not HIF2α. Whereas the mRNA levels of PHLPP are not significantly altered by oxygen deprivation, the reduction of PHLPP expression is caused by decreased protein translation downstream of mTOR and increased degradation. Specifically, hypoxia-induced downregulation of PHLPP is partially rescued in TSC2 or 4E-BP1 knockdown cells as the result of elevated mTOR activity and protein synthesis. Moreover, oxygen deprivation destabilizes PHLPP protein by decreasing the expression of USP46, a deubiquitinase of PHLPP. Functionally, downregulation of PHLPP contributes to hypoxia-induced chemoresistance in colon cancer cells. Taken together, we have identified hypoxia as a novel mechanism by which PHLPP is downregulated in colon cancer, and the expression of PHLPP may serve as a biomarker for better understanding of chemoresistance in cancer treatment.


Figures

Fig 1
Fig 1
The protein but not mRNA expression of PHLPP isoforms is downregulated under hypoxia. (A) Hypoxia treatment decreases PHLPP expression. HCT116 cells cultured under normoxic condition or 1% O2 were analyzed for the expression of PHLPP1, PHLPP2, HIF1α, and HIF2α. Tubulin was used as the loading control throughout this study. (B to E) Time course of anoxia-induced PHLPP downregulation in colon cancer cells. SW480 (B and C) and HCT116 (D and E) cells were cultured under normoxic (−) or anoxic (+) conditions for the indicated times. Cell lysates were prepared and analyzed for the expression of PHLPP1, PHLPP2, HIF1α, HIF2α, and CA9 using corresponding antibodies. Representative Western blots are shown in panels B and D. Note that the major isoform of PHLPP1 expressed in colon cancer cells used in this study is PHLPP1β, which has a molecular mass of ∼190 kDa. The molecular mass of PHLPP2 is ∼160 kDa. The relative expression levels of PHLPP1 and PHLPP2 were quantified by normalizing the amount of PHLPP to tubulin and are expressed graphically in panels C and E. (F) The mRNA expression of PHLPP was not decreased in anoxia-treated cells. SW480 and HCT116 cells were exposed to anoxia for 24 or 48 h, and total RNA was extracted. Real-time RT-PCR analysis was performed using probes specific for the human PHLPP1 or PHLPP2 gene. Each experimental point was done in triplicates, and the graphs represent the means ± standard deviations. (n = 3).
Fig 2
Fig 2
Hypoxia-mimetic agents reduce the protein expression of both PHLPP isoforms. (A) HCT116 and SW480 cells were treated with PBS, DFO (100 μM), or CoCl2 (100 μM) for 24 h. Cell lysates were prepared and analyzed for the expression of PHLPP1, PHLPP2, HIF1α, HIF2α, and tubulin using corresponding antibodies. (B) Total RNAs were isolated from cells as treated as described for panel A. Real-time RT-PCR analysis was performed using probes specific for the human PHLPP1 or PHLPP2 gene. Each experimental point was done in triplicates, and the graphs represent the means ± standard deviations (n = 3).
Fig 3
Fig 3
Hypoxia-induced downregulation of PHLPP expression is HIF1α but not HIF2α dependent. (A to D) Knockdown of HIF1α but not HIF2α partially prevents hypoxia-induced downregulation of PHLPP. Stable control and HIF1α or HIF2α knockdown HCT116 (A and B) and SW480 cells (C and D) were exposed to normoxia (−) or hypoxia (1% O2; +) for 24 h. Cell lysates were prepared and analyzed for the expression of PHLPP1, PHLPP2, HIF1α, HIF2α, and tubulin using corresponding antibodies. Results shown in panels A and C were quantified by normalizing the expression of PHLPP isoforms to the level of tubulin and summarized in panels B and D. The relative expression of PHLPP for the control cells under normoxia was set to 1, and cells under all other conditions were compared accordingly. Data shown in graphs represent the means ± standard errors of the means (n = 3; *, P < 0.05, by a two-sample t test). (E) Knockdown of PHD2 results in an increase in HIF1α and a decrease in PHLPP expression in colon cancer cells. Cell lysates prepared from stable control and PHD2 knockdown HCT116 (lanes 1 to 3) and SW480 (lanes 4 to 6) cells were analyzed for the expression of PHLPP1, PHLPP2, HIF1α, PHD2, and tubulin using Western blotting. Two different PHD2 shRNA targeting constructs (sh-PHD2-1 and sh-PHD2-2) were used. The relative expression of PHLPP isoforms was quantified by normalizing ECL signals generated by the PHLPP antibodies to that of tubulin, and this number for the control cells was set to 1. The expression of PHLPP in PHD2 knockdown cells was normalized to the control cells, and the numbers are indicated below the PHLPP panels. (F) Stable control and HIF1α knockdown SW480 cells (Sh-Con and Sh-HIF1a, respectively) were exposed to normoxia (−) or hypoxia (1% O2; +) for 24 h in the presence or absence of rapamycin (20 nM). Cell lysates were analyzed for the expression of PHLPP1, PHLPP2, phospho-S6K (T389 site; p-S6K), total S6K, HIF1α, and tubulin using Western blotting. The expression of PHLPP was normalized to that of the control cells under normoxia, and the numbers are indicated below the PHLPP panels.
Fig 4
Fig 4
Hypoxia inhibits mTOR-mediated protein translation of PHLPP isoforms. (A) Knockdown of TSC2 rescues PHLPP expression under hypoxia. Stable control and TSC2 knockdown HCT116 cells were exposed to normoxia (−) or hypoxia (1% O2; +) for 24 h. The expression levels of PHLPP1, PHLPP2, TSC2, HIF1α, HIF2α, phospho-S6K (p-S6K), total S6K, and tubulin were analyzed using Western blotting. (B) The relative expression of PHLPP isoforms was quantified by normalizing ECL signals generated by the PHLPP antibodies to the level of tubulin, and this number for the control cells under normoxia was set to 1. The levels of PHLPP isoforms were compared to those of control cells under normoxia. Data shown in graphs represent the means ± standard errors of the means (n = 3; *, P < 0.05, by a two-sample t test). (C) Knockdown of 4E-BP1 rescues PHLPP expression under hypoxia. Stable control and 4E-BP1 knockdown HCT116 cells were exposed to normoxia (−) or hypoxia (1% O2; +) for 24 h. The expression levels of PHLPP1, PHLPP2, 4E-BP1, HIF1α, HIF2α, and tubulin were analyzed using Western blotting. (D) The relative expression levels of PHLPP1 and PHLPP2 were quantified by normalizing the values to the level of tubulin. The levels of PHLPP isoforms were compared to those of control cells under normoxia. Data shown in graphs represent the means ± standard errors of the means (n = 3; *, P < 0.05, by a two-sample t test). (E) Stable control, 4E-BP1, and TSC2 knockdown SW480 cells were exposed to normoxia or hypoxia for 24 h in the presence or absence of rapamycin (20 nM). Cell lysates were prepared and analyzed for the expression of PHLPP1, PHLPP2, TSC2, phospho-4E-BP1, total 4E-BP1, and tubulin using Western blotting. The expression of PHLPP was normalized to the level of the control cells under normoxia, and the numbers are indicated below the PHLPP panels.
Fig 5
Fig 5
Hypoxia promotes the degradation of PHLPP isoforms by downregulating USP46 deubiquitinase. (A) Hypoxia-induced downregulation of PHLPP is partially rescued by pretreating cells with proteasome inhibitor. HCT116 and SW480 cells were exposed to normoxia or 1% O2 for 24 h. During the last 3 h of incubation, cells were treated with dimethyl sulfoxide or a combination of bortezomib and carfilzomib (PSI; 10 nM each). (B) SW480 and HCT116 cells were exposed to normoxia or anoxia for 24 h. During the last 3 h of incubation, cells were treated with dimethyl sulfoxide or MG-132 (20 μM). The expression levels of PHLPP1, PHLPP2, and tubulin were analyzed using Western blotting. The normalized expression levels of PHLPP1 and PHLPP2 are indicated by the numbers below the PHLPP panels. (C and D) The expression of USP46, a PHLPP-specific deubiquitinase, is decreased under hypoxic conditions. HCT116 and SW480 cells were exposed to normoxia (−) or 1% O2 (+) for 24 h (C); alternatively, SW480 and HCT116 cells were exposed to normoxia (−) or anoxia (+) for 24 h (D). Total protein levels of PHLPP1, PHLPP2, β-TrCP, USP46, HIF1α, HIF2α, and tubulin were detected using Western blotting. The relative expression of USP46 was quantified by normalizing to the level of tubulin and is indicated below the USP46 panel. (E) The mRNA expression of USP46 is inhibited by anoxia. Total RNAs were isolated from cells as treated as described for panel D. Real-time RT-PCR analysis was performed using probes specific for the human USP46 gene. Each experimental point was done in triplicates, and the graphs represent the means ± standard deviations (n = 3; *, P < 0.05, by a two-sample t test). (F) Overexpression of USP46 rescues PHLPP expression under hypoxia. HCT116 cells transfected with vector or Myc-USP46 were subjected to normoxia (−) or 1% O2 (+) for 24 h. Cell lysates were analyzed for the expression of PHLPP1, PHLPP2, HIF1α, USP46, and tubulin using Western blotting. Note that two bands were detected by the USP46 antibody, with a single asterisk indicating the endogenous USP46 and double asterisks indicating the Myc-USP46. (G) The ubiquitination (Ub) level of PHLPP is upregulated under anoxia. Stable SW480 cells expressing control vector, HA-PHLPP1, or HA-PHLPP2 were exposed to anoxia for 6 h. Cell lysates were immunoprecipitated (IP) using the anti-HA Affinity Matrix. The level of ubiquitination and the amount of PHLPP in the immunoprecipitates were detected using the ubiquitin and HA antibodies, respectively. The expression of HIF1α, HIF2α, and tubulin in cell lysates was analyzed using Western blotting. The relative ubiquitination levels detected on PHLPP1 and PHLPP2 were quantified by normalizing ECL signals of ubiquitin to those of HA and are indicated below the ubiquitin panel.
Fig 6
Fig 6
Loss of PHLPP expression contributes to hypoxia-induced drug resistance in HCT116 cells. (A and B) Hypoxia induces resistance to paclitaxel in colon cancer cells. HCT116 cells were treated with different concentrations of paclitaxel for 48 h under hypoxic (1% O2) (A) or anoxic (B) conditions. Cell viability was determined using MTS assays, and the percentage of survival was calculated by normalizing the results for drug-treated groups to those of untreated control groups. Each experimental point was done in quadruplicate, and the graph represents the average of two independent experiments. Two-sample t tests were performed to compare the results obtained in cells under hypoxia/anoxia to those of cells under normoxia (means ± standard deviations; #, P < 0.05; *, P < 0.005; **, P < 0.001). (C) Cell lysates isolated from control and PHLPP knockdown HCT116 cells were analyzed to determine the expression of PHLPP1 and PHLPP2 using Western blotting. (D) Knockdown of PHLPP expression rendered HCT116 cells resistant to paclitaxel. Cells infected with lentivirus encoding control shRNA (Sh-con) or shRNA for PHLPP1 (Sh-PHLPP1) or PHLPP2 (Sh-PHLPP2) were subjected to treatment with paclitaxel for 48 h. Cell viability was determined as described in panel A. Two-sample t tests were performed to compare the results obtained in PHLPP knockdown cells to results of control cells. Data represents means ± standard deviations (n = 4; #, P < 0.05; *, P < 0.005). (E and F) Control and PHLPP knockdown HCT116 cells as described in panel D were treated with paclitaxel (10 nM) for 48 h under hypoxic (E) or anoxic (F) conditions. The percent survival was calculated by normalizing results of drug-treated groups to those of untreated control groups. The results obtained in PHLPP knockdown cells were compared to those of control cells. Data represent means ± standard deviations (n = 4; #, P < 0.05; *, P < 0.005, as determined by two-sample t tests). No statistically significant differences were observed within PHLPP1 or PHLPP2 knockdown cell lines for comparisons between the normoxic and hypoxic conditions.
Fig 7
Fig 7
Loss of PHLPP expression contributes to hypoxia-induced drug resistance in SW480 cells. (A) SW480 cells were treated with different concentrations of oxaliplatin for 48 h under normoxia or hypoxia (1% O2). Cell viability was determined using MTS assays, and the percentage of survival was calculated by normalizing results of drug-treated groups to those of untreated control groups. Each experimental point was done in quadruplicate, and the graph represents averages of two independent experiments. Two-sample t tests were performed to compare the results obtained in cells under hypoxia to those of cells under normoxia (means ± standard deviations; #, P < 0.05; **, P < 0.001). (B) Cell lysates isolated from control and PHLPP knockdown SW480 cells were analyzed to determine the expression of PHLPP1 and PHLPP2 using Western blotting. (C) SW480 cells infected with lentivirus encoding control shRNA (Sh-con) or shRNA for PHLPP1 (Sh-PHLPP1) or PHLPP2 (Sh-PHLPP2) were treated with different concentrations of oxaliplatin for 48 h. Cell viability was determined as described in panel A. Two-sample t tests were performed to compare the results obtained in PHLPP knockdown cells to those of control cells. Data represent means ± standard deviations (n = 4; #, P < 0.05; **, P < 0.001). (D) Control and PHLPP knockdown cells as described in panel C were subjected to treatment with oxaliplatin (20 μM) for 48 h under normoxic or hypoxic (1% O2) conditions. The percentage of survival was calculated by normalizing values of drug-treated groups to those of untreated control groups. The results obtained in PHLPP knockdown cells were compared to those of control cells. Data represent means ± standard deviations (n = 4; *, P < 0.005, as determined by two-sample t tests). No statistically significant differences were observed within PHLPP1 or PHLPP2 knockdown cell lines in comparisons between the normoxic and hypoxic conditions. (E) SW480 cells overexpressing vector, HA-PHLPP1, or HA-PHLPP2 were subjected to treatment with oxaliplatin (20 μM) for 48 h under normoxic or hypoxic (1% O2) conditions. The percentage of survival was analyzed as described in panel D. The results obtained in PHLPP knockdown cells were compared to those of control cells. Data represent means ± standard deviations (n = 4; #, P < 0.05; *, P < 0.005 as determined by two-sample t tests). (F) Diagram showing the mechanism underlying hypoxia-mediated downregulation of PHLPP expression. Our study demonstrates that mTOR-dependent translation of PHLPP is inhibited under hypoxia and that this hypoxia-induced inhibition of mTOR, at least in part, is mediated via TSC2, an upstream regulator of mTOR. Knocking down TSC2 or 4E-BP1, a downstream effector of mTOR, partially rescues PHLPP expression under hypoxia. In addition, hypoxia negatively regulates the level of USP46 mRNA expression. As a consequence, the ubiquitination and proteasome-mediated degradation of PHLPP are increased. Functionally, downregulation of PHLPP contributes to hypoxia-induced chemoresistance in colon cancer cells.

Similar articles

Cited by

References

    1. Lu X, Kang Y. 2010. Hypoxia and hypoxia-inducible factors: master regulators of metastasis. Clin. Cancer Res. 16:5928–5935 - PMC - PubMed
    1. Rankin EB, Giaccia AJ. 2008. The role of hypoxia-inducible factors in tumorigenesis. Cell Death Differ. 15:678–685 - PMC - PubMed
    1. Majmundar AJ, Wong WJ, Simon MC. 2010. Hypoxia-inducible factors and the response to hypoxic stress. Mol. Cell 40:294–309 - PMC - PubMed
    1. Jaakkola P, Mole DR, Tian YM, Wilson MI, Gielbert J, Gaskell SJ, Kriegsheim A, Hebestreit HF, Mukherji M, Schofield CJ, Maxwell PH, Pugh CW, Ratcliffe PJ. 2001. Targeting of HIF-α to the von Hippel-Lindau ubiquitylation complex by O2-regulated prolyl hydroxylation. Science 292:468–472 - PubMed
    1. Maxwell PH, Wiesener MS, Chang GW, Clifford SC, Vaux EC, Cockman ME, Wykoff CC, Pugh CW, Maher ER, Ratcliffe PJ. 1999. The tumour suppressor protein VHL targets hypoxia-inducible factors for oxygen-dependent proteolysis. Nature 399:271–275 - PubMed

Publication types

MeSH terms

Substances