. 2013 Oct;141(3):341-52.
doi: 10.1007/s10549-013-2703-y. Epub 2013 Sep 24.

DHA is a more potent inhibitor of breast cancer metastasis to bone and related osteolysis than EPA

Affiliations

DHA is a more potent inhibitor of breast cancer metastasis to bone and related osteolysis than EPA

Md Mizanur Rahman et al. Breast Cancer Res Treat. 2013 Oct.

Abstract

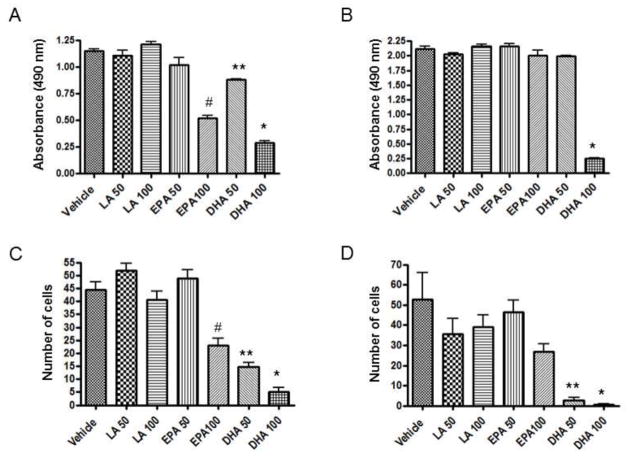
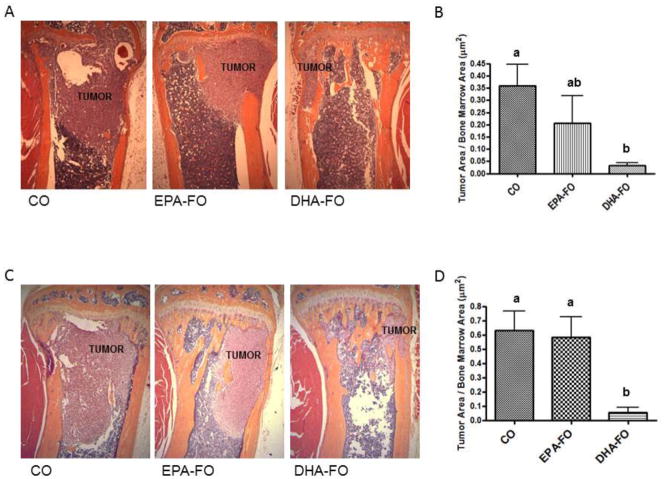
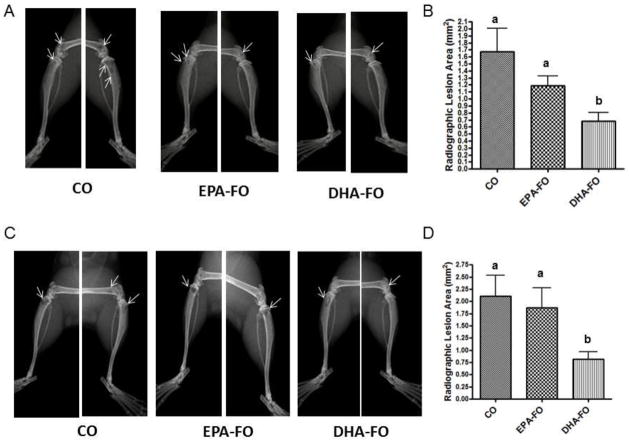
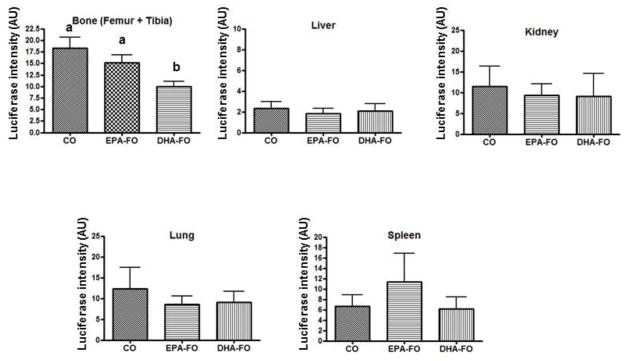
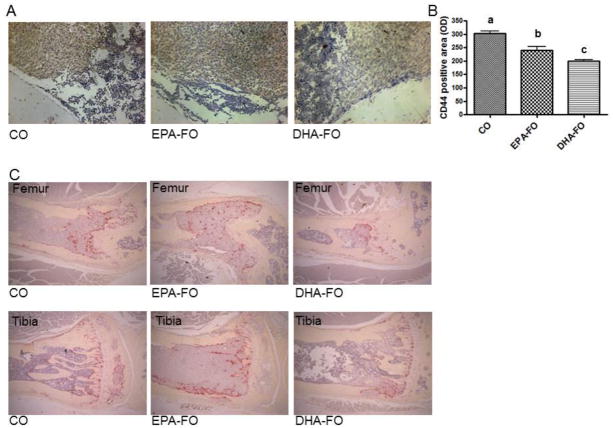
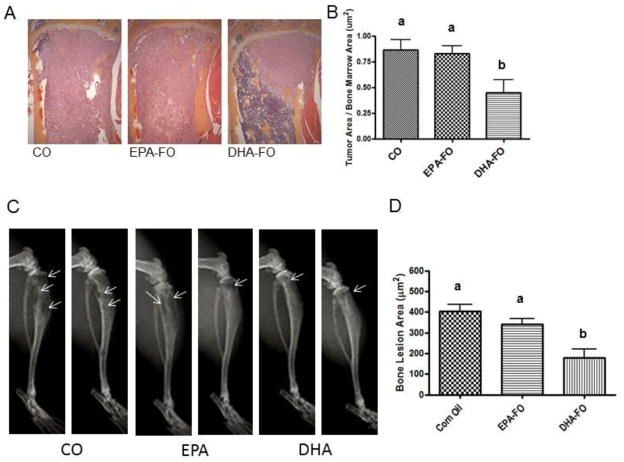
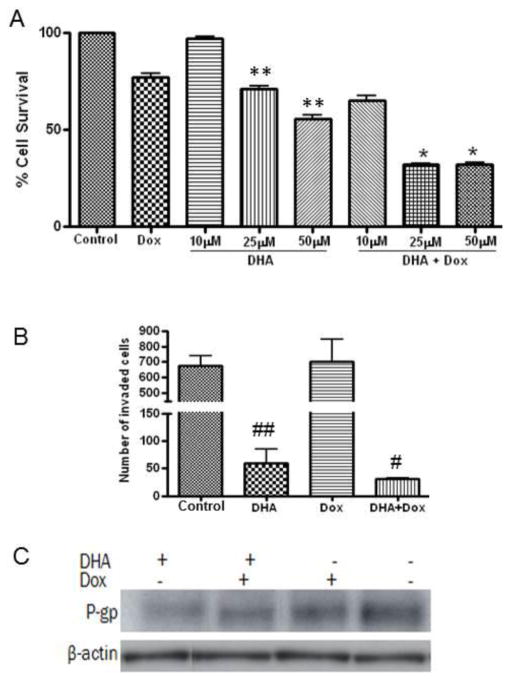
Breast cancer patients often develop bone metastasis evidenced by osteolytic lesions, leading to severe pain and bone fracture. Attenuation of breast cancer metastasis to bone and associated osteolysis by fish oil, rich in EPA and DHA, has been demonstrated previously. However, it was not known whether EPA and DHA differentially or similarly affect breast cancer bone metastasis and associated osteolysis. In vitro culture of parental and luciferase gene encoded MDA-MB-231 human breast cancer cell lines treated with EPA and DHA revealed that DHA inhibits proliferation and invasion of breast cancer cells more potently than EPA. Intra-cardiac injection of parental and luciferase gene encoded MDA-MB-231 cells to athymic NCr nu/nu mice demonstrated that DHA-treated mice had significantly less breast cancer cell burden in bone, and also significantly less osteolytic lesions than EPA-treated mice. In vivo cell migration assay as measured by luciferase intensity revealed that DHA attenuated cell migration specifically to the bone. Moreover, the DHA-treated group showed reduced levels of CD44 and TRAP positive area in bone compared to EPA-treated group. Breast cancer cell burden and osteolytic lesions were also examined in intra-tibially breast cancer cell injected mice and found less breast cancer cell growth and associated osteolysis in DHA-treated mice as compared to EPA-treated mice. Finally, doxorubicin-resistant MCF-7 (MCF-7dox) human breast cancer cell line was used to examine if DHA can improve sensitization of MCF-7dox cells to doxorubicin. DHA improved the inhibitory effect of doxorubicin on proliferation and invasion of MCF-7dox cells. Interestingly, drug resistance gene P-gp was also down-regulated in DHA plus doxorubicin-treated cells. In conclusion, DHA attenuates breast cancer bone metastasis and associated osteolysis more potently than EPA, possibly by inhibiting migration of breast cancer cell to the bone as well as by inhibiting osteoclastic bone resorption.


Conflict of interest statement

Conflict of Interest: The authors declare that they have no conflict of interest.

Figures

Fig. 1
Fig. 1. Effect of EPA and DHA on proliferation and invasion of breast cancer cell
For cell proliferation assay MDA-MB-231 (A) and MDA-231Luc (B) cells were plated at a density of 2 × 10⁴ cells/100 μl per well in a 96 well plate. After 24 hours of incubation, cells were replenished with fresh media with various concentrations of fatty acids. Cells were then incubated for an additional 48 hours. At the end of incubation, 20 μl MTS reagent was added to each well, and incubated for 4 hours at 37C. Absorbance was read at 490nm. For invasion assay, 2 × 10⁴ MDA-MB-231 (C) and MDA-231Luc (D) cells in 200 μl serum free DMEM was added to upper chamber and 700 μl of DMEM supplemented with 10% fetal calf serum (FCS) and FA were added to the lower chamber in a 24-well BioCoat Matrigel invasion coated chamber inserts with 8-μm pore size membranes. After 48 hours of incubation, the remaining upper chamber cells were removed and cells which had migrated through the pores to the lower side of the membrane were fixed with 10% formalin and stained with 0.1% crystal violet blue and counted manually. Each value represents the mean ± SEM of two independent triplicate cultures. Number denotes μM concentration of fatty acids. p value <0.05 was considered significant by student’s t test. * p<0.05 vs. EPA 100; # p<0.05 vs. LA 100; ** p<0.05 vs. EPA 50.
Fig. 2
Fig. 2. Effect of EPA and DHA on breast cancer metastasis to bone after intra-cardiac injection of breast cancer cells
The athymic NCr-nu/nu female mice were fed a diet containing CO or EPA-FO or DHA-FO for 4 weeks prior to the intra-cardiac injection of the MDA-MB-231 (A) or MDA-MB-231-Luc (C) cells. The mice were then injected with 1 × 10⁵ cells in 100 μl of PBS intra-cardially. The mice were maintained in their respective diets for 4 weeks post injection. After x-ray, mice were sacrificed and bones were collected and fixed in formalin. After decalcification, paraffin embedded bone sections were prepared and stained for H&E to determine the breast tumor burden in bones. Histomorphometry of tumor burden area was done for MDA-MB-231 (B) or MDA-MB-231-Luc (D). n=5 mice per group. Each value represents the mean ± SEM. Value with different superscripts are significantly different at P<0.05 by Newman Keuls one way ANOVA with multiple comparison test.
Fig. 3
Fig. 3. Effect of EPA and DHA on osteolysis due to breast cancer metastasis to bone after intra-cardiac injection of breast cancer cells
The athymic NCr-nu/nu female mice were fed a diet containing CO or EPA-FO or DHA-FO for 4 weeks prior to the intra-cardiac injection of the MDA-MB-231 (A) or MDA-MB-231-Luc (C) cells. The mice were then injected with 1 × 10⁵ cells in 100 μl of PBS intra-cardially. The mice were maintained in their respective diets for 4 weeks post injection. Deeply anesthetized animals were exposed to X-ray using a Faxitron radiographic inspection unit. Osteolytic lesions are shown in x-ray (A and C). The radiolucent osteolytic areas of bone metastasis were marked and quantified for MDA-MB-231 (B) or MDA-MB-231-Luc (D) injected mice using a computer-assisted MetaMorph analysis program. n=5 mice per group. Each value represents the mean ± SEM. Value with different superscripts are significantly different at P<0.05 by Newman Keuls one way ANOVA with multiple comparison test.
Fig. 4
Fig. 4. Effect of EPA and DHA on breast cancer cell load in different organs after intra-cardiac injection of breast cancer cells
The athymic NCr-nu/nu female mice were fed a diet containing CO or EPA-FO or DHA-FO for 4 weeks prior to the intra-cardiac injection of MDA-MB-231-Luc cells. The mice were then injected with 1 × 10⁵ cells in 100 μl of PBS intra-cardially. The mice were maintained in their respective diets for 4 weeks post injection. After x-ray, mice were sacrificed and whole fresh organs were dissected and immersed in 750 μl cold reporter lysis buffer. Tissues were homogenized on ice, and centrifuged for 15 minutes at 15,000 rpm at 4°C. Supernatant was collected and protein concentration was assessed. Supernatants were then analyzed for luciferase activity using a Turner Designs Luminometer TD-20/20. Results were expressed in luciferase activity/mg of organ protein. n=5 mice per group. Each value represents the mean ± SEM. Value with different superscripts are significantly different at P<0.05 by Newman Keuls one way ANOVA with multiple comparison test.
Fig. 5
Fig. 5. Effect of EPA and DHA on the expression of CD44 and TRAP in bone after intra-cardiac injection of breast cancer cells
The athymic NCr-nu/nu female mice were fed a diet containing CO or EPA-FO or DHA-FO for 4 weeks prior to the intra-cardiac injection of MDA-MB-231-Luc cells. The mice were then injected with 1 × 10⁵ cells in 100 μl of PBS intra-cardially. The mice were maintained in their respective diets for 4 weeks post injection. After x-ray, mice were sacrificed and bones were collected and fixed. After decalcification bone sections were stained for CD44 (A) and TRAP (C). Histomorphometry of CD44 positive area is shown in bar diagrams (B). n=5 mice per group. Each value represents the mean ± SEM. Value with different superscripts are significantly different at P<0.05 by Newman Keuls one way ANOVA with multiple comparison test.
Fig. 6
Fig. 6. Effect of EPA and DHA on breast cancer cell load and associated osteolysis after intra-tibial injection of breast cancer cell
The athymic NCr-nu/nu mice were fed a diet containing CO or EPA-FO or DHA-FO for 4 weeks prior to the intra-tibial injection of the MDA-MB-231 cells. 10 μl PBS containing 1 × 10⁶ cells was injected intra-tibially. The mice were maintained in their respective diets for 4 weeks post injection. After x-ray, mice were sacrificed and bones were collected and fixed in formalin. (B) Osteolytic lesions are shown in x-ray. After decalcification, the bone sections were stained for H&E to determine the tumor burden in bone. Histomorphometry of tumor burden (B) and osteolytic lesions area (D) is shown in bar diagrams. n=5 mice per group. Each value represents the mean ± SEM. Value with different superscripts are significantly different at P<0.05 by Newman Keuls one way ANOVA with multiple comparison test.
Fig. 7
Fig. 7. Effect of DHA on proliferation, invasion and P-gp expression on doxorubicin resistant MCF-7 breast cancer cell
For cell proliferation assay MCF-7dox cells were plated in a 96 well plate. After 24 hours of incubation, cells were replenished with fresh media with different concentrations of DHA and doxorubicin (2μM) alone or in combination. Cells were then incubated for an additional 48 hours. At the end of incubation, 20 μl MTS reagent was added to each well, and incubated for 4 hours at 37C. Absorbance was read at 490nm. For invasion assay, MCF-7dox cells in 200 μl serum free DMEM was added to upper chamber and 700 μl of DMEM supplemented with 10% fetal calf serum (FCS) and DHA (50 μM) and doxorubicin (2 μM) alone or in combination added to the lower chamber in a 24-well BioCoat Matrigel invasion coated chamber inserts with 8-μm pore size membranes. After 48 hours of incubation, the remaining upper chamber cells were removed and cells which had migrated through the pores to the lower side of the membrane were fixed with 10% formalin and stained with 0.1% crystal violet blue and counted manually. P-gp protein levels were analyzed in MCF-7dox cells treated with 50 μM of DHA and 2 μM of doxorubicin alone or in combination for 48 hours by western blot. Each value represents the mean ± SEM of two independent triplicate cultures. * p<0.05 vs. DHA or doxorubicin alone; ** p<0.05 vs. control or Doxorubicin alone; # p<0.05 vs. doxorubicin alone; ## p<0.05 vs. control or Doxorubicin alone.

Similar articles

Cited by

References

    1. Donaldson MS. Nutrition and cancer: a review of the evidence for an anti-cancer diet. Nutr J. 2004;3:19. - PMC - PubMed
    1. Berquin IM, Edwards IJ, Chen YQ. Multi-targeted therapy of cancer by omega-3 fatty acids. Cancer Lett. 2008;269:363–77. - PMC - PubMed
    1. Fetterman JW, Jr, Zdanowicz MM. Therapeutic potential of n-3 polyunsaturated fatty acids in disease. Am J Health Syst Pharm. 2009;66:1169–79. - PubMed
    1. Bagga D, Anders KH, Wang HJ, Glaspy JA. Long-chain n-3-to-n-6 polyunsaturated fatty acid ratios in breast adipose tissue from women with and without breast cancer. Nutr Cancer. 2002;42:180–5. - PubMed
    1. Lands WE, Hamazaki T, Yamazaki K, Okuyama H, Sakai K, Goto Y, Hubbard VS. Changing dietary patterns. Am J Clin Nutr. 1990;51:991–3. - PubMed

Publication types

MeSH terms

Substances