. 2013 Sep 30;202(7):1075-90.
doi: 10.1083/jcb.201303055. Epub 2013 Sep 23.

The formin FHOD1 and the small GTPase Rac1 promote vaccinia virus actin-based motility

Affiliations

The formin FHOD1 and the small GTPase Rac1 promote vaccinia virus actin-based motility

Diego E Alvarez et al. J Cell Biol. .

Abstract

Vaccinia virus dissemination relies on the N-WASP-ARP2/3 pathway, which mediates actin tail formation underneath cell-associated extracellular viruses (CEVs). Here, we uncover a previously unappreciated role for the formin FHOD1 and the small GTPase Rac1 in vaccinia actin tail formation. FHOD1 depletion decreased the number of CEVs forming actin tails and impaired the elongation rate of the formed actin tails. Recruitment of FHOD1 to actin tails relied on its GTPase binding domain in addition to its FH2 domain. In agreement with previous studies showing that FHOD1 is activated by the small GTPase Rac1, Rac1 was enriched and activated at the membrane surrounding actin tails. Rac1 depletion or expression of dominant-negative Rac1 phenocopied the effects of FHOD1 depletion and impaired the recruitment of FHOD1 to actin tails. FHOD1 overexpression rescued the actin tail formation defects observed in cells overexpressing dominant-negative Rac1. Altogether, our results indicate that, to display robust actin-based motility, vaccinia virus integrates the activity of the N-WASP-ARP2/3 and Rac1-FHOD1 pathways.


Figures

Figure 1.
Figure 1.
Quantification of vaccinia virus spread from cell to cell. (A) Spreading of vaccinia virus expressing a B5R-GFP chimera (vB5R-GFP) in HeLa cells at 16 h after infection. (control) Cells infected with wild-type virus. (ΔA36R) Cells infected with a vaccinia virus variant lacking A36R. (N-WASPsi) N-WASP–depleted cells infected with wild-type virus. (ARPC4si) ARPC4-depleted cells infected with wild-type virus. In N-WASP– and ARPC4-depleted cells, mRNA levels were consistently <20% of the levels observed in mock-treated cells. Top panels show representative images of HeLa cells (nuclei, red channel) infected with vaccinia virus (vB5R-GFP, green channel). Bars, 100 µm. Bottom panels display the corresponding image analysis showing large foci (white) and small foci (green). (B) Merged channels for the boxed areas in A showing representative foci of infection for cells infected with vB5R-GFP–expressing virus (control) or the variant lacking A36R (ΔA36R). Bars, 20 µm. (C) Graph showing quantitative analysis of cell-to-cell spread. The spreading index represents the ratio between the number of large foci and the total number of foci. Data are presented as the mean ± SD. *, P < 0.05; **, P < 0.01; P = 0.0015 for ΔA36; P = 0.0064 for NWASPsi; and P = 0.0120 for ARPC4si, compared with the control.
Figure 2.
Figure 2.
The formin FHOD1 is required for vaccinia virus dissemination. (A) Representative images of HeLa cells (nuclei, bottom) mock treated or depleted of FHOD1 using four independent siRNA duplexes targeting FHOD1 expression (FHOD1siA–D) and infected with wild-type vaccinia virus expressing GFP (vB5R-GFP, top). Bars, 100 µm. (B) The spreading index was determined as described in Fig. 1. Data are presented as the mean ± SD of three independent experiments. *, P < 0.05; **, P < 0.01; P = 0.0091 for FHOD1siA; P = 0.0150 for FHOD1siB; and P = 0.0039 for FHOD1siD, compared with the mock. (C and D) Silencing efficiency. Cells were transfected with individual FHOD1 siRNA duplexes (siA, siB, siC, and siD) and the levels of transcripts (C) and protein (D) were compared with the levels detected in mock-treated cells (mock). Data for the levels of transcripts are presented as the mean ± SD of three independent experiments. ***, P = 0.0002 for siA and siB; ****, P < 0.0001 for siC and siD, compared with the mock.
Figure 3.
Figure 3.
FHOD1 stimulates actin tail initiation and elongation. (A) Representative images of HeLa cells infected with vA5L-mCherry/3xF-B5R recombinant vaccinia virus. FLAG staining without permeabilization (green channel) was followed by permeabilization and staining of actin tails with phalloidin (blue channel). Individual CEVs were identified by colocalization of A5-mCherry signal (red channel) and FLAG staining (green channel). Bars, 10 µm. (B) Split channel images of the boxed area of the mock-treated cell images. Closed arrowheads indicate CEVs that display actin tails. Open arrowheads indicate CEVs that do not display actin tails. Bar, 3 µm. (C) Quantification of CEVs displaying actin tails in mock-treated (mock) or FHOD1-depleted (FHOD1si) HeLa cells. (D) Quantification of vaccinia virus velocity in mock-treated (mock) or FHOD1-depleted (FHOD1si) HeLa cells. Data are presented as the mean ± SEM. ***, P < 0.0001.
Figure 4.
Figure 4.
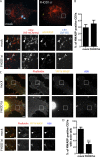
FHOD1 is not required for N-WASP recruitment. (A) Representative images of HeLa cells infected with vA5L-mCherry/3xF-B5R recombinant vaccinia virus (top). Bars, 10 µm. FLAG staining without permeabilization (blue channel) was followed by permeabilization and staining of N-WASP (yellow channel). Individual CEVs were identified by colocalization of A5L-mCherry signal (red channel) and FLAG staining. Bottom panels correspond to split channel images of the boxed area of the mock-treated or FHOD1-depleted cell images (top). Closed arrowheads indicate CEVs that are positive for N-WASP localization. Open arrowheads indicate CEVs that are negative for N-WASP. Bars, 1 µm. (B) Quantification of N-WASP recruitment to CEV. Data are presented as the mean ± SEM. (C) Representative images of HeLa cells expressing YFP–N-WASP (yellow channel) infected with WR strain of vaccinia virus. Bars, 5 µm. Vaccinia virus was stained with an anti-A36 antibody (blue channel) and actin tails with phalloidin (red channel). Bottom panels correspond to split channel images of the boxed area of the mock-treated or FHOD1-depleted cell images (top). Co-localization of A36 and N-WASP was used to identify CEVs. Viruses colocalizing with N-WASP in mock-treated or FHOD1-depleted cells were scored as positive (closed arrowheads) or negative (open arrowheads) for actin tail formation. Bars, 1 µm. (D) Quantification of N-WASP–positive CEVs displaying actin tails in mock-treated or FHOD1-depleted cells. Data are presented as the mean ± SEM. ***, P < 0.0001.
Figure 5.
Figure 5.
FHOD1 domains required for efficient actin tail formation. (A) Representative images of FHOD1-depleted cells expressing different silencing-resistant FHOD1 cDNA variants and infected with the WR strain of vaccinia virus. Actin tails were stained with phalloidin (green channel) and the FHOD1 cDNA variants were fused to dsRed (red channel). Bars, 10 µm. Insets show representative actin tails for FHOD1-depleted cells transfected with siRNA-resistant wild-type, ΔGBD, ΔFH1, ΔFH2, or I705A variants of FHOD1. Bars, 1 µm. Arrowheads in the panels corresponding to transfection of the full-length variant of FHOD1 (wt) indicate localization of FHOD1 to actin tails. (B) Quantitative analysis of the number of actin tails per cell in mock-treated cells (mock, –), FHOD1-depleted cells (FHOD1si, –), or FHOD1-depleted cells expressing the different FHOD1 cDNA variants (FHOD1si, resistant FHOD1 wt, ΔGBD, ΔFH1, ΔFH2, or I705A). Data are presented as the mean ± SEM. ***, P < 0.0001, compared with control (mock, –); **, P = 0.0043, for cells expressing the ΔFH1 variant (FHOD1si, ΔFH1).
Figure 6.
Figure 6.
Profilin 1 stimulates actin tail initiation and elongation. (A) Representative images of HeLa cells (nuclei, bottom) mock treated or depleted of Profilin 1 (PFN1) using four independent siRNA duplexes targeting PFN1 expression (PFN1siA–D) and infected with wild-type vaccinia virus expressing GFP (vB5R-GFP, top). Bars, 100 µm. (B) The spreading index was determined as described in Fig. 1. Data are presented as the mean ± SD of three independent experiments. *, P < 0.05; **, P < 0.01; P = 0.0194 for PFN1siA; P = 0.0417 for PFN1siB; P = 0.0040 for PFN1siC; and P = 0.0093 for PFN1siD, compared with the mock. (C) Silencing efficiency. Cells were transfected with individual PFN1 siRNA duplexes (siA, siB, siC, and siD) and were compared with mock-treated cells (mock) for silencing efficiency at the transcript level. (D) Quantification of CEVs displaying actin tails in mock-treated (mock) or PFN1-depleted (PFN1si) HeLa cells. Data are presented as the mean ± SEM. (E) Quantification of CEV actin-based motility. Data are presented as the mean ± SEM. ***, P < 0.0001.
Figure 7.
Figure 7.
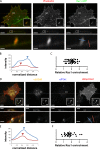
Rac1 is enriched in the membrane surrounding actin tails. (A) Representative confocal image of a cell expressing Rac1-GFP (green channel) infected with the WR strain of vaccinia virus. Actin tails were stained with phalloidin (red channel). Bars, 10 µm. (top) The insets show Rac1 localization at the plasma membrane surrounding actin tails. Bars, 1 µm. Asterisks indicate examples of Rac1-positive actin tails. Dashed lines indicate the Y coordinates corresponding to the XZ reconstructions shown in the middle panels. Bars, 10 µm. Bottom panels correspond to images of the boxed area showing that Rac1 is enriched around vaccinia actin tails. Bars, 1 µm. (B) Green channel intensities measured along a line crossing vaccinia actin tails (A and B, blue line) or crossing the plasma membrane adjacent to the actin tails (A and B, red line). (C) Quantification of Rac1 enrichment in the membrane surrounding actin tails. Rac1 enrichment represents the ratio between the maximum intensities for the line crossing the actin tail (B, blue arrowhead) and the line crossing the plasma membrane (B, red arrowhead). (D) Representative confocal image of a cell expressing Rac1-dsRed (dsRed Rac1, red channel) infected with the vGFP-ΔA36R variant of vaccinia virus (vΔA36R, yellow channel) and stained with a P-Src–specific antibody (P-Src, blue channel). Bars, 10 µm. (top, inset) A36R-deficient viruses positive for P-Src staining are indicated with closed arrowheads and viruses negative for P-Src staining are indicated with open arrowheads. P-Src–positive viruses showed Rac1 recruitment. Bars, 1 µm. Dashed lines indicate the Y coordinates corresponding to the XZ reconstructions shown in the middle panels. Bars, 10 µm. Bottom panels correspond to images of the boxed area showing that Rac1 is enriched beneath P-Src–positive viruses. Bars, 1 µm. (E) Red channel intensities measured along a line crossing P-Src–positive viruses (D and E, blue line) or crossing the plasma membrane adjacent to the virus (D and E, red line). (F) Quantification of Rac1 enrichment beneath P-Src–positive viruses. Rac1 enrichment represents the ratio between the maximum intensities for the line crossing a P-Src–positive virus (B, blue arrowhead) and the line crossing the plasma membrane (B, red arrowhead).
Figure 8.
Figure 8.
Rac1 stimulates actin tail initiation and elongation. (A) Representative images of HeLa cells (nuclei, bottom) mock treated or depleted of RAC1 using four redundant siRNAs targeting Rac1 expression (Rac1siA–D) and infected with wild-type vaccinia virus expressing GFP (vB5R-GFP, top). Bars, 100 µm. (B) The spreading index was determined as described in Fig. 1. Data are presented as the mean ± SD of three independent experiments. *, P < 0.05; **, P < 0.01; P = 0.0073 for Rac1siA; P = 0.0382 for Rac1siB; P = 0.0140 for Rac1siC; and P = 0.0199 for Rac1siD, compared with the mock. (C) Silencing efficiency. Cells were transfected with individual Rac1 siRNA duplexes (siA, siB, siC, and siD) and were compared with mock-treated cells (mock) for silencing efficiency at the transcript level. Data are presented as the mean ± SD. ****, P < 0.0001; ***, P < 0.001; **, P < 0.01. P < 0.0001 for siA; P = 0.0005 for siB; P = 0.0047 for siC; and P = 0.0011 for siD, compared with the mock. (D) Quantification of CEVs displaying actin tails in mock-treated (mock) or Rac1-depleted (Rac1si) HeLa cells. Data are presented as the mean ± SEM. **, P = 0.0019. (E) Quantification of CEV actin-based motility. Data are presented as the mean ± SEM. ***, P < 0.0001.
Figure 9.
Figure 9.
Rac1 stimulates FHOD1 recruitment to actin tails. (A) Representative images of HeLa cells transfected with dsRed-FHOD1 and infected with WR strain of vaccinia. Bars, 10 µm. Localization of FHOD1 (red channel) to actin tails (green channel) was assessed in mock-treated (mock) or Rac1-depleted (Rac1si) cells. The inset in the top panels (mock) shows a representative actin tail decorated with FHOD1. Bars, 1 µm. Closed arrowheads indicate examples of FHOD1-positive actin tails. The inset in the bottom panels (Rac1si) shows a representative FHOD1-negative actin tail. (B) Quantitative analysis of FHOD1 localization to actin tails in mock-treated and Rac1-depleted cells. Data are presented as the mean ± SEM. ***, P < 0.0001. (C) Representative images of HeLa cells infected with the WR strain of vaccinia virus. Control cells were stained with phalloidin (red channel) to visualize actin tails. Dominant-negative Rac1 (DN Rac1) cells were transfected with GFP-Rac1 N17 (green channel) the day before infection and stained with phalloidin (red channel) to visualize actin tails. DN-Rac1 + FHOD1 cells were cotransfected with GFP-Rac1 N17 (blue channel) and dsRed-FHOD1-ΔDAD (red channel) the day before infection and stained with phalloidin (yellow channel) to visualize actin tails. Bars, 10 µm. (D) Quantitative analysis of the number of actin tails per cell in control cells (control), cells expressing dominant-negative versions of the small GTPases Rho N19 (DN-Rho), Cdc42 N17 (DN-Cdc42), and Rac1 N17 (DN-Rac1), or cells coexpressing DN-Rac1 + NWASP, DN-Rac1 + FHOD1wt, DN-Rac1 + FHOD1-ΔDAD, or DN-Rac1 + FHOD1-ΔFH2. ***, P < 0.0001, compared with control; **, P = 0.0022, for cells expressing DN-Cdc42.
Figure 10.
Figure 10.
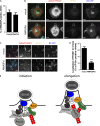
N-WASPdependent recruitment of FHOD1 and model of vaccinia actin tail initiation and elongation. (A) Quantification of N-WASP recruitment to CEV in mock-treated and Rac1-depleted cells. Data are presented as the mean ± SEM. (B) Representative images of HeLa cells expressing dsRed-FHOD1 (red channel) infected with the vB5R-CFP variant of vaccinia virus (B5-CFP, blue channel) and stained with a P-Src–specific antibody (P-Src, yellow channel). Bars, 10 µm. (C) Split channel images of the boxed area of the mock-treated (mock) or N-WASP–depleted cells (NWASPsi) from A. Localization of FHOD1 to P-Src–positive viruses was assessed in mock-treated (mock) or N-WASP–depleted (NWASPsi) cells. Closed arrowheads indicate examples of FHOD1-positive viruses. Open arrowheads show FHOD1-negative viruses. Bars, 1 µm. (D) Quantitative analysis of FHOD1 localization to P-Src–positive viruses in mock-treated and N-WASP–depleted cells. Data are presented as the mean ± SEM. ***, P < 0.0001. (E) Model of vaccinia actin-based motility. The cytoplasmic domain of A36 is phosphorylated underneath CEVs (white and gray oval) by tyrosine kinases of the Src family leading to the recruitment of adaptor proteins (gray circles) that in turn recruit N-WASP and the ARP2/3 complex. N-WASP is required for the recruitment of FHOD1 through an unknown mechanism (left, question mark). Activation of Rac1 also contributes to the recruitment and activation of FHOD1, which may prime the formation of actin tails by nucleating the assembly of actin filaments (left). The actin filaments primed by FHOD1 are used as mother filaments by the ARP2/3 complex, which nucleates the assembly of daughter filaments (right). FHOD1 binds to the barbed ends of daughter filaments (right), as well as mother filaments (left), and increases their rate of elongation in a PFN1-dependent manner (not depicted).

Comment in

References

    1. Alberts A.S. 2001. Identification of a carboxyl-terminal diaphanous-related formin homology protein autoregulatory domain. J. Biol. Chem. 276:2824–2830 10.1074/jbc.M006205200 - DOI - PubMed
    1. Alvarez D.E., Agaisse H. 2012. Casein kinase 2 regulates vaccinia virus actin tail formation. Virology. 423:143–151 10.1016/j.virol.2011.12.003 - DOI - PubMed
    1. Arakawa Y., Cordeiro J.V., Way M. 2007. F11L-mediated inhibition of RhoA-mDia signaling stimulates microtubule dynamics during vaccinia virus infection. Cell Host Microbe. 1:213–226 10.1016/j.chom.2007.04.007 - DOI - PubMed
    1. Bagrodia S., Dérijard B., Davis R.J., Cerione R.A. 1995. Cdc42 and PAK-mediated signaling leads to Jun kinase and p38 mitogen-activated protein kinase activation. J. Biol. Chem. 270:27995–27998 10.1074/jbc.270.47.27995 - DOI - PubMed
    1. Bernardini M.L., Mounier J., d’Hauteville H., Coquis-Rondon M., Sansonetti P.J. 1989. Identification of icsA, a plasmid locus of Shigella flexneri that governs bacterial intra- and intercellular spread through interaction with F-actin. Proc. Natl. Acad. Sci. USA. 86:3867–3871 10.1073/pnas.86.10.3867 - DOI - PMC - PubMed

Publication types

MeSH terms