

Robust increases in severe thunderstorm environments in response to greenhouse forcing
- PMID: 24062439
- PMCID: PMC3799355
- DOI: 10.1073/pnas.1307758110
Robust increases in severe thunderstorm environments in response to greenhouse forcing
Abstract
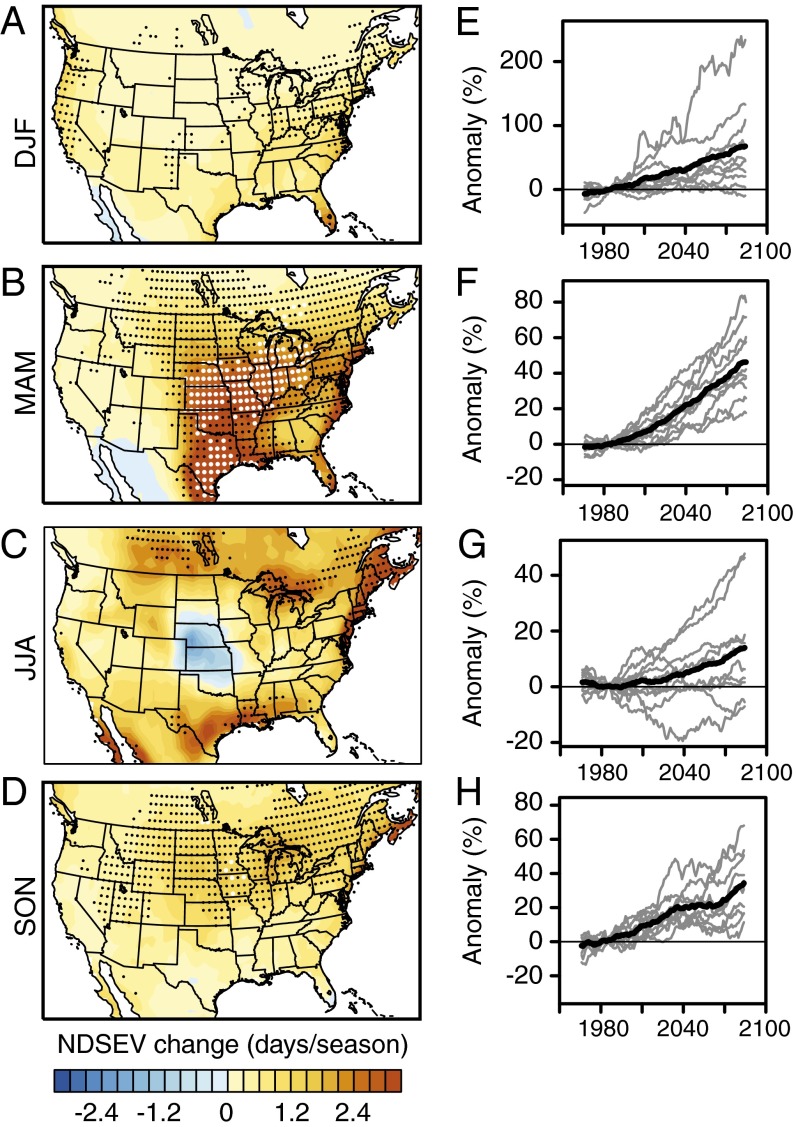
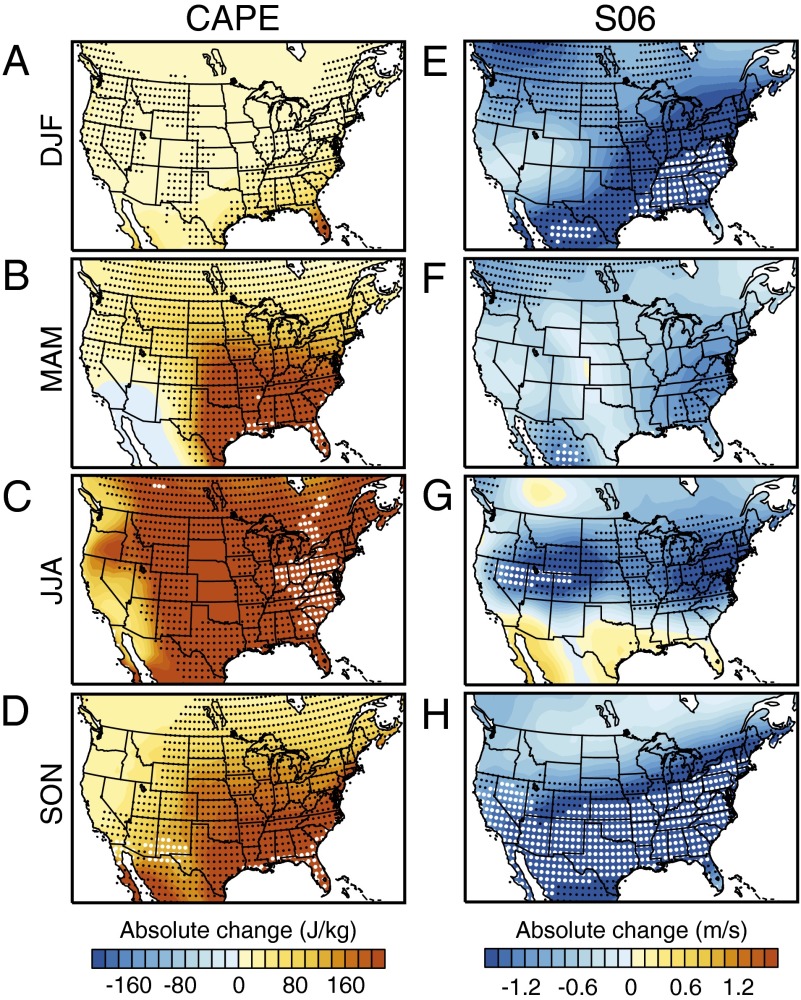
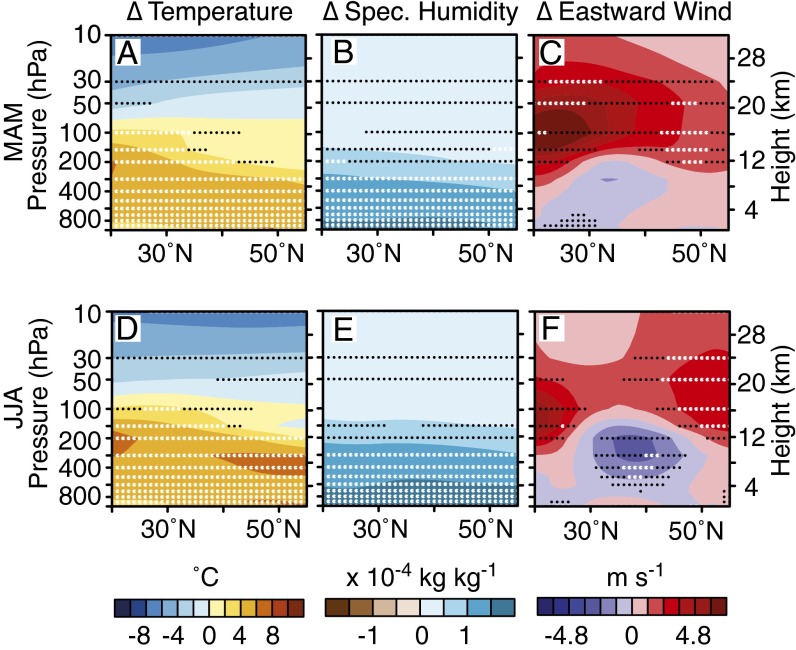
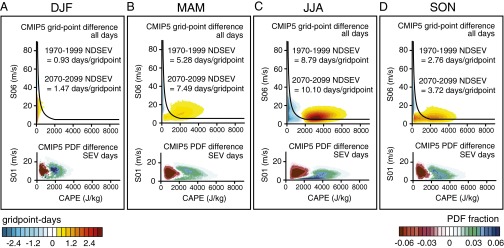
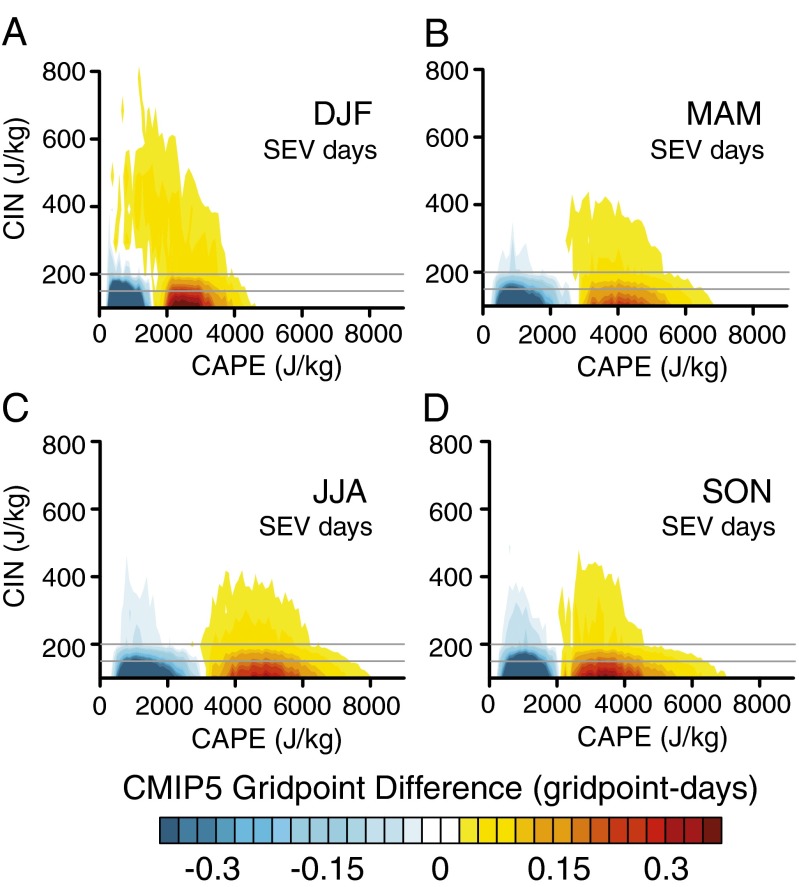
Although severe thunderstorms are one of the primary causes of catastrophic loss in the United States, their response to elevated greenhouse forcing has remained a prominent source of uncertainty for climate change impacts assessment. We find that the Coupled Model Intercomparison Project, Phase 5, global climate model ensemble indicates robust increases in the occurrence of severe thunderstorm environments over the eastern United States in response to further global warming. For spring and autumn, these robust increases emerge before mean global warming of 2 °C above the preindustrial baseline. We also find that days with high convective available potential energy (CAPE) and strong low-level wind shear increase in occurrence, suggesting an increasing likelihood of atmospheric conditions that contribute to the most severe events, including tornadoes. In contrast, whereas expected decreases in mean wind shear have been used to argue for a negative influence of global warming on severe thunderstorms, we find that decreases in shear are in fact concentrated in days with low CAPE and therefore do not decrease the total occurrence of severe environments. Further, we find that the shift toward high CAPE is most concentrated in days with low convective inhibition, increasing the occurrence of high-CAPE/low-convective inhibition days. The fact that the projected increases in severe environments are robust across a suite of climate models, emerge in response to relatively moderate global warming, and result from robust physical changes suggests that continued increases in greenhouse forcing are likely to increase severe thunderstorm occurrence, thereby increasing the risk of thunderstorm-related damage.
Keywords: CMIP5; GCM; hazards; severe weather.
Conflict of interest statement
The authors declare no conflict of interest.
Figures
Similar articles
-
Increasing potential for intense tropical and subtropical thunderstorms under global warming.Proc Natl Acad Sci U S A. 2017 Oct 31;114(44):11657-11662. doi: 10.1073/pnas.1707603114. Epub 2017 Oct 16. Proc Natl Acad Sci U S A. 2017. PMID: 29078312 Free PMC article.
-
Projected changes in African easterly wave intensity and track in response to greenhouse forcing.Proc Natl Acad Sci U S A. 2014 May 13;111(19):6882-7. doi: 10.1073/pnas.1319597111. Epub 2014 Apr 28. Proc Natl Acad Sci U S A. 2014. PMID: 24778244 Free PMC article.
-
Global warming without global mean precipitation increase?Sci Adv. 2016 Jun 24;2(6):e1501572. doi: 10.1126/sciadv.1501572. eCollection 2016 Jun. Sci Adv. 2016. PMID: 27386558 Free PMC article.
-
Prospects for future climate change and the reasons for early action.J Air Waste Manag Assoc. 2008 Jun;58(6):735-86. doi: 10.3155/1047-3289.58.6.735. J Air Waste Manag Assoc. 2008. PMID: 18581807 Review.
-
Advances in understanding large-scale responses of the water cycle to climate change.Ann N Y Acad Sci. 2020 Jul;1472(1):49-75. doi: 10.1111/nyas.14337. Epub 2020 Apr 4. Ann N Y Acad Sci. 2020. PMID: 32246848 Review.
Cited by
-
Kinetic Energy of Tornadoes in the United States.PLoS One. 2015 Jul 1;10(7):e0131090. doi: 10.1371/journal.pone.0131090. eCollection 2015. PLoS One. 2015. PMID: 26132830 Free PMC article.
-
New York State Climate Impacts Assessment Chapter 02: New York State's Changing Climate.Ann N Y Acad Sci. 2024 Dec;1542(1):91-145. doi: 10.1111/nyas.15240. Epub 2024 Dec 9. Ann N Y Acad Sci. 2024. PMID: 39652367 Free PMC article.
-
Mental Health Impacts of Tornadoes: A Systematic Review.Int J Environ Res Public Health. 2022 Oct 22;19(21):13747. doi: 10.3390/ijerph192113747. Int J Environ Res Public Health. 2022. PMID: 36360627 Free PMC article.
-
Upstream surface roughness and terrain are strong drivers of contrast in tornado potential between North and South America.Proc Natl Acad Sci U S A. 2024 Jun 25;121(26):e2315425121. doi: 10.1073/pnas.2315425121. Epub 2024 Jun 18. Proc Natl Acad Sci U S A. 2024. PMID: 38889148 Free PMC article.
-
Trends in surface equivalent potential temperature: A more comprehensive metric for global warming and weather extremes.Proc Natl Acad Sci U S A. 2022 Feb 8;119(6):e2117832119. doi: 10.1073/pnas.2117832119. Proc Natl Acad Sci U S A. 2022. PMID: 35101987 Free PMC article.
References
-
- Intergovernmental Panel on Climate Change (2012) Managing the risks of extreme events and disasters to advance climate change adaptation. A Special Report of Working Groups I and II of the Intergovernmental Panel on Climate Change, eds Field CB, et al. (Cambridge Univ Press, Cambridge, UK), p 592.
-
- Diffenbaugh NS, Trapp RJ, Brooks HE. Does global warming influence tornado activity? Eos. 2008;89(53):553–554.
-
- Doswell CA, III, Carbin GW, Brooks HE. The tornadoes of spring 2011 in the USA: An historical perspective. Weather. 2012;67(4):88–94.
-
- Brooks HE. Severe thunderstorms and climate change. Atmos Res. 2013;123:129–138.
-
- Kunkel KE, et al. Monitoring and understanding trends in extreme storms: State of knowledge. Bull Am Meteorol Soc. 2013;94:499–514.
Publication types
MeSH terms
Grants and funding
LinkOut - more resources
Full Text Sources
Other Literature Sources
Medical
