Review
. 2013 Oct;269(1):8-15.
doi: 10.1148/radiol.13122697.

Quantitative imaging in cancer evolution and ecology

Affiliations
Review

Quantitative imaging in cancer evolution and ecology

Robert A Gatenby et al. Radiology. 2013 Oct.

Abstract

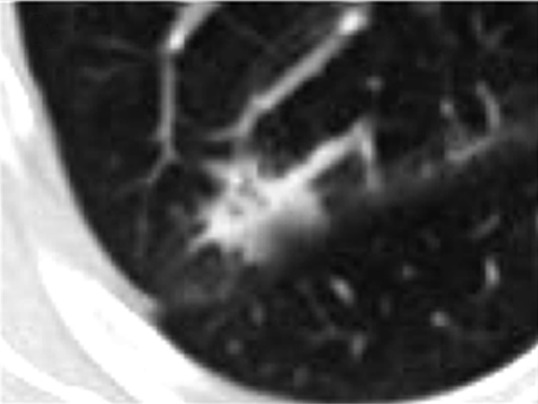
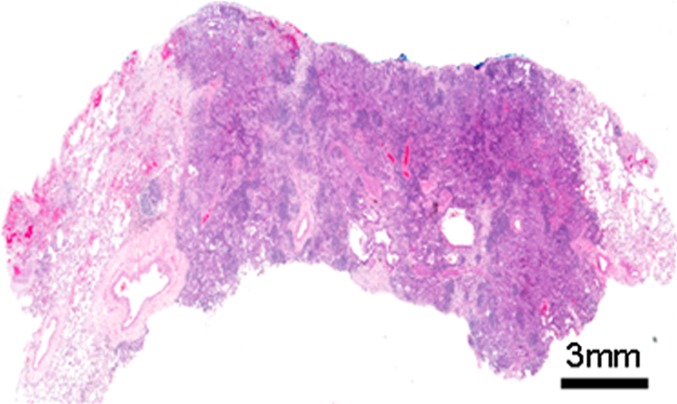
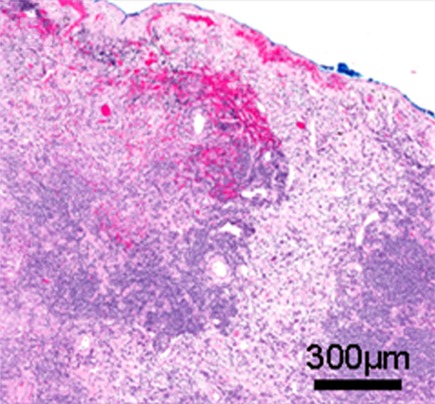
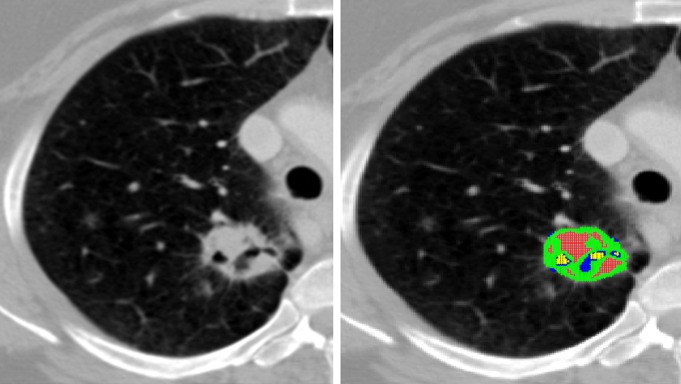
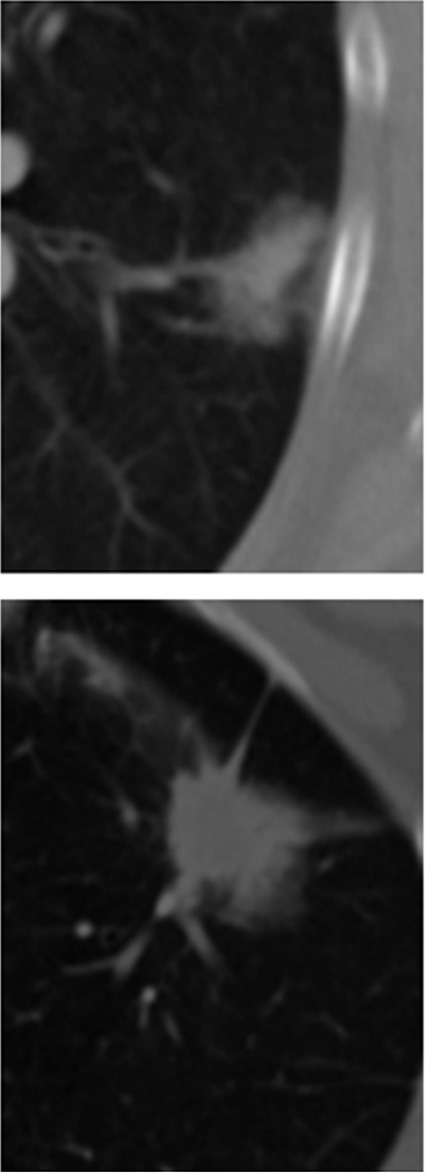
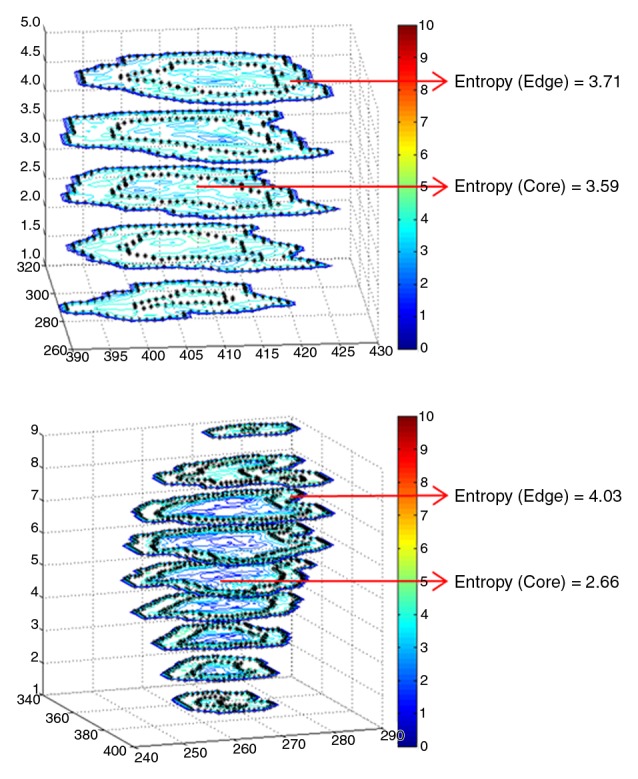
Cancer therapy, even when highly targeted, typically fails because of the remarkable capacity of malignant cells to evolve effective adaptations. These evolutionary dynamics are both a cause and a consequence of cancer system heterogeneity at many scales, ranging from genetic properties of individual cells to large-scale imaging features. Tumors of the same organ and cell type can have remarkably diverse appearances in different patients. Furthermore, even within a single tumor, marked variations in imaging features, such as necrosis or contrast enhancement, are common. Similar spatial variations recently have been reported in genetic profiles. Radiologic heterogeneity within tumors is usually governed by variations in blood flow, whereas genetic heterogeneity is typically ascribed to random mutations. However, evolution within tumors, as in all living systems, is subject to Darwinian principles; thus, it is governed by predictable and reproducible interactions between environmental selection forces and cell phenotype (not genotype). This link between regional variations in environmental properties and cellular adaptive strategies may permit clinical imaging to be used to assess and monitor intratumoral evolution in individual patients. This approach is enabled by new methods that extract, report, and analyze quantitative, reproducible, and mineable clinical imaging data. However, most current quantitative metrics lack spatialness, expressing quantitative radiologic features as a single value for a region of interest encompassing the whole tumor. In contrast, spatially explicit image analysis recognizes that tumors are heterogeneous but not well mixed and defines regionally distinct habitats, some of which appear to harbor tumor populations that are more aggressive and less treatable than others. By identifying regional variations in key environmental selection forces and evidence of cellular adaptation, clinical imaging can enable us to define intratumoral Darwinian dynamics before and during therapy. Advances in image analysis will place clinical imaging in an increasingly central role in the development of evolution-based patient-specific cancer therapy.


Figures

Figure 1a:
Figure 1a:
(a) Computed tomographic (CT) scan of right upper lobe lung cancer in a 50-year-old woman. (b) Isoattenuation map shows regional heterogeneity at the tissue scale (measured in centimeters). (c, d) Whole-slide digital images (original magnification, ×3) of a histologic slice of the same tumor at the mesoscopic scale (measured in millimeters) (c) coupled with a masked image of regional morphologic differences showing spatial heterogeneity (d). (e) Subsegment of the whole slide image shows the microscopic scale (measured in micrometers) (original magnification, ×50). (f) Pattern recognition masked image shows regional heterogeneity. In a, the CT image of non–small cell lung cancer can be analyzed to display gradients of attenuation, which reveals heterogeneous and spatially distinct environments (b). Histologic images in the same patient (c, e) reveal heterogeneities in tissue structure and density on the same scale as seen in the CT images. These images can be analyzed at much higher definition to identify differences in morphologies of individual cells (3), and these analyses reveal clusters of cells with similar morphologic features (d, f). An important goal of radiomics is to bridge radiologic data with cellular and molecular characteristics observed microscopically.
Figure 1b:
Figure 1b:
(a) Computed tomographic (CT) scan of right upper lobe lung cancer in a 50-year-old woman. (b) Isoattenuation map shows regional heterogeneity at the tissue scale (measured in centimeters). (c, d) Whole-slide digital images (original magnification, ×3) of a histologic slice of the same tumor at the mesoscopic scale (measured in millimeters) (c) coupled with a masked image of regional morphologic differences showing spatial heterogeneity (d). (e) Subsegment of the whole slide image shows the microscopic scale (measured in micrometers) (original magnification, ×50). (f) Pattern recognition masked image shows regional heterogeneity. In a, the CT image of non–small cell lung cancer can be analyzed to display gradients of attenuation, which reveals heterogeneous and spatially distinct environments (b). Histologic images in the same patient (c, e) reveal heterogeneities in tissue structure and density on the same scale as seen in the CT images. These images can be analyzed at much higher definition to identify differences in morphologies of individual cells (3), and these analyses reveal clusters of cells with similar morphologic features (d, f). An important goal of radiomics is to bridge radiologic data with cellular and molecular characteristics observed microscopically.
Figure 1c:
Figure 1c:
(a) Computed tomographic (CT) scan of right upper lobe lung cancer in a 50-year-old woman. (b) Isoattenuation map shows regional heterogeneity at the tissue scale (measured in centimeters). (c, d) Whole-slide digital images (original magnification, ×3) of a histologic slice of the same tumor at the mesoscopic scale (measured in millimeters) (c) coupled with a masked image of regional morphologic differences showing spatial heterogeneity (d). (e) Subsegment of the whole slide image shows the microscopic scale (measured in micrometers) (original magnification, ×50). (f) Pattern recognition masked image shows regional heterogeneity. In a, the CT image of non–small cell lung cancer can be analyzed to display gradients of attenuation, which reveals heterogeneous and spatially distinct environments (b). Histologic images in the same patient (c, e) reveal heterogeneities in tissue structure and density on the same scale as seen in the CT images. These images can be analyzed at much higher definition to identify differences in morphologies of individual cells (3), and these analyses reveal clusters of cells with similar morphologic features (d, f). An important goal of radiomics is to bridge radiologic data with cellular and molecular characteristics observed microscopically.
Figure 1d:
Figure 1d:
(a) Computed tomographic (CT) scan of right upper lobe lung cancer in a 50-year-old woman. (b) Isoattenuation map shows regional heterogeneity at the tissue scale (measured in centimeters). (c, d) Whole-slide digital images (original magnification, ×3) of a histologic slice of the same tumor at the mesoscopic scale (measured in millimeters) (c) coupled with a masked image of regional morphologic differences showing spatial heterogeneity (d). (e) Subsegment of the whole slide image shows the microscopic scale (measured in micrometers) (original magnification, ×50). (f) Pattern recognition masked image shows regional heterogeneity. In a, the CT image of non–small cell lung cancer can be analyzed to display gradients of attenuation, which reveals heterogeneous and spatially distinct environments (b). Histologic images in the same patient (c, e) reveal heterogeneities in tissue structure and density on the same scale as seen in the CT images. These images can be analyzed at much higher definition to identify differences in morphologies of individual cells (3), and these analyses reveal clusters of cells with similar morphologic features (d, f). An important goal of radiomics is to bridge radiologic data with cellular and molecular characteristics observed microscopically.
Figure 1e:
Figure 1e:
(a) Computed tomographic (CT) scan of right upper lobe lung cancer in a 50-year-old woman. (b) Isoattenuation map shows regional heterogeneity at the tissue scale (measured in centimeters). (c, d) Whole-slide digital images (original magnification, ×3) of a histologic slice of the same tumor at the mesoscopic scale (measured in millimeters) (c) coupled with a masked image of regional morphologic differences showing spatial heterogeneity (d). (e) Subsegment of the whole slide image shows the microscopic scale (measured in micrometers) (original magnification, ×50). (f) Pattern recognition masked image shows regional heterogeneity. In a, the CT image of non–small cell lung cancer can be analyzed to display gradients of attenuation, which reveals heterogeneous and spatially distinct environments (b). Histologic images in the same patient (c, e) reveal heterogeneities in tissue structure and density on the same scale as seen in the CT images. These images can be analyzed at much higher definition to identify differences in morphologies of individual cells (3), and these analyses reveal clusters of cells with similar morphologic features (d, f). An important goal of radiomics is to bridge radiologic data with cellular and molecular characteristics observed microscopically.
Figure 1f:
Figure 1f:
(a) Computed tomographic (CT) scan of right upper lobe lung cancer in a 50-year-old woman. (b) Isoattenuation map shows regional heterogeneity at the tissue scale (measured in centimeters). (c, d) Whole-slide digital images (original magnification, ×3) of a histologic slice of the same tumor at the mesoscopic scale (measured in millimeters) (c) coupled with a masked image of regional morphologic differences showing spatial heterogeneity (d). (e) Subsegment of the whole slide image shows the microscopic scale (measured in micrometers) (original magnification, ×50). (f) Pattern recognition masked image shows regional heterogeneity. In a, the CT image of non–small cell lung cancer can be analyzed to display gradients of attenuation, which reveals heterogeneous and spatially distinct environments (b). Histologic images in the same patient (c, e) reveal heterogeneities in tissue structure and density on the same scale as seen in the CT images. These images can be analyzed at much higher definition to identify differences in morphologies of individual cells (3), and these analyses reveal clusters of cells with similar morphologic features (d, f). An important goal of radiomics is to bridge radiologic data with cellular and molecular characteristics observed microscopically.
Figure 2:
Figure 2:
Contrast-enhanced CT scans show non–small cell lung cancer (left) and corresponding cluster map (right). Subregions within the tumor are identified by clustering pixels based on the attenuation of pixels and their cumulative standard deviation across the region. While the entire region of interest of the tumor, lacking the spatial information, yields a weighted mean attenuation of 859.5 HU with a large and skewed standard deviation of 243.64 HU, the identified subregions have vastly different statistics. Mean attenuation was 438.9 HU ± 45 in the blue subregion, 210.91 HU ± 79 in the yellow subregion, and 1077.6 HU ± 18 in the red subregion.
Figure 3:
Figure 3:
Chart shows the five processes in radiomics.
Figure 4:
Figure 4:
Left: Contrast-enhanced T1 image from subject TCGA-02-0034 in The Cancer Genome Atlas–Glioblastoma Multiforme repository of MR volumes of glioblastoma multiforme cases. Right: Spatial distribution of MR imaging–defined habitats within the tumor. The blue region (low T1 postgadolinium, low fluid-attenuated inversion recovery) is particularly notable because it presumably represents a habitat with low blood flow but high cell density, indicating a population presumably adapted to hypoxic acidic conditions.
Figure 5a:
Figure 5a:
(a) CT images obtained with conventional entropy filtering in two patients with non–small cell lung cancer with no apparent textural differences show similar entropy values across all sections. (b) Contour plots obtained after the CT scans were convolved with the entropy filter. Further subdividing each section in the tumor stack into tumor edge and core regions (dotted black contour) reveals varying textural behavior across sections. Two distinct patterns have emerged, and preliminary analysis shows that the change of mean entropy value between core and edge regions correlates negatively with survival.
Figure 5b:
Figure 5b:
(a) CT images obtained with conventional entropy filtering in two patients with non–small cell lung cancer with no apparent textural differences show similar entropy values across all sections. (b) Contour plots obtained after the CT scans were convolved with the entropy filter. Further subdividing each section in the tumor stack into tumor edge and core regions (dotted black contour) reveals varying textural behavior across sections. Two distinct patterns have emerged, and preliminary analysis shows that the change of mean entropy value between core and edge regions correlates negatively with survival.

References

    1. Kurland BF, Gerstner ER, Mountz JM, et al. Promise and pitfalls of quantitative imaging in oncology clinical trials. Magn Reson Imaging 2012;30(9):1301–1312 - PMC - PubMed
    1. Levy MA, Freymann JB, Kirby JS, et al. Informatics methods to enable sharing of quantitative imaging research data. Magn Reson Imaging 2012;30(9):1249–1256 - PMC - PubMed
    1. Mirnezami R, Nicholson J, Darzi A. Preparing for precision medicine. N Engl J Med 2012;366(6):489–491 - PubMed
    1. Yachida S, Jones S, Bozic I, et al. Distant metastasis occurs late during the genetic evolution of pancreatic cancer. Nature 2010;467(7319):1114–1117 - PMC - PubMed
    1. Gerlinger M, Rowan AJ, Horswell S, et al. Intratumor heterogeneity and branched evolution revealed by multiregion sequencing. N Engl J Med 2012;366(10):883–892 - PMC - PubMed