. 2013 Apr 23;25(8):1318-1331.
doi: 10.1021/cm304161d.

Heterostructuring Nanocrystal Quantum Dots Toward Intentional Suppression of Blinking and Auger Recombination

Affiliations

Heterostructuring Nanocrystal Quantum Dots Toward Intentional Suppression of Blinking and Auger Recombination

Jennifer A Hollingsworth. Chem Mater. .

Abstract

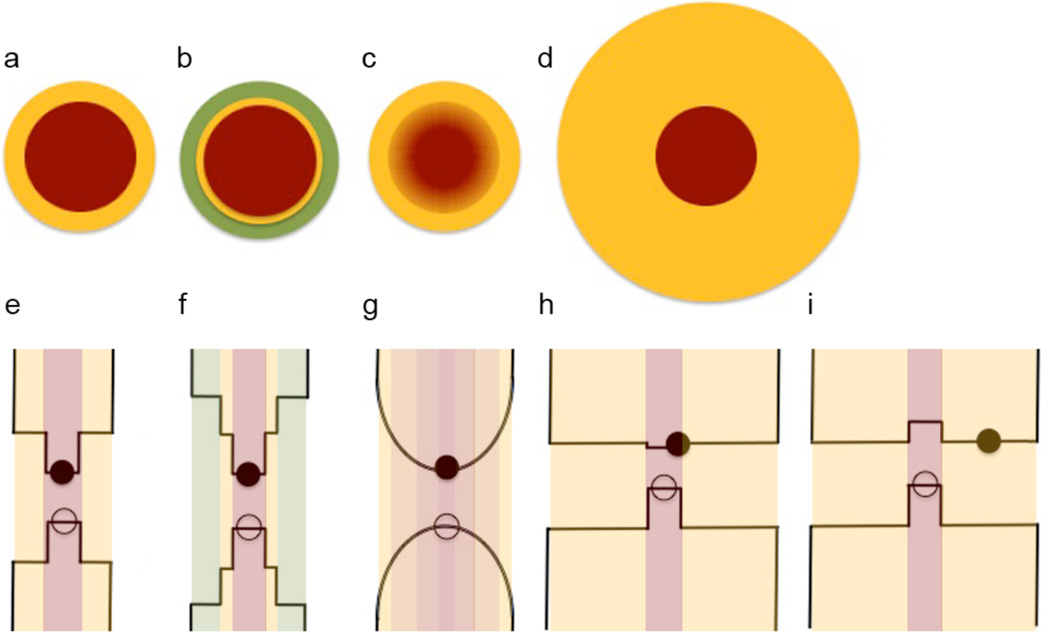
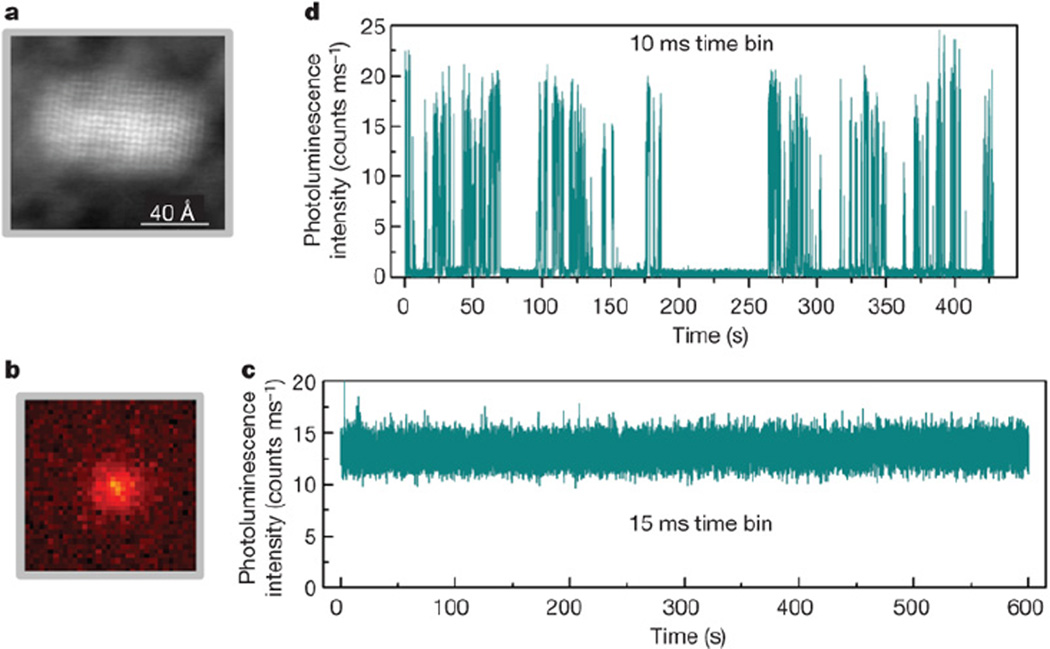
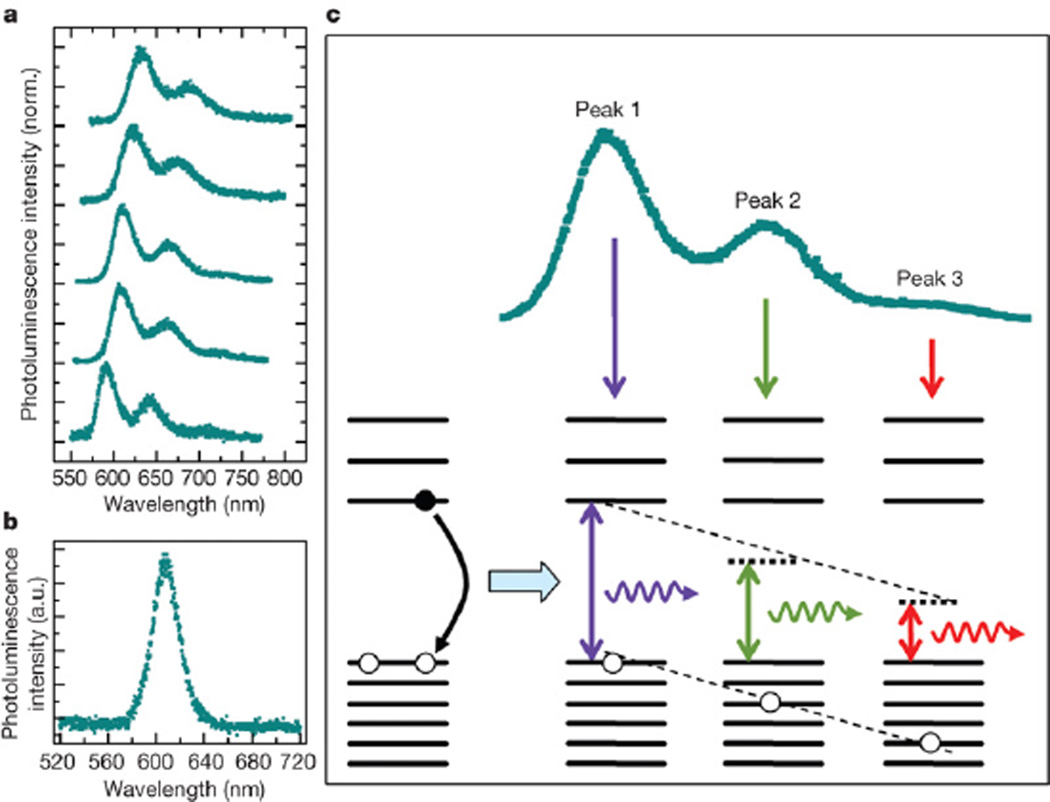
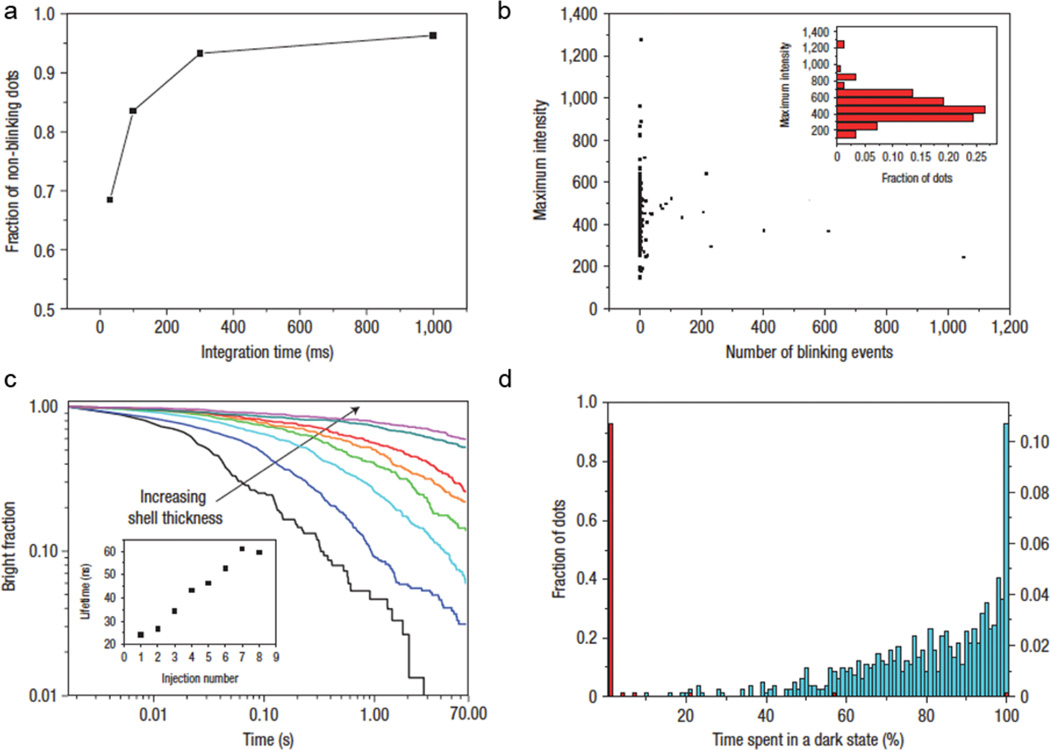
At the level of a single particle, nanocrystal quantum dots (NQDs) are observed to fluoresce intermittently or "blink." They are also characterized by an efficient non-radiative recombination process known as Auger Recombination (AR). Recently, new approaches to NQD heterostructuring have been developed that directly impact both blinking and AR, resulting in dramatic suppression of these unwanted processes. The three successful hetero-NQD motifs are reviewed here: (1) interfacial alloying, (2) thick or "giant" shells, and (3) specific type-II electronic structures. These approaches, which rely on modifying or tuning internal NQD core/shell structures, are compared with alternative strategies for blinking suppression that rely, instead, on surface modifications or surface-mediated interactions. Finally, in each case, the unique synthetic approaches or challenges addressed that have driven the realization of novel and important functionality are discussed, along with the implications for development of a comprehensive 'materials design' strategy for blinking and AR-suppressed heterostructured NQDs.

Keywords: Auger recombination; alloyed; blinking; core/shell; giant; nanocrystal quantum dots; type II.


Figures

Figure 1
Figure 1
Heterostructured nanocrystal quantum dots: variations on a theme. Core/shell heterostructures comprising (a) a conventional thin shell, (b) multiple shells of different compositions, (c) a compositionally graded core-shell interface, and (d) a thick or “giant” shell. Potential energy diagrams depicting (e) a type I band alignment, where both carriers (electron: closed circle; hole: open circle) are localized in the core, (f) a stepped type I band alignment resulting from multishell growth, (g) a gradually changing potential energy function resulting from interfacial alloying, (h) quasi type II band alignment, where one carrier (here, the electron) is partially delocalized into the shell, and (i) type II band alignment characterized by complete spatial separation of the carriers. (h) and (i) are both drawn for the particular case of a thick shell, as shown in (d).
Figure 2
Figure 2
Single-nanocrystal images and photoluminescence intensity time traces. (a) Electron micrograph of a CdZnSe/ZnSe nano-crystal with diameter ~5 nm and length ~6.7 nm. Chemical information with atomic resolution was not achieved owing to difficulties obtaining energy-loss signals from Zn, and the weak contrast between Cd and Zn. (b) Photoluminescence image (~3 µm × 3 µm) from a single CdZnSe/ZnSe nanocrystal (different nanocrystal from a). (c), (d) Time dependent photoluminescence intensity traces from a single CdZnSe/ZnSe nanocrystal (c) and a CdSe/ZnS nano-crystal (d). Similar time traces were obtained from 118 (>98%) of 120 CdZnSe/ZnSe nanocrystals studied. Reprinted by permission from Macmillan Publishers Ltd: Nature (Ref. 33), copyright 2009.
Figure 3
Figure 3
Single-nanocrystal photoluminescence spectra and the “shakeup process.” (a) Photoluminescence spectra of five selected single CdZnSe/ZnSe nanocrystals. (b) Photoluminescence spectrum of a single CdSe/ZnS nanocrystal. (c) Diagram of a shake-up process used to explain the multi-peaked photoluminescence spectrum from a single CdZnSe/ZnSe nanocrystal. The annihilation energy of the trion (spacing between two dashed lines) is distributed between the emitted photon energy (shown by blue, green and red arrows) and the energy of the extra hole, which could occupy one of many allowed levels after recombination. Reprinted by permission from Macmillan Publishers Ltd: Nature (Ref. 33), copyright 2009.
Figure 4
Figure 4
Intensity fluctuations and blinking behaviour of single CdSe–CdS QDs visualized with a CCD camera. (a) Fraction of nonblinking quantum dots as a function of integration time. Images are acquired continuously for 5 min. Statistics on 165 QDs. Measurements were made on a dried QD film. (b) The same sample and recording conditions as in a. Number of dark states versus maximum emission intensity for each QD. Inset: Proportion of QDs emitting at a given maximum intensity. (c) Percentage of QDs that have not blinked versus time for different CdS layer thicknesses. Different layers are obtained by successive injections of shell precursors. All films were acquired in the same conditions and the statistics for each layer were on at least 120 QDs using automatic home-made software. Images were acquired continuously for 1 min at 33 Hz. Inset: fluorescence lifetime for the various shell thicknesses. (d) Percentage of time a QD spends in a dark state during 1 min measurement at 33 Hz. Red, CdSe with eight CdS shells; blue, CdSe–ZnS QDs. Statistics on more than 150 QDs for each QD type. Reprinted by permission from Macmillan Publishers Ltd: Nature Materials (Ref. 42), copyright 2008.
Figure 5
Figure 5
Transmission electron microscopy (TEM) images for (a) CdSe NQD cores, (b) CdSe/19CdS g-NQDs, and (c) CdSe/11CdS-6CdxZnyS-2ZnS g-NQDs. (d) Absorption (dark blue) and PL (light blue) spectra for CdSe NQD cores. (e) Absorption (dark red) and PL (light red) spectra for CdSe/19CdS g-NQDs (inset: absorption spectrum expanded to show contribution from core). (f) Normalized PL compared for growth solution and first precipitation/redissolution for CdSe/11CdS-6CdxZnyS-2ZnS and CdSe/19CdS g-NQDs (red), CdSe/2CdS-2ZnS and CdSe/2CdS-3CdxZnyS-2ZnS NQDs (green), and CdSe core NQDs (blue). Dashed line indicates no change. Reprinted from Ref. .
Figure 6
Figure 6
Single NQD studies. (a) Emitting NQD fraction over time: Qdot655ITK (black); g-NQD CdSe/19CdS (red). (b) Fluorescence image and (c) on-time histograms of Qdot655ITK (left) and CdSe/19CdS g-NQD (right). Insets in (c) show fluorescence time traces of the circled NQDs in (b). Temporal resolution is 200 ms. Reprinted from Ref. .
Figure 7
Figure 7
Single-NQD photoluminescence studies. (a) On-time histogram of a CdSe/19 CdS g-NQD population constructed from analysis of typically >100 individual g-NQDs. An example fluorescence time trace (used to prepare a histogram) for an individual CdSe/19 CdS g-NQD is shown in the inset to (a). Plot of ‘percent NQD population’ versus the number of CdS shell monolayers for different on-times (b). Two preparations/analyses are plotted for the 10-, 16-, and 19-shell systems, providing an indication of experimental variability in (b). Photobleaching behavior: plots of emitting NQD fractions over time are presented for CdSe/5 CdS (top left), CdSe/10 CdS (top right), CdSe/15 CdS (bottom left), and CdSe/19 CdS (bottom right) core/shell NQDs (c). Reprinted from Ref. .
Figure 8
Figure 8
TEM picture of perfect zinc blende CdSe/CdS tetrahedral nanocrystals (edge length: 9 nm). FFT of HRTEM image reveals a characteristic [110] zone axis. Reprinted from Ref. .
Figure 9
Figure 9
SILAR Reaction Scheme for Growth of Thick-Shell Core/Shell NQDs. Blue text denotes general reaction parameters and reaction flow, while green text shows options for modifying specific reaction conditions to influence g-NQD physicochemical and optical properties. Reprinted from Ref. .
Figure 10
Figure 10
(a) Non-blinking NQD fraction (defined as the population of NQDs “on” for ≥99% of the observation time) as a function of shell thickness for different core sizes. Core size is indicated within the figure, where d refers to diameter. (b) Histogram of blinking statistics for thick-shell NQDs fabricated using an extra-large (top) or a small (bottom) CdSe core. For approximately the same shell thickness, the large core achieves essentially complete suppression of blinking. (c) Non-blinking NQD fraction as a function of total particle volume for different starting core sizes [see (a) for legend]; shaded region highlights the particle volumes that fall below the “threshold volume” of ~750 nm3, above which non-blinking fraction increases approximately linearly with NQD volume. For (a)–(c), observation time used to obtain blinking statistics is ~1 hour. Modified from Ref. .
Figure 11
Figure 11
InP/CdS core/shell NQDs. (a) Schematic of the InP/CdS core/shell structure and the relative bulk bandgap alignment of the core and shell materials. Localization of the excited electron in the CdS shell and the resulting hole in the InP core is indicative of type-II bandgap structure. (b-e) TEM images of InP/CdS core/shell nanocrystals after 1, 4, 7, and 10 successive shell depositions, respectively. The scale bar for all four images is 5 nm. Reprinted from Ref. .
Figure 12
Figure 12
Blinking and photobleaching. (a) Summary of blinking behavior for multiple individual NQDs for several shell thicknesses. Each dot index represents the blinking behavior of one dot. Black regions in each image represent times when the dot is in the “off” state. Colored regions correspond to “on” states. Green, orange, and red traces represent single dot data from InP/1CdS, InP/4CdS, and InP/10CdS, respectively. (b) Representative intensity trajectories of single NQDs (both InP/10CdS). The top and bottom traces correspond to dot indices 4 and 10 in the top panel, respectively. (c) Relative photobleaching from each sample over time. NQDs drop-cast and imaged under wide-field laser excitation (405 nm) using a CCD with 1 s integration time for three hours. The number of dots having a PL intensity above a threshold value was tabulated for each frame. The fraction of dots meeting this criterion (relative to the number of dots present at t = 0) is plotted as a function of time. Reprinted from Ref. .

Similar articles

Cited by

References

    1. Leatherdale CA, Woo W-K, Mikulec FV, Bawendi MG. J. Phys. Chem. B. 2002;106:7619.
    1. Jaiswal JK, Mattoussi H, Mauro JM, Simon SM. Nat. Biotechnol. 2003;21:47. - PubMed
    1. Inerbaev TM, Masunov AE, Khondaker SI, Do-brinescu A, Plamadă A-V, Kawazoe Y. J. Chem. Phys. 2009;131:044106. - PubMed
    1. Van Sark WGJHM, et al. J. Phys. Chem. B. 2001;105:8281.
    1. Nirmal M, Dabbousi BO, Bawendi MG, Macklin JJ, Trautman JK, Harris TD, Brus LE. Nature. 1996;383:802.