. 2013 Aug 20:6:109-19.
doi: 10.2147/JIR.S43736. eCollection 2013.

Anti-inflammatory effects of budesonide in human lung fibroblast are independent of histone deacetylase 2

Affiliations

Anti-inflammatory effects of budesonide in human lung fibroblast are independent of histone deacetylase 2

Xingqi Wang et al. J Inflamm Res. .

Abstract

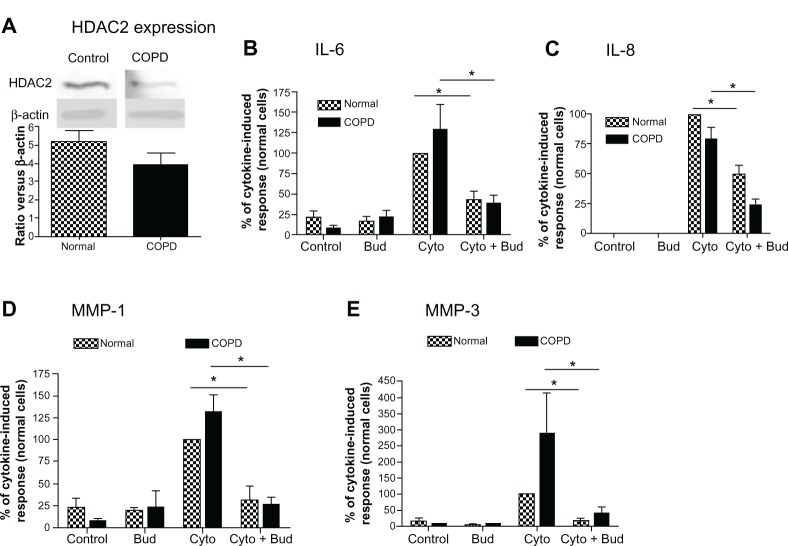
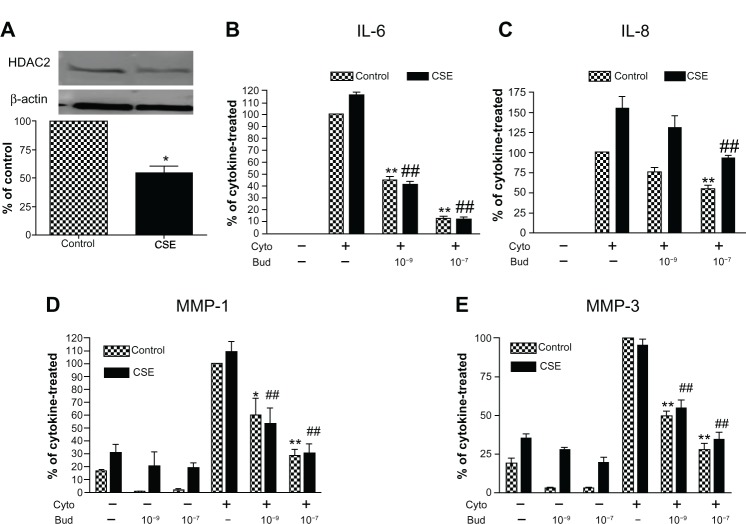
Objective and design: Reduced expression of histone deacetylase 2 (HDAC2) in alveolar macrophages and epithelial cells may account for reduced response of chronic obstructive pulmonary disease (COPD) patients to glucocorticoids. HDAC2 expression and its role in mediating glucocorticoid effects on fibroblast functions, however, has not been fully studied. This study was designed to investigate whether HDAC2 mediates glucocorticoid effects on release of inflammatory cytokines and matrix metalloproteinases (MMPs) from human lung fibroblasts.

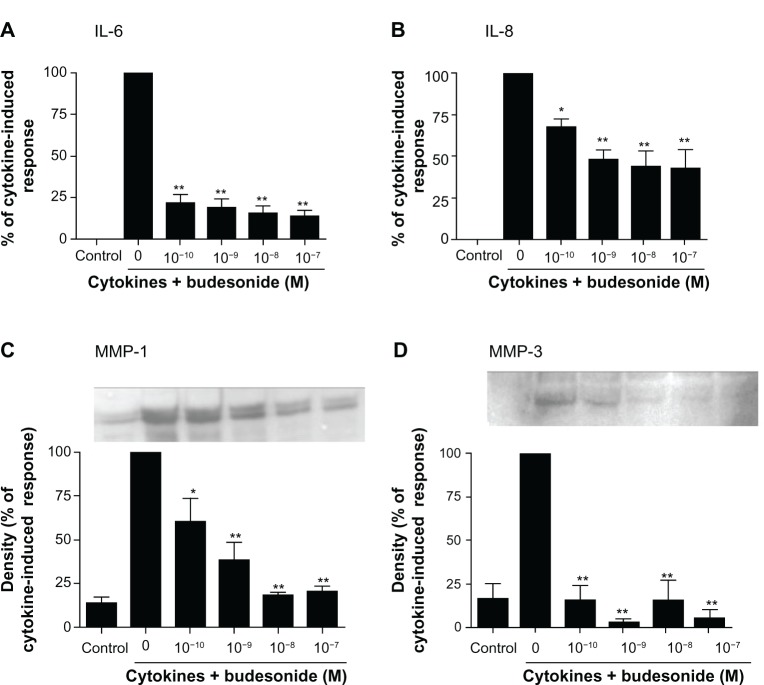
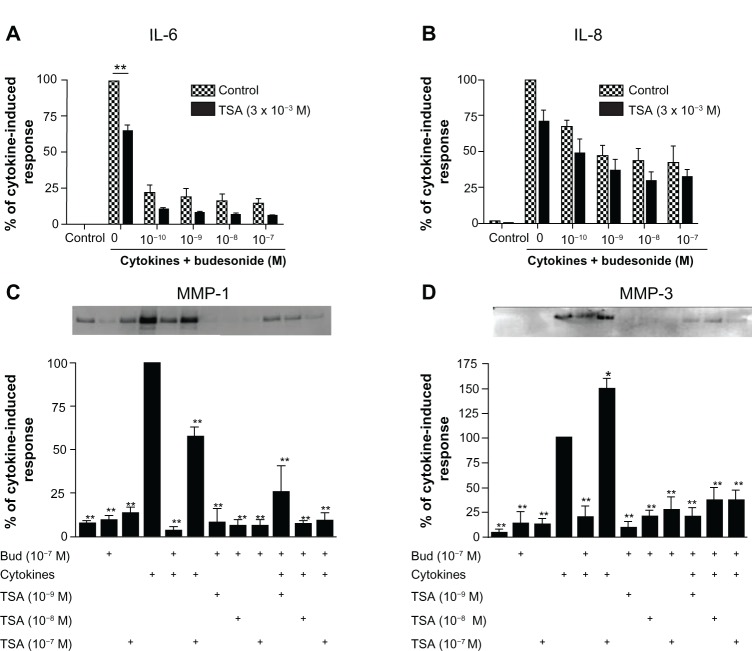
Methods: Human lung fibroblasts (HFL-1 cells) were stimulated with interleukin (IL)-1 β plus tumor necrosis factor (TNF)-α in the presence or absence of the glucocorticoid budesonide. Cytokines (IL-6 and IL-8) were quantified by enzyme linked immunosorbent assay (ELISA) and MMPs (MMP-1 and MMP-3) by immunoblotting in culture medium. The role of HDAC2 was investigated using a pharmacologic inhibitor as well as a small interfering ribonucleic acid (siRNA) targeting HDAC2.

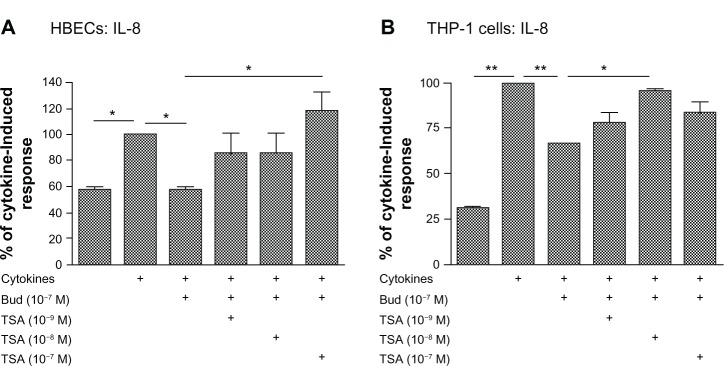
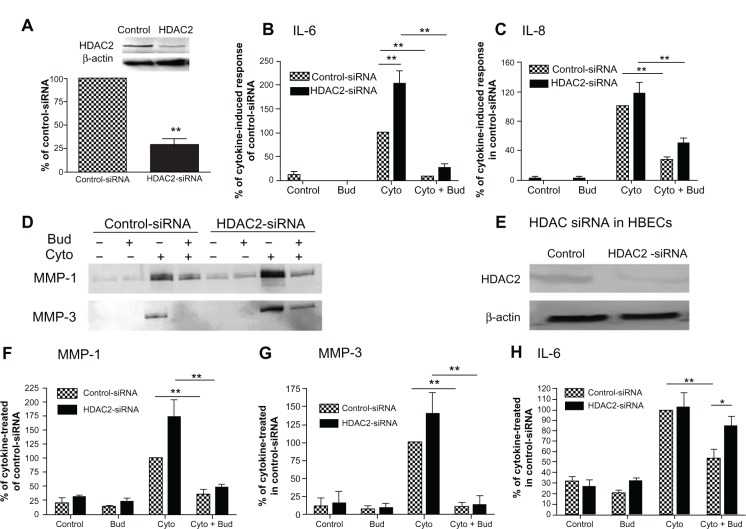
Results: We have demonstrated that budesonide concentration-dependently (10(-10)-10(-7) M) inhibited IL-6, IL-8, MMP-1, and MMP-3 release by HFL-1 cells in response to IL-1β plus TNF-α. While an HDAC inhibitor significantly blocked the inhibitory effect of budesonide on human bronchial epithelial cells (HBECs) and monocytes (THP-1 cells), it did not block the inhibitory effect of budesonide on release of cytokines and MMPs from HFL-1 cells. Similarly, an HDAC2-siRNA blocked budesonide inhibition of cytokine release in HBECs, but it did not block the inhibitory effect of budesonide on HFL-1 cytokine and MMP release. Furthermore, budesonide significantly blocked release of cytokines and MMPs to a similar degree in normal and COPD lung fibroblasts as well as in HFL-1 cells exposed or not exposed to cigarette smoke extract.

Conclusion: These findings suggest that, in contrast to airway epithelial cells and monocytes/macrophages, HDAC2 is not required for budesonide to inhibit MMP and cytokine release by lung fibroblasts and this inhibitory pathway appears to be intact in cultured fibroblasts from COPD patients. These results also suggest that budesonide has the potential to modulate fibroblast-mediated tissue remodeling following airway inflammation in COPD, which is mediated via an HDAC2 independent pathway.

Keywords: HDAC2; budesonide; fibroblasts.


Figures

Figure 1
Figure 1
Budesonide inhibits release of cytokines and MMPs by human lung fibroblasts. Notes: HFL-1 cells were cultured until sub-confluence and treated with varying concentrations of budesonide for 30 minutes followed by stimulation with cytokines (IL-1β plus TNF-α, 1 ng/ml each). After 24 hours, medium was harvested for quantification of IL-6 (A) and IL-8 (B) by ELISA, and MMP-1 (C) and MMP-3 (D) by immunoblotting. (A and B): Effect on IL-6 and IL-8 release. Cell number was counted with a Coulter counter and the cytokine level was normalized to the cell number. Vertical axis: amount of IL-6 or IL-8 expressed as percentage of response in cytokines-only treated (IL-1β plus TNF-α) cells; horizontal axis: treatment with cytokines and varying concentrations of budesonide. Data presented are the mean ± SEM of three separate experiments. (C and D): Inset is an example of immunoblot image. In order to make quantitative comparisons, the same volume of media from each condition was harvested and precipitated for loading. Bar graphs presented are densitometric analysis of immunoblots expressed as the mean ± SEM of three separate experiments. Vertical axis: density of the image expressed as percentage of density in the cytokines-only treated group; horizontal axis: treatment with cytokines and varying concentrations of budesonide. *P < 0.05; **P < 0.01 compared to cytokines alone by one way analysis of variance followed by Tukey’s test. Abbreviations: ELISA, enzyme linked immunosorbent assay; IL, interleukin; MMP, matrix metalloproteinase; SEM, standard error of the mean; TNF, tumor necrosis factor.
Figure 2
Figure 2
Trichostatin A does not block the budesonide effect in human lung fibroblasts. Notes: HFL-1 cells were plated and grown to sub-confluence. Cells were then rinsed with DMEM and treated with TSA for 30 minutes. Following this, varying concentrations of budesonide and IL-1β plus TNF-α were added such that the final concentrations of IL-1β and TNF-α were 1 ng/mL each and the concentrations of budesonide were as described in the figure. After 24 hours, media were harvested for quantification of IL-6 (A), IL-8 (B), and MMP-1 and -3 (C and D). (A and B) Effect on IL-6 and IL-8 release (ELISA). Cell number was counted with a Coulter Counter and the cytokine level was normalized to the cell number. Vertical axis: amount of IL-6 or IL-8 expressed as percentage of response in the cytokines-only treated group; horizontal axis: treatment with cytokines and varying concentrations of budesonide. hatched bars: control (cells without TSA treatment); solid bars: cells treated with TSA (3 × 10⁻⁸ M). Data presented are the mean ± SEM of three separate experiments. **P < 0.01 by two way analysis of variance followed by Bonferroni post-hoc test. (C and D) Densitometric analysis of the MMP-1 and -3 immunoblots (insets). In order to make quantitative comparisons, the same volume of media from each condition was harvested and precipitated for loading. Vertical axis: density expressed as percentage of the cytokines-only treated group. horizontal axis: treatment with cytokines, budesonide (10−7 M) and varying concentrations of TSA. Data presented are the mean ± SEM of three separate experiments. *P < 0.05; **P < 0.01 compared to cytokine alone by two way analysis of variance followed by Bonferroni test. Abbreviations: Bud, budesonide; DMEM, Dulbecco’s Modified Eagle’s Medium; ELISA, enzyme linked immunosorbent assay; HFL, human lung fibroblast; IL, interleukin; MMP, matrix metalloproteinase; SEM, standard error of the mean; TNF, tumor necrosis factor; TSA, trichostatin A.
Figure 3
Figure 3
Trichostatin A blocks budesonide effect in HBECs (A) and monocytes (THP-1; B). Notes: Nearly confluent HBECs were pretreated with varying concentrations of TSA for 30 minutes. Cells were then treated with budesonide (10−7 M) in the presence or absence of cytokines IL-1b plus TNF-α (1 ng/ml each). After 24 hours, medium was harvested for quantification of IL-8 by ELISA. Cell number was counted with a Coulter Counter and the cytokine level was normalized to the cell number. Vertical axis: IL-8 amount expressed as percent of response in cytokines-only treated cells; horizontal axis: treatment. Data presented are the mean ± SEM of three separate experiments. *P < 0.05; **P < 0.01 by one way analysis of variance followed by Tukey’s testAbbreviations: Bud, budesonide; ELISA, enzyme linked immunosorbent assay; HBECs, human bronchial epithelial cells; IL, interleukin; SEM, standard error of the mean; TNF, tumor necrosis factor; TSA, trichostatin A.
Figure 4
Figure 4
HDAC2 suppression by siRNA and its role in mediating the effect of budesonide on human lung fibroblasts and bronchial epithelial cells. Notes: HFL-1 cells or HBECs were transfected with either a negative control siRNA or an siRNA targeting HDAC2 (HDAC2-siRNA). Cells were then treated with cytokines IL-1β plus TNF-α (1 ng/mL each) in the presence or absence of budesonide (10−7 M). Hatched bars: cells transfected with non-targeting control-siRNA; solid bars: cells transfected with siRNA specifically targeting HDAC2. (A) Suppression of HDAC2 by siRNA in HFL-1 cells. Density of HDAC2 was normalized by β-actin density for each experiment, and then data were expressed a mean ratio (± SEM) of HDAC2-siRNA density versus control-siRNA density in three separate experiments. Inset: Image of immunoblot from one representative experiment. Top band: HDAC2; bottom band: β-actin. **P < 0.01 compared to control-siRNA. (B and C) Effect of HDAC2 suppression by siRNA on budesonide (10−7 M) inhibition of IL-6 and IL-8 release (ELISA) by HFL-1 cells (data were normalized to the cell number; data are shown as the mean ± SEM of three separate experiments). (D, F and G) Effect of HDAC2 suppression by siRNA on budesonide (10−7 M) inhibition of MMP-1 and MMP-3 release (immunoblotting) by HFL-1 cells. Data presented are one representative of three separate experiments (D) or the mean ± SEM of three separate experiments. In order to make quantitative comparisons, the same volume of media from each condition was harvested and precipitated for loading. (E and H) Effect of HDAC2 suppression by siRNA on budesonide (5 × 10⁻⁷ M) inhibition of IL-6 release by HBECs. After siRNA transfection, cells were treated with cytokines and budesonide as indicated for 24 hours. Media were harvested and IL-6 was quantified by ELISA (data were normalized to the cell number). (E) Immunoblots of HDAC2 and β-actin, showing suppression of HDAC2 by HDAC2-siRNA but not by control-siRNA. (H) Vertical axis: IL-6 amount expressed as percent of cytokine in control-siRNA treated cells; horizontal axis: treatment. Data presented are the mean ± SEM of two different HBEC cell lines. *P < 0.05, **P < 0.01. Abbreviations: Bud, budesonide; Cyto, cytokines; ELISA, enzyme linked immunosorbent assay; HBEC, human bronchial epithelial cells; HDAC, histone deacetylase; HFL, human lung fibroblast; IL, interleukin; MMP, matrix metalloproteinase; SEM, standard error of the mean; si, small interfering; TNF, tumor necrosis factor; TSA, trichostatin A.
Figure 5
Figure 5
HDAC expression in the lung fibroblasts from COPD patients and its role in mediating budesonide effect. Notes: (A) HDAC2 expression in the fibroblasts isolated from normal subjects and COPD patients. Density of HDAC2 was normalized by β-actin density for each experiment, and then data were expressed as mean + SEM of six separate isolations of primary fibroblasts from each group. Inset: Image of representative immunoblot Top band: HDAC2; bottom band: β-actin. (B–E) effect of budesonide on IL-6 (B), IL-8 (C), MMP-1 (D), and MMP-3 (E) release by lung fibroblasts from normal subjects and COPD patients under control conditions and after stimulation with cytokines IL-1 β plus TNF-α (1 ng/ml each). IL-6 and IL-8 were quantified by ELISA (data were normalized to the cell number), and MMP-1 and MMP-3 by immunoblotting. In order to make quantitative comparisons, the same volume of media from each condition was harvested and precipitated for loading. Vertical axis: mediator amount expressed as percent of response in cytokines-only treated fibroblasts from normal subjects; horizontal axis: treatment. hatched bars: fibroblasts from normal subjects; solid bars: fibroblasts from COPD patients. *P < 0.05. Data presented are the mean + SEM of six separate primary cells from each group. Abbreviations: Bud, budesonide; COPD, chronic obstructive pulmonary disease; Cyto, cytokines; ELISA, enzyme linked immunosorbent assay; HDAC, histone deacetylase; IL, interleukin; MMP, matrix metalloproteinase; SEM, standard error of the mean; TNF, tumor necrosis factor.
Figure 6
Figure 6
CSE effect on HDAC expression by human lung fibroblasts and its role in mediating budesonide effect. Notes: (A) Effect of CSE on HDAC2 expression. HFL-1 cells were treated with 5% CSE for 72 hours. HDAC2 level was assessed by immunoblotting. Density of HDAC2 was normalized by β-actin density for each experiment, and then data were expressed as an average ratio of HDAC2 density in CSE-exposed fibroblasts versus HDAC2 density in control fibroblast. Inset Image of immunoblot Top band: HDAC2; bottom band: β-actin. Image data is one representative of three separate experiments and bar graph shows the mean ± SEM of three separate experiments. (B–E) Budesonide effect on IL-6 (B), IL-8 (C), MMP-1 (D), and MMP-3 (E) release induced by cytokines IL-1 β plus TNF-α (1 ng/ml each) in the cells exposed or not exposed (control) to CSE. HFL-1 cells were pre-treated with or without 5% CSE for 72 hours. Cells were then stimulated with cytokines in the presence of varying concentrations of budesonide. Vertical axis: protein levels expressed as percent of response in cytokines-only treated control fibroblasts; horizontal axis: treatment. Hatched bars: without CSE exposure; solid bars: cells exposed to 5% CSE. Data presented are the mean ± SEM of three separate experiments. *P < 0.05; **P < 0.01 compared to cytokines-only treated control fibroblasts; ##P < 0.01 compared to cytokines-only treated fibroblast exposed to CSE. Abbreviations: Bud, budesonide; CSE, cigarette smoke extract; Cyto, cytokines; HDAC, histone deacetylase; HFL, human lung fibroblast; IL, interleukin; MMP, matrix metalloproteinase; SEM, standard error of the mean; TNF, tumor necrosis factor.

Similar articles

Cited by

References

    1. Hogg JC. Pathophysiology of airflow limitation in chronic obstructive pulmonary disease. Lancet. 2004;364(9435):709–721. - PubMed
    1. Spurzem JR, Rennard SI. Pathogenesis of COPD. Semin Respir Crit Care Med. 2005;26(2):142–153. - PubMed
    1. Ito K, Ito M, Elliott WM, et al. Decreased histone deacetylase activity in chronic obstructive pulmonary disease. N Engl J Med. 2005;352(19):1967–1976. - PubMed
    1. Barnes PJ. Role of HDAC2 in the pathophysiology of COPD. Annu Rev Physiol. 2009;71:451–464. - PubMed
    1. Adcock IM, Ito K, Barnes PJ. Histone deacetylation: an important mechanism in inflammatory lung diseases. COPD. 2005;2(4):445–455. - PubMed

LinkOut - more resources