. 2013 Sep 11:7:141.
doi: 10.3389/fncir.2013.00141. eCollection 2013.

Impairment of GABA transporter GAT-1 terminates cortical recurrent network activity via enhanced phasic inhibition

Affiliations

Impairment of GABA transporter GAT-1 terminates cortical recurrent network activity via enhanced phasic inhibition

Daniel S Razik et al. Front Neural Circuits. .

Abstract

In the central nervous system, GABA transporters (GATs) very efficiently clear synaptically released GABA from the extracellular space, and thus exert a tight control on GABAergic inhibition. In neocortex, GABAergic inhibition is heavily recruited during recurrent phases of spontaneous action potential activity which alternate with neuronally quiet periods. Therefore, such activity should be quite sensitive to minute alterations of GAT function. Here, we explored the effects of a gradual impairment of GAT-1 and GAT-2/3 on spontaneous recurrent network activity--termed network bursts and silent periods--in organotypic slice cultures of rat neocortex. The GAT-1 specific antagonist NO-711 depressed activity already at nanomolar concentrations (IC50 for depression of spontaneous multiunit firing rate of 42 nM), reaching a level of 80% at 500-1000 nM. By contrast, the GAT-2/3 preferring antagonist SNAP-5114 had weaker and less consistent effects. Several lines of evidence pointed toward an enhancement of phasic GABAergic inhibition as the dominant activity-depressing mechanism: network bursts were drastically shortened, phasic GABAergic currents decayed slower, and neuronal excitability during ongoing activity was diminished. In silent periods, NO-711 had little effect on neuronal excitability or membrane resistance, quite in contrast to the effects of muscimol, a GABA mimetic which activates GABAA receptors tonically. Our results suggest that an enhancement of phasic GABAergic inhibition efficiently curtails cortical recurrent activity and may mediate antiepileptic effects of therapeutically relevant concentrations of GAT-1 antagonists.

Keywords: GABA receptor; GABA reuptake; GABA transporter; NO-711; SNAP-5114; phasic inhibition; spillover; tonic inhibition.


Figures

FIGURE 1
FIGURE 1
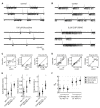
Spontaneous activity patterns in organotypic slice cultures of rat neocortex. (A) Paired current clamp recording of a putative fast-spiking interneuron (upper trace) and a putative pyramidal neuron (lower trace) which were separated by ~150 μm and not connected to each other. Insets to the right represent spike responses to depolarizing current injections during silent periods. Both neurons were in infragranular layers. (B) Example of a paired current clamp (upper trace) and extracellular recording (lower trace, broadband signal, 1–5000 Hz). As in (A), inset depicts the neuron’s spiking response. (C) Expanded view of burst marked by asterisk in (B). Upper trace represents the current-clamped neuron’s membrane potential with action potentials clipped at -20 mV. Turquoise and overlaid black trace in the second row from top represent the extracellular broadband trace and the local field potential (LFP) component, respectively. Third trace from top is the rectified LFP trace (LFPrect) which was used to detect bursts via a threshold (dotted line). Scattered line fragments below the trace are the portions of LFPrect above threshold. Continuous line represents the burst as defined on the basis of a maximally allowed gap width of 500 ms between the fragments (see Materials and Methods for more detail on burst detection). Bottom trace, highpass filtered extracellular signal containing multiunit activity. Dots below the trace are the action potentials detected via a threshold (dotted line), which in the example shown was at -4.4 standard deviations of the base line noise. (D) Box and whisker plot of burst duration. Each sample represents a recording from one culture under control (drug-free) condition (n = 125, pooled from all experiments). Data are sorted according to the median (white circle with black central dot). Black bars depict the interquartile range, and black lines extend to the full range of burst durations in the recordings. (E) Asymmetry index (ai, see Methods) of burst duration of the corresponding recordings. Positive/negative values indicate the presence of a few disproportionately long/short bursts (relative to the median). (F) Representative extracellular recordings (broadband signal) marked by bold symbols and numbers in (B). (G) Plot of median burst duration vs. median of silent period duration for each of the recordings shown in (D) and (E). Solid line is the identity line. (H) Distribution of proportion of time in bursts.
FIGURE 2
FIGURE 2
Activity-depressant effects of the GAT-1-selective blocker NO-711 and the GAT-2/3 preferring antagonist SNAP-5114. (A) Example extracellular recordings (broadband signal) with both drugs at concentrations close to the IC50 of their most sensitive molecular targets. 50 nm NO-711 diminished spontaneous activity strongly, whereas 5 μM SNAP-5114 had a weaker effect. The effects of NO-711 were only partly reversible upon washout (Gonzalez-Burgos et al., 2009). (B) Concentration–response curves of NO-711 (left) and SNAP-5114 (right) for multiunit action potential rates. All data are normalized to the control condition (absence of drug). Open gray circles are data from individual experiments, filled black circles and error bars represent means and sd, respectively. Smooth black line connecting the means represents a Hill fit to the NO-711 data. Gray dashed lines represent IC50 values. (C) Concentration–response curves of NO-711 (left) and SNAP-5114 (right) for the proportion of time spent in bursts. All conventions as in (B).
FIGURE 3
FIGURE 3
Effects of NO-711 on activity patterns. (A) Concentration–response plot of burst duration normalized to control (means ± sd; gray open symbols are data from individual experiments). (B) Concentration–response plot of silent periods [same conventions as in (A)]. Note different scale of ordinate. (C) Peri-burst time histograms of multiunit firing activity during control and 250 nM NO-711 (n = 16, paired data, median of all experiments). t = 0 is the beginning of bursts as detected in the field potential. Bin widths were 10 ms up to 200 ms post-event and 25 ms further into the bursts. (D) AUROC (black line) and bootstrapped 95% confidence intervals (gray area) for the bin-by-bin comparison of the PETHs in (C). (E) Same as (D), but for all concentrations of NO-711 tested. Confidence intervals were omitted for clarity.
FIGURE 4
FIGURE 4
Contribution of GABAA and GABAB receptors to activity patterns and to the depressant effects of NO-711. (A) Exemplary extracellular recording of a culture exposed to the GABAA receptor antagonist bicuculline (broadband signal). Note the drug-induced stereotyped appearance of the network bursts. (B) Exemplary extracellular recording with the GABAB receptor blocker CGP55845 (5 μM). (C) Effect of bicuculline (100 μM) on median burst duration (left), proportion of time spent in bursts (center), and average firing rate (right). Bicuculline appeared to “clamp” burst duration at 1.8 ± 0.7 s (mean ± sd), on average causing a prolongation with wide margins of uncertainty (g1(1) = 0.52 [-0.24 1.25], p = 0.18, n = 8); it strongly reduced both the proportion of time spent in bursts (g1(1) = -1.58 [-2.62 -0.49], p = 0.003, n = 8) and average firing rates (g1(1) = -2.60 [-3.90 -1.25], p = 1.8 * 10-5, n = 10). (D) Effect of CGP55845 (5 or 10 μM) on the same parameters as shown in (C). CGP55845 increased burst duration on average by 68% (g1(1) = 0.76 [0.15 1.35], p = 0.014, n = 14), whereas the proportion of time spent in bursts showed a weak opposite effect (g1(1) = -0.45 [-0.99 0.11], p = 0.14, n = 14). There was no evidence for an effect on average firing rates (g1(1) = 0.11 [-0.63 0.85], p = 0.77, n = 7). (E) Comparison of the effects of 250 nM NO-711 alone and with prior application of CGP 55845 and bicuculline: median burst duration (left), proportion of time spent in bursts (center) and average firing rate (right). All data were normalized to the respective control (absence of NO-711). Full symbols and error bars are means ± sd; gray symbols are data from individual experiments. (F) Statistical analysis of the data shown in (E). The plot depicts, for each of the three parameters shown in (E), standardized mean differences (termed gψ) between the conditions [NO-711] and [GABA receptor antagonist and NO-711]. Error bars are 95% confidence intervals.
FIGURE 5
FIGURE 5
GABAergic currents altered by GAT-1 inhibition. (A) Example recording of a putative pyramidal neuron held in voltage clamp at 0 mV, revealing large outward currents which reflect mostly chloride currents through GABAA receptors. The effects of NO-711 were only partly reversible after washout. (B) Excerpts of outward currents triggered to the onset of the bursts. In all three conditions, one representative burst is depicted in color, the hue corresponding to time. (C) Plots of current slope vs. current amplitude for the excerpts shown in (B) (same column order). Colored trajectories correspond to the colored excerpts in (B). Jagged appearance of positive slopes (rise phase) is due to downsampling of data to 1000 Hz (after lowpass filtering at 500 Hz). (D) Plots of current slope vs. current amplitude for all excerpts at full length in the recording shown in (A), restricted to the decay phases (negative slopes). Each dot represents one linear slope. Colored trajectories are the same as in (C), except that segments with a positive slope were omitted. Note the upward shift of points toward less negative values in the middle graph, corresponding to a flattening of the decay currents. (E) Comparison of the current decay slopes in the control condition with those in the presence of NO-711. The blue line depicts the AUROC values stemming from an amplitude-matched comparison of the current slope values shown in (D) (bin size was 0.25 nA). Shaded area corresponds to bin-wise 95% confidence intervals. The “zero effect” value of AUROC at 0.5 is marked with a dashed line. (F) Summary statistics for five tested neurons (cyan, 250 nM NO-711, blue, 1000 nM NO-711). (G) Development of tonic and phasic outward currents during wash-in of 1000 nM NO-711. Black dots are estimates of the holding current averaged in 200 ms-intervals; width and height of gray bars represent duration and amplitude averaged over duration, respectively, of phasic currents. Note the different amplitude scales.
FIGURE 6
FIGURE 6
Effects of GAT-1 inhibition and tonic activation of GABAA receptors on neuronal membrane resistance. (A) Example recording of a putative pyramidal neuron (top trace within each pair of traces, R = 150 MΩ) and multiunit action potential activity on a nearby extracellular electrode (bottom trace) during control and after sequential application of NO-711 and muscimol. The neuron was repetitively injected with a 40 pA rectangular hyperpolarizing current throughout the length of the data excerpts shown. The current traces are clipped to reveal detail of the responses to current injection. Arrow in the second pair of traces from top points to a membrane voltage response which is strongly reduced in the wake of a network burst in 250 nM NO-711. Note the nearly complete absence of spontaneous activity with 500 nM muscimol which recovers after the second washout. (B) Resting membrane resistance of five neurons exposed to both muscimol and NO-711. (C) Simplified theoretical relationship between an observed change of resting membrane resistance (abscissa) and the underlying tonic conductance, expressed in terms of the tonic current at an assumed ionic driving force of 85 mV. Curves are shown for three neurons with different initial resistances (full symbols).
FIGURE 7
FIGURE 7
Effects of GAT-1 inhibition and tonic activation of GABAA receptors on somatic excitability. (A) Exemplary neuronal membrane voltage traces recorded during injection of a sinusoidal ramp current during control (left), 250 nM NO-711 (center), and after washout of the drug (right). The amplitude of the current waveform (blue trace at bottom in left block of traces) was adjusted for each neuron individually such that during control conditions action potentials were elicited starting at about the fifth of the eight current peaks. Membrane potential traces are clipped at 0 mV to enhance visibility of low-amplitude potential fluctuations. Gray patches delineate the pre-stimulus window of [-100 0] ms in which the median and variability of EM were computed. (B) For the same experiments as shown in (A), the plots depict the 2.5–97.5 interpercentile range of EM in the pre-stimulus window (gray shades) and the spike count during the current stimulus (dots connected by lines) versus sweep number. Inter-sweep interval was 620 ms. The sweeps marked by magenta circles are depicted in (A) (left to right corresponding top to bottom). (C) Scatter plot of correlation coefficients r var(EM) and rEM (see main text) for control and NO-711 conditions. Each pair of circles connected by a dotted line corresponds to one cell. Error bars are 95% confidence intervals. Note that the width of the error bars depends crucially on the number of injected current sweeps, which varied between the neurons and between drug conditions. (D) Spike counts, averaged over all sweeps during control and 250 nM NO-711, for the same cells as depicted in (C) (means ± sd). Each pair of connected gray open circles represents one cell. (E) Spike counts from five additional neurons sequentially exposed to muscimol and NO-711 (same as depicted in Figure 6B). Same conventions as in (D).
FIGURE 8
FIGURE 8
Spontaneous activity patterns induced by NO-711 and the GABA-mimetic muscimol. (A) Concentration–response relationships of muscimol for average firing rate (left) and proportion of time spent in bursts (right). (B) Plot of average firing rate versus burst rate for NO-711 data and muscimol data. The data were normalized to the respective control conditions. Symbols and lines correspond to means and standard deviations, respectively. (C) Peri-burst time histograms (PETHs) of median multiunit firing activity during control and 250 nM muscimol (n = 9, paired data). (D), AUROC and bootstrapped 95% confidence intervals (shown only for 250 nM) for the bin-by-bin comparison of PETHs during control and drug application. Same conventions apply as in Figures 3C,D.

Similar articles

Cited by

References

    1. Antkowiak B. (1999). Different actions of general anesthetics on the firing patterns of cortical neurons mediated by the GABAA receptor. Anesthesiology 91 500–511 10.1097/00000542-99908000-00025 - DOI - PubMed
    1. Attwell D., Barbour B, Szatkowski M. (1993). Nonvesicular release of neurotransmitter. Neuron 11 401–407 10.1016/0896-6273(93)90145-H - DOI - PubMed
    1. Bamber D. (1975). The area above the ordinal dominance graph and the area below the receiver operating characteristic graph. J. Math. Psychol. 12 387–415 10.1016/0022-2496(75)90001-2 - DOI
    1. Barberis A., Petrini E. M., Mozrzymas J. W. (2011). Impact of synaptic neurotransmitter concentration time course on the kinetics and pharmacological modulation of inhibitory synaptic currents. Front. Cell. Neurosci. 5:6 10.3389/fncel.2011.00006 - DOI - PMC - PubMed
    1. Barbour B. (2001). An evaluation of synapse independence. J. Neurosci. 20 7969–7984 - PMC - PubMed

Publication types

MeSH terms

LinkOut - more resources