. 2013 Sep 17:7:144.
doi: 10.3389/fncir.2013.00144. eCollection 2013.

Altered gamma oscillations during pregnancy through loss of δ subunit-containing GABA(A) receptors on parvalbumin interneurons

Affiliations

Altered gamma oscillations during pregnancy through loss of δ subunit-containing GABA(A) receptors on parvalbumin interneurons

Isabella Ferando et al. Front Neural Circuits. .

Abstract

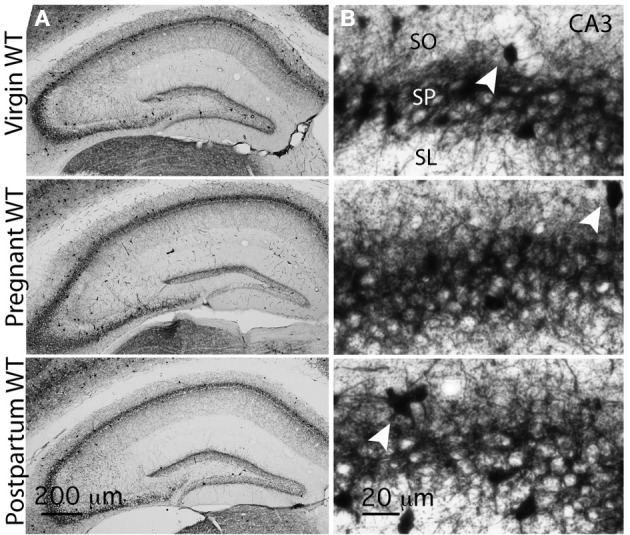
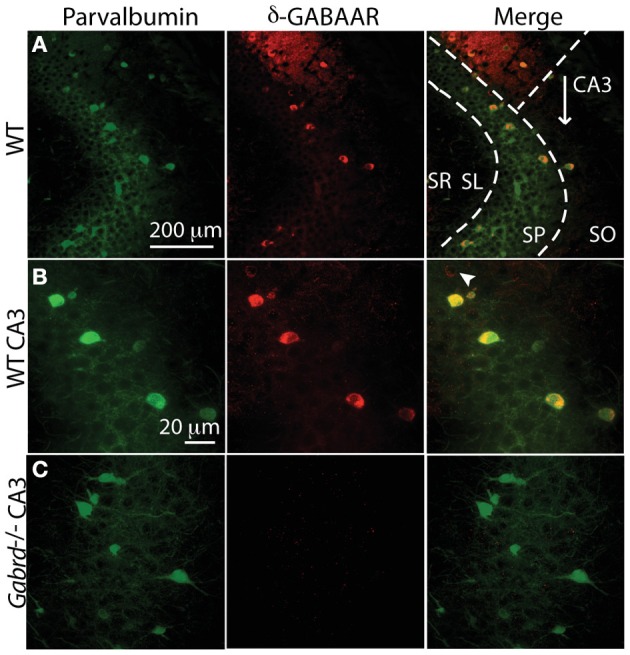
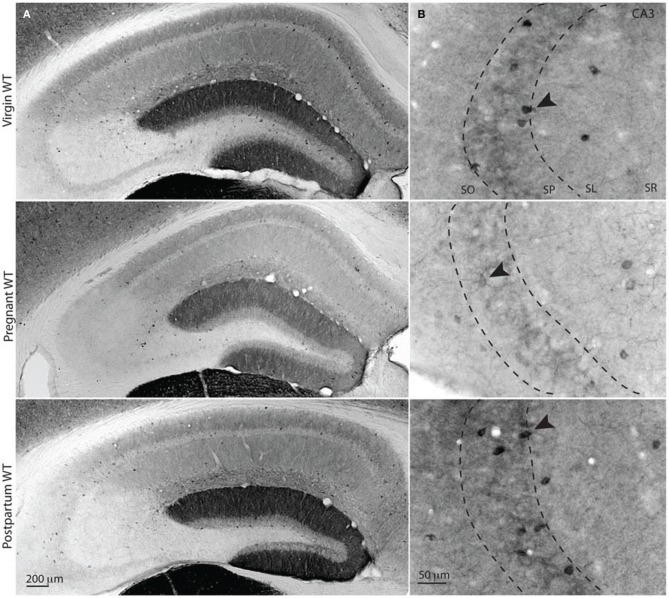
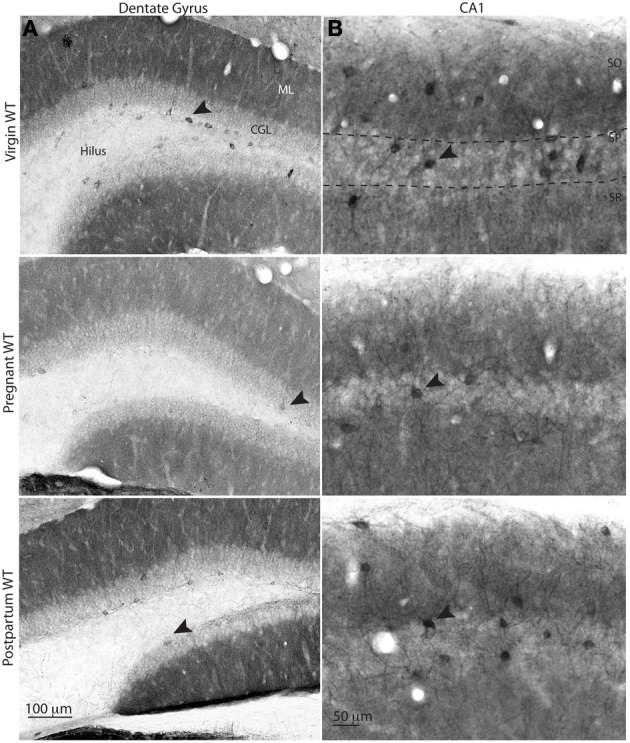
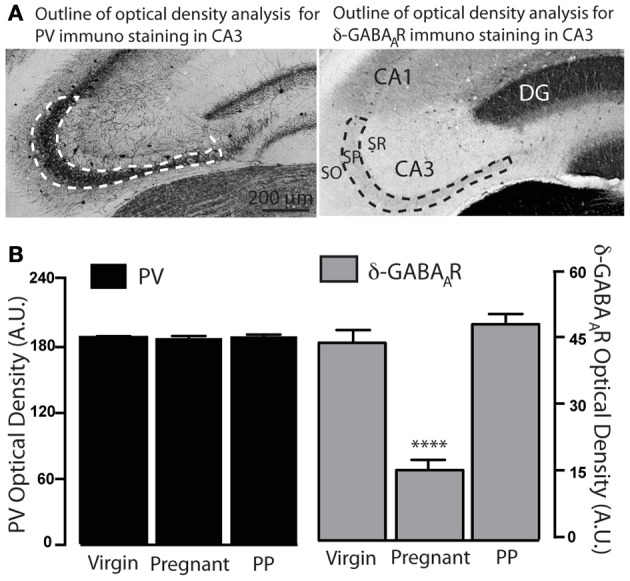
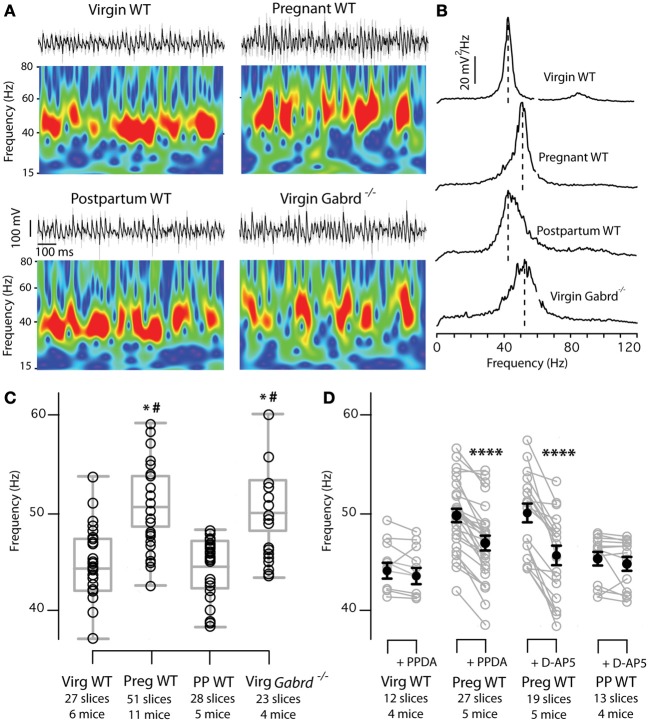
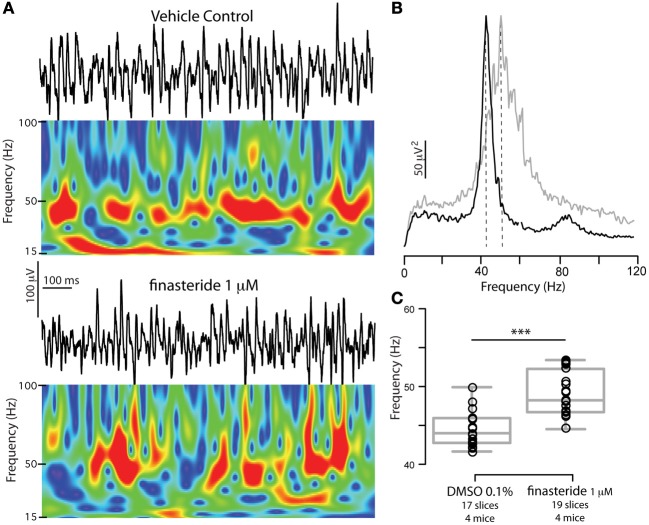
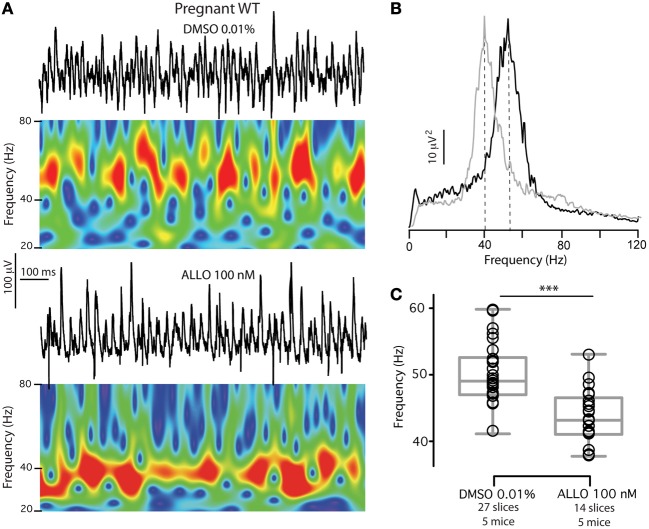
Gamma (γ) oscillations (30-120 Hz), an emergent property of neuronal networks, correlate with memory, cognition and encoding. In the hippocampal CA3 region, locally generated γ oscillations emerge through feedback between inhibitory parvalbumin-positive basket cells (PV+BCs) and the principal (pyramidal) cells. PV+BCs express δ-subunit-containing GABA(A)Rs (δ-GABA(A)Rs) and NMDA receptors (NMDA-Rs) that balance the frequency of γ oscillations. Neuroactive steroids (NS), such as the progesterone-derived (3α,5α)-3-hydroxy-pregnan-20-one (allopregnanolone; ALLO), modulate the expression of δ-GABA(A)Rs and the tonic conductance they mediate. Pregnancy produces large increases in ALLO and brain-region-specific homeostatic changes in δ-GABA(A)Rs expression. Here we show that in CA3, where most PV+ interneurons (INs) express δ-GABA(A)Rs, expression of δ-GABA(A)Rs on INs diminishes during pregnancy, but reverts to control levels within 48 h postpartum. These anatomical findings were corroborated by a pregnancy-related increase in the frequency of kainate-induced CA3 γ oscillations in vitro that could be countered by the NMDA-R antagonists D-AP5 and PPDA. Mimicking the typical hormonal conditions during pregnancy by supplementing 100 nM ALLO lowered the γ frequencies to levels found in virgin or postpartum mice. Our findings show that states of altered NS levels (e.g., pregnancy) may provoke perturbations in γ oscillatory activity through direct effects on the GABAergic system, and underscore the importance of δ-GABA(A)Rs homeostatic plasticity in maintaining constant network output despite large hormonal changes. Inaccurate coupling of NS levels to δ-GABA(A)R expression may facilitate abnormal neurological and psychiatric conditions such as epilepsy, post-partum depression, and post-partum psychosis, thus providing insights into potential new treatments.

Keywords: CA3 interneurons; GABAA receptors; delta subunit; gamma oscillations; neurosteroids; parvalbumin; pregnancy; tonic inhibition.


Figures

Figure 1
Figure 1
PV distribution remains unchanged throughout the different gestational states. (A) Representative bright-field images of whole hippocampal DAB staining for PV in virgin, pregnant and postpartum WT mice. PV+ terminals innervate CA1 and CA3 pyramidal cells and dentate gyrus granule cells, and form a plexus that wraps around their somata and proximal dendrites. (B) Representative high-magnification images of CA3 PV plexus in virgin, pregnant and postpartum WT mice. PV+IN somata are clearly visible within the stratum pyramidale (SP) and in its immediate vicinity (initial portion of stratum oriens SO and stratum lucidum SL), arrowheads. Optical density measurements in CA3 SP show no difference across gestational groups (in arbitrary units AU, mean ± SEM: virgin = 193.6 ± 0.9; pregnant = 192.9 ± 1.9; postpartum = 196.1 ± 1.7; n = 12, 10, 8 slices and n = 3 mice for each group.). One-Way ANOVA; p = 0.32, F(2, 27) = 1.175.
Figure 2
Figure 2
The majority of CA3 PV+ interneurons also express δ-GABAARs. (A,B) Immunohistochemical evidence of δ-GABAARs expression on CA3 PV interneurons in a WT mouse, by confocal microscopy. Green: PV, red: δ-GABAARs, yellow: colocalization. (A,B) PV and δ-GABAARs immunolabeling is strongest at the somata and it is clearly present and more faint in the processes around CA3 pyramidal cells. Most PV+ INs in the stratum pyramidale (SP) also co-localize δ-GABAARs; very rare interneurons are δ-GABAARs+ and PV+ (B, white arrowhead). Most CA3 PV+ and/or δ-GABAARs+ INs are concentrated around the SP, whereas they are sparser in stratum oriens (SO) stratum lucidum (SL) and stratum radiatum (SR). (C) Specificity of δ-GABAARs immunolabeling is confirmed by the lack of δ-GABAAR staining in a Gabrd−/− mouse. No significant change in PV labeling is found in Gabrd−/− mice.
Figure 3
Figure 3
Surface δ-GABAARs expression is reduced during pregnancy in CA3 stratum pyramidale interneurons. (A,B) Representative bright-field images of whole hippocampal DAB staining for δ-GABAARs in virgin, pregnant and postpartum (48 h) WT mice. Surface staining of functionally relevant receptors was obtained by processing tissues under non-permeabilizing conditions. In the hippocampus δ-GABAARs are mostly expressed on dentate gyrus granule cell dendrites (forming dentate molecular layer), many hippocampal INs, and CA1 principal cells basal and apical dendrites. (A) Surface δ-GABAARs expression is reduced in hippocampal CA1 pyramidal cells and dentate gyrus granule cells, as previously reported, and this is reflected in a lighter staining of the neuropil in CA1 and DG. (B) δ-GABAARs expression in CA3 is exclusively found in interneuron somata, dendrites (black arrowheads) and in the interneuronal processes surrounding CA3 pyramidal cells (dotted lines show the boundaries of CA3 stratum pyramidale). In pregnant animals, CA3 δ-GABAARs surface expression is reduced, as suggested by lighter staining. Optical density measurements in CA3 SP are in AU mean ± SEM: virgin = 45.2 ± 2.4; pregnant = 15.7 ± 2.3; postpartum, 48.5 ± 1.7 CA3-SP total OD of bright-field images; n = 17, 10, 16 slices and n = 3 mice for each group. One-Way ANOVA followed by Tukey's multiple comparisons test; p < 0.0001 for virgin and pregnant and for pregnant and postpartum, and p > 0.05 for virgin and postpartum, F(2, 40) = 58.95.
Figure 4
Figure 4
δ-GABAAR immunolabeling of interneurons in the dentate gyrus and area CA1 of the hippocampus at different gestational states. Representative bright-field images of δ-GABAAR staining in the dentate gyurs (A) and CA1 (B). δ-GABAAR specific immunolabeling shows decreased staining of the INs that localize in the inner part of the granule cell layer and within CA1 stratum pyramidale (arrowheads). Some δ-GABAAR labeled INs are visible in the molecular layer of the dentate gyrus in virgin and postpartum animals, whereas no labeled INs are visible in slices from pregnant animals in this area.
Figure 5
Figure 5
Semi quantitative optical density analysis of PV and δ-GABAAR immunolabeling across different gestational states. (A) Representative bright-field images of CA3 PV and δ-GABAAR-specific DAB staining. Dotted lines delimit the boundaries of the area analyzed (CA3 stratum pyramidale) for optical density measurements. (B) Optical density measurements (arbitrary units, A.U.) show a significant reduction in δ-GABAAR expression in pregnant animals. No difference is found in PV expression across gestational states. Asterisks denote significance, p < 0.0001.
Figure 6
Figure 6
γ Oscillations frequency is increased in the CA3 of pregnant animals in the absence of physiological ALLO levels. Increased CA3 γ oscillations frequency in slices of WT pregnant mice is sustained by NMDA-Rs activation on interneurons. (A) Kainate induced γ oscillations (50 nM) recorded extracellularly in CA3 stratum pyramidale at different gestational states show higher frequency in slices of WT pregnant and Gabrd−/− virgin mice compared to slices from WT virgin and postpartum mice. Upper traces: representative 1 s epochs of LFPs band-pass filtered between 15 and 120 Hz (black) and raw traces (gray). Morlet wavelet transforms of the corresponding traces show γ oscillatory behavior. Warmer colors represent higher power, and the same scale has been used for all four wavelets. (B) Plots of power spectral density calculated over 180 s periods of the same recordings as in (A). Note increased γ frequency in slices from pregnant and Gabrd−/− mice. No differences are found in power at peak frequency or total power (30–120 Hz) (C), Box plots showing peak frequencies for the four experimental groups. Each dot symbolizes the peak frequency of one slice calculated as the frequency with the highest power in a 180 s period power spectral density as in (B). Box plots represent mean, 25th and 75th percentile, and largest and smallest values. Significance established by One-Way ANOVA followed by Turkey's multiple comparisons test. *p < 0.0001 between WT pregnant and WT virgin or WT postpartum respectively. #p < 0.0001 between Gabrd−/− virgin and WT virgin or WT postpartum respectively. (D) In slices of WT pregnant mice bath application of the NMDA-R subunit-unspecific antagonists D-AP5 (25 μ M) or GluN2D-containing NMDA-Rs specific antagonist PPDA (1μ M) decreases γ oscillations frequency to WT virgin and WT postpartum (PP) values. The same drugs have no effect on γ frequencies of slices of WT virgin or WT postpartum mice. Mean frequency ± SEM in Hz, significance established by two-tailed paired t-test: pregnant PPDA = 49.7 ± 0.7 to 46.9 ± 0.7, p < 0.0001, n = 27 slices, 5 mice; virgin PPDA = 44.0 ± 0.8 to 43.5 ± 0.9 p = 0.1, n = 12 slices, 4 mice; pregnant D-AP5 = 49.8 ± 0.96 to 45.6 ± 1.0 p < 0.0001, n = 19 slices, 5 mice; postpartum D-AP5 = 45. 5 ± 0.68 to 45.1 ± 0.68 p = 0.2, n = 13 slices, 4 mice. Asterisks denote significance. n's for each group are reported in the figure.
Figure 7
Figure 7
Blocking neurosteroidogenesis increases γ oscillations frequency in slices from WT mice. (A) Representative 1 s epoch of local field potential oscillations and corresponding Morlet Wavelets in the CA3 region of hippocampal slices obtained from a WT adult male mouse in vehicle (DMSO 0.01%) or in 1 μ M finasteride (after 30 min incubation). (B) Power spectral densities of the same recordings (average of 180 s) for DMSO 0.01% (black) and finasteride (gray). (C) Peak frequencies of γ oscillations recorded in either vehicle or 1 μ M finasteride. The latter have significantly higher peak frequencies. Box plots represent mean, 25th and 75th percentile, and largest and smallest values. Mean peak frequency ± SEM in Hz: DMSO 0.01% = 44.5 ± 0.5, finasteride = 49.1 ± 0.6 p < 0.0001, two-tailed unpaired t-test. Asterisks denote significance (p < 0.05). No differences were found in power at peak frequency, p = 0.5, and total power (30–120 Hz), p = 1. n's for each group are reported in the figure.
Figure 8
Figure 8
Exposure to ALLO levels found in pregnancy (100 nM) reverts CA3 γ oscillations frequency in pregnant mice to control values. (A) Representative 1 s epoch of local field potential oscillations and corresponding Morlet wavelet transforms of 1 s epochs of local field potentials recorded in the presence of 50 nM kainate depict γ oscillatory behavior over time. Slices from the same pregnant WT animal were incubated and recorded in either vehicle (DMSO 0.01%) or ALLO 100 nM. Slices incubated in vehicle show significantly higher γ oscillations frequency compared to slices incubated in ALLO. (B) Power spectral densities of the same recordings (average of 180 s) for DMSO 0.01% (black) and ALLO (gray). (C) Box plots summarizing peak frequencies of the two experimental groups and representing mean, 25th and 75th percentile, and largest and smallest values. n's for each group are reported in the figure. Significance established by two-tailed unpaired t-test, p < 0.0001.

Similar articles

Cited by

References

    1. Akam T., Oren I., Mantoan L., Ferenczi E., Kullmann D. M. (2012). Oscillatory dynamics in the hippocampus support dentate gyrus-CA3 coupling. Nat. Neurosci. 15, 763–768 10.1038/nn.3081 - DOI - PMC - PubMed
    1. Baude A., Bleasdale C., Dalezios Y., Somogyi P., Klausberger T. (2006). Immunoreactivity for the GABAA receptor alpha1 subunit, somatostatin and Connexin36 distinguishes axoaxonic, basket, and bistratified interneurons of the rat hippocampus. Cereb. Cortex 17, 2094–2107 10.1093/cercor/bhl117 - DOI - PubMed
    1. Belelli D., Lambert J. J. (2005). Neurosteroids: endogenous regulators of the GABA(A) receptor. Nat. Rev. Neurosci. 6, 565–575 10.1038/nrn1703 - DOI - PubMed
    1. Bianchi M. T., Macdonald R. L. (2003). Neurosteroids shift partial agonist activation of GABA(A) receptor channels from low- to high-efficacy gating patterns. J. Neurosci. 23, 10934–10943 - PMC - PubMed
    1. Bragin A., Jando G., Nadasdy Z., Hetke J., Wise K., Buzsaki G. (1995). Gamma (40–100 Hz) oscillation in the hippocampus of the behaving rat. J. Neurosci. 15, 47–60 - PMC - PubMed

LinkOut - more resources