

Shaping the aging brain: role of auditory input patterns in the emergence of auditory cortical impairments
- PMID: 24062649
- PMCID: PMC3775538
- DOI: 10.3389/fnsys.2013.00052
Shaping the aging brain: role of auditory input patterns in the emergence of auditory cortical impairments
Abstract
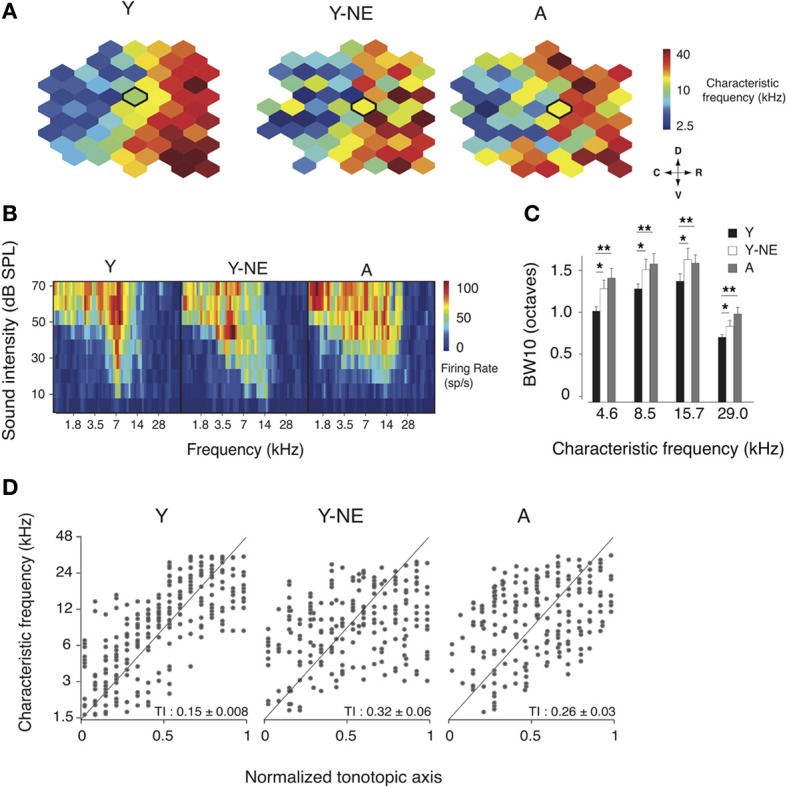
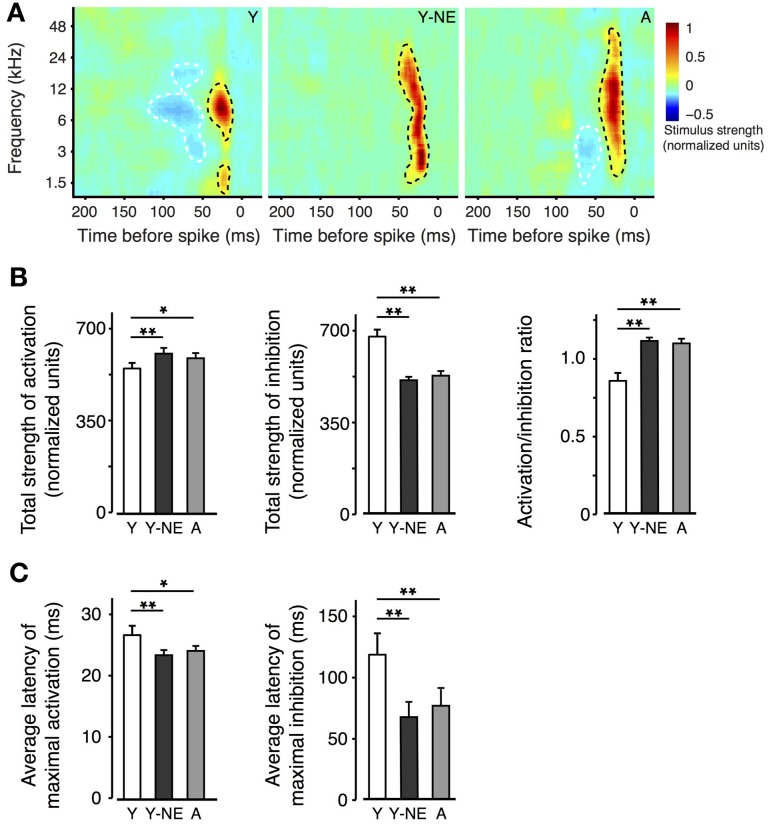
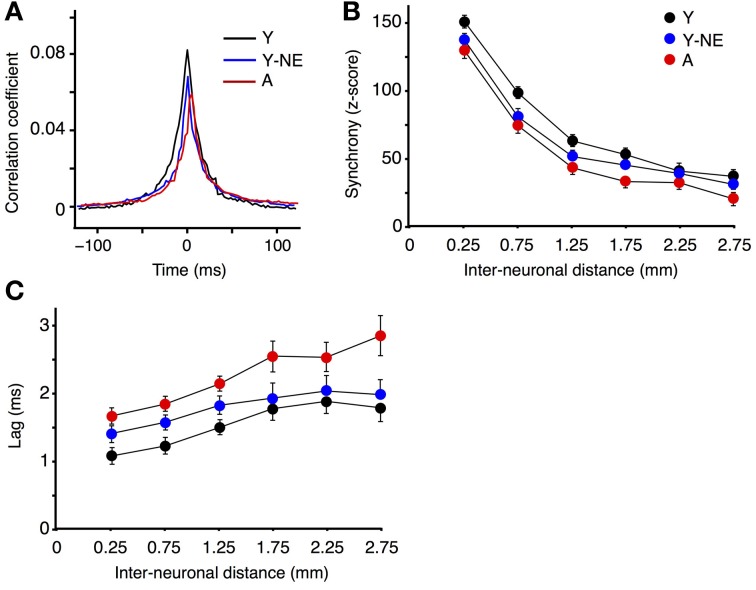
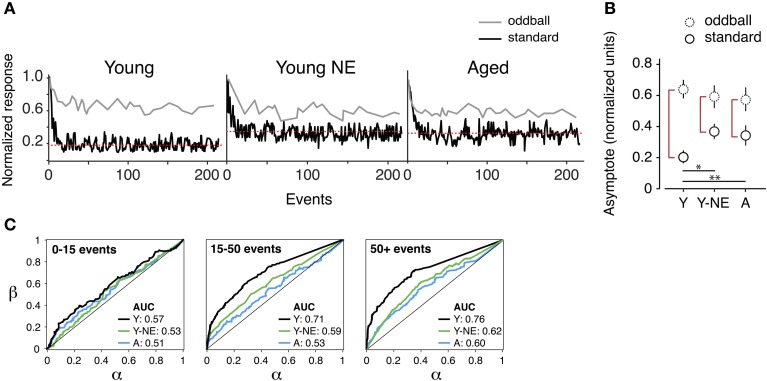
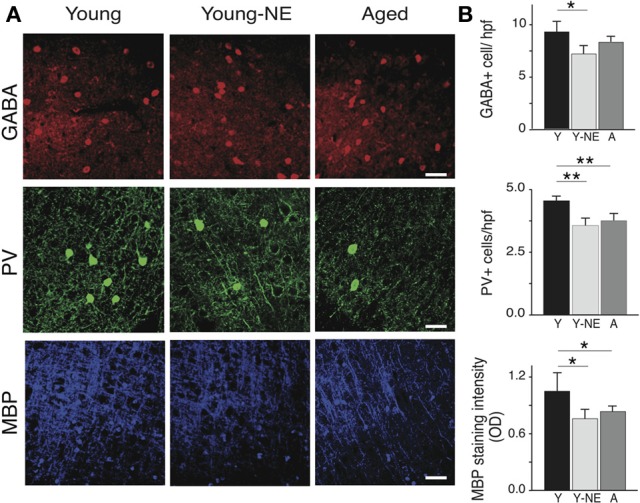
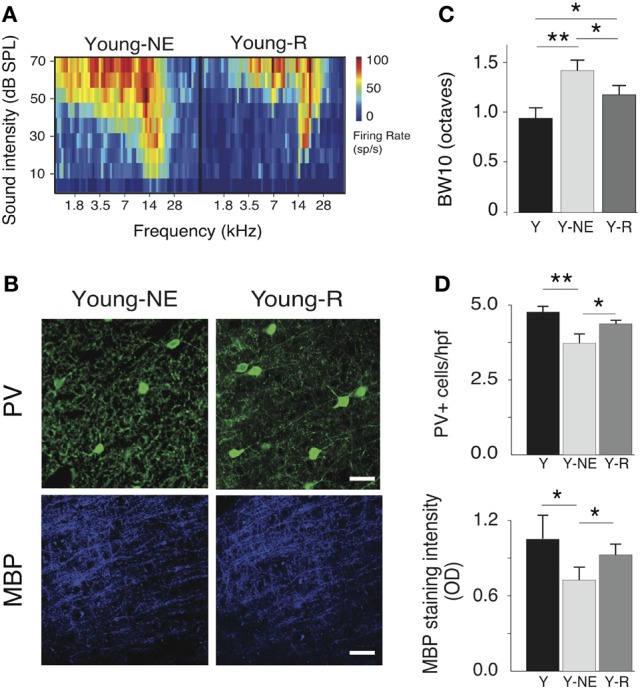
Age-related impairments in the primary auditory cortex (A1) include poor tuning selectivity, neural desynchronization, and degraded responses to low-probability sounds. These changes have been largely attributed to reduced inhibition in the aged brain, and are thought to contribute to substantial hearing impairment in both humans and animals. Since many of these changes can be partially reversed with auditory training, it has been speculated that they might not be purely degenerative, but might rather represent negative plastic adjustments to noisy or distorted auditory signals reaching the brain. To test this hypothesis, we examined the impact of exposing young adult rats to 8 weeks of low-grade broadband noise on several aspects of A1 function and structure. We then characterized the same A1 elements in aging rats for comparison. We found that the impact of noise exposure on A1 tuning selectivity, temporal processing of auditory signal and responses to oddball tones was almost indistinguishable from the effect of natural aging. Moreover, noise exposure resulted in a reduction in the population of parvalbumin inhibitory interneurons and cortical myelin as previously documented in the aged group. Most of these changes reversed after returning the rats to a quiet environment. These results support the hypothesis that age-related changes in A1 have a strong activity-dependent component and indicate that the presence or absence of clear auditory input patterns might be a key factor in sustaining adult A1 function.
Keywords: A1; GABA; aging; auditory; inhibition; noise; parvalbumin; plasticity.
Figures
Similar articles
-
Effects of noise-induced hearing loss on parvalbumin and perineuronal net expression in the mouse primary auditory cortex.Hear Res. 2017 Jul;350:82-90. doi: 10.1016/j.heares.2017.04.015. Epub 2017 Apr 27. Hear Res. 2017. PMID: 28460252
-
Effects of developmental noise exposure on inhibitory cell densities and perineuronal nets in A1 and AAF of mice.Hear Res. 2019 Sep 15;381:107781. doi: 10.1016/j.heares.2019.107781. Epub 2019 Aug 8. Hear Res. 2019. PMID: 31425896
-
A Brain without Brakes: Reduced Inhibition Is Associated with Enhanced but Dysregulated Plasticity in the Aged Rat Auditory Cortex.eNeuro. 2018 Sep 5;5(4):ENEURO.0051-18.2018. doi: 10.1523/ENEURO.0051-18.2018. eCollection 2018 Jul-Aug. eNeuro. 2018. PMID: 30225357 Free PMC article.
-
Temporal selectivity declines in the aging human auditory cortex.Elife. 2020 Jul 3;9:e55300. doi: 10.7554/eLife.55300. Elife. 2020. PMID: 32618270 Free PMC article.
-
Lifelong plasticity in the rat auditory cortex: basic mechanisms and role of sensory experience.Prog Brain Res. 2011;191:119-31. doi: 10.1016/B978-0-444-53752-2.00009-6. Prog Brain Res. 2011. PMID: 21741548 Review.
Cited by
-
Age-related neural dedifferentiation and cognition.Curr Opin Behav Sci. 2020 Apr;32:7-14. doi: 10.1016/j.cobeha.2020.01.006. Epub 2020 Feb 3. Curr Opin Behav Sci. 2020. PMID: 32095492 Free PMC article.
-
The Neural Consequences of Age-Related Hearing Loss.Trends Neurosci. 2016 Jul;39(7):486-497. doi: 10.1016/j.tins.2016.05.001. Epub 2016 Jun 1. Trends Neurosci. 2016. PMID: 27262177 Free PMC article. Review.
-
Regulation of auditory plasticity during critical periods and following hearing loss.Hear Res. 2020 Nov;397:107976. doi: 10.1016/j.heares.2020.107976. Epub 2020 Apr 20. Hear Res. 2020. PMID: 32591097 Free PMC article. Review.
-
Modifying the Adult Rat Tonotopic Map with Sound Exposure Produces Frequency Discrimination Deficits That Are Recovered with Training.J Neurosci. 2020 Mar 11;40(11):2259-2268. doi: 10.1523/JNEUROSCI.1445-19.2019. Epub 2020 Feb 5. J Neurosci. 2020. PMID: 32024780 Free PMC article.
-
Brain plasticity-based therapeutics.Front Hum Neurosci. 2014 Jun 27;8:385. doi: 10.3389/fnhum.2014.00385. eCollection 2014. Front Hum Neurosci. 2014. PMID: 25018719 Free PMC article. Review.
References
LinkOut - more resources
Full Text Sources
Other Literature Sources