

MEG studies of motor cortex gamma oscillations: evidence for a gamma "fingerprint" in the brain?
- PMID: 24062675
- PMCID: PMC3774986
- DOI: 10.3389/fnhum.2013.00575
MEG studies of motor cortex gamma oscillations: evidence for a gamma "fingerprint" in the brain?
Abstract
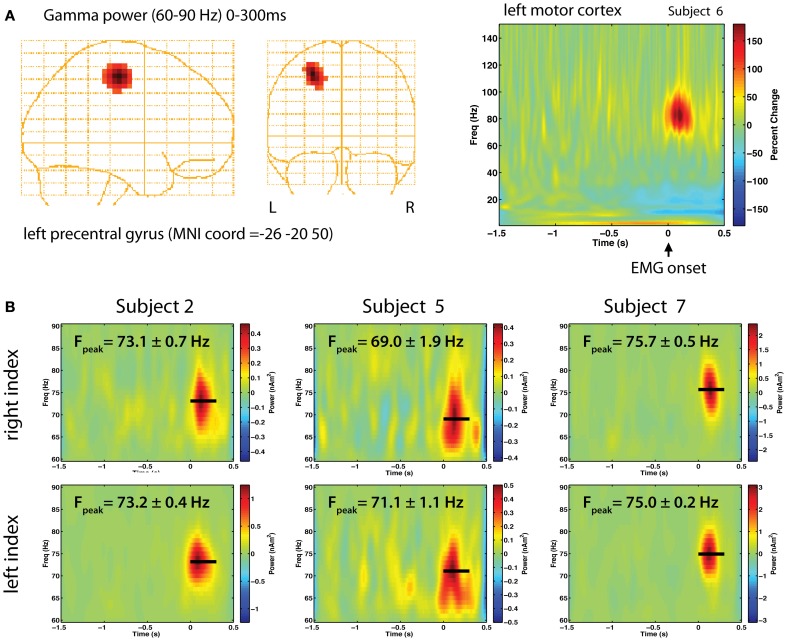
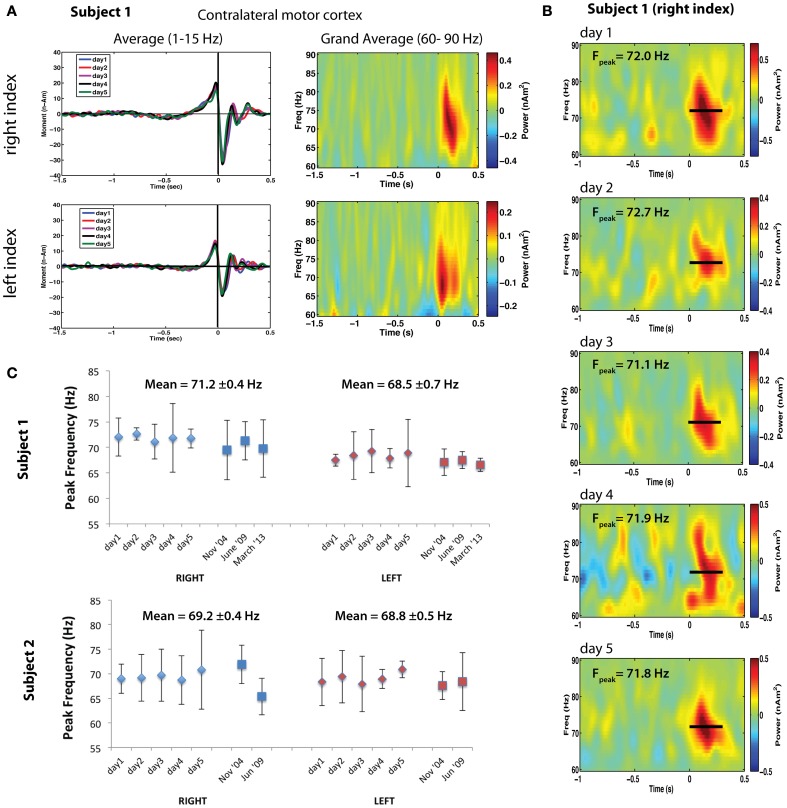
The human motor cortex exhibits transient bursts of high frequency gamma oscillations in the 60-90 Hz range during movement. It has been proposed that gamma oscillations generally reflect local intracortical activity. However, movement-evoked gamma is observed simultaneously in both cortical and subcortical (basal ganglia) structures and thus appears to reflect long-range cortical-subcortical interactions. Recent evidence suggests that gamma oscillations do not simply reflect sensory reafference, but have a facilitative role in movement initiation. Here we summarize contributions of MEG to our understanding of movement-evoked gamma oscillations, including evidence that transient gamma bursts during the performance of specific movements constitutes a stereotyped spectral and temporal pattern within individuals-a gamma "fingerprint"-that is highly stable over time. Although their functional significance remains to be fully understood, movement-evoked gamma oscillations may represent frequency specific tuning within cortical-subcortical networks that can be monitored non-invasively using MEG during a variety of motor tasks, and may provide important information regarding cortical dynamics of ongoing motor control.
Keywords: MEG; basal ganglia; frequency tuning; gamma oscillations; motor cortex.
Figures
Similar articles
-
Self-paced movements induce high-frequency gamma oscillations in primary motor cortex.Neuroimage. 2008 Aug 1;42(1):332-42. doi: 10.1016/j.neuroimage.2008.04.178. Epub 2008 Apr 23. Neuroimage. 2008. PMID: 18511304
-
Relating MEG measured motor cortical oscillations to resting γ-aminobutyric acid (GABA) concentration.Neuroimage. 2011 Mar 15;55(2):616-21. doi: 10.1016/j.neuroimage.2010.12.077. Epub 2011 Jan 6. Neuroimage. 2011. PMID: 21215806 Free PMC article.
-
Human cortical high-gamma power scales with movement rate in healthy participants and stroke survivors.J Physiol. 2025 Feb;603(4):873-893. doi: 10.1113/JP286873. Epub 2025 Jan 9. J Physiol. 2025. PMID: 39786979 Free PMC article.
-
Motor Cortical Gamma Oscillations: What Have We Learnt and Where Are We Headed?Curr Behav Neurosci Rep. 2018;5(2):136-142. doi: 10.1007/s40473-018-0151-z. Epub 2018 Apr 27. Curr Behav Neurosci Rep. 2018. PMID: 29862162 Free PMC article. Review.
-
Integrated technology for evaluation of brain function and neural plasticity.Phys Med Rehabil Clin N Am. 2004 Feb;15(1):263-306. doi: 10.1016/s1047-9651(03)00124-4. Phys Med Rehabil Clin N Am. 2004. PMID: 15029909 Review.
Cited by
-
Neural interactions in the human frontal cortex dissociate reward and punishment learning.Elife. 2024 Jun 28;12:RP92938. doi: 10.7554/eLife.92938. Elife. 2024. PMID: 38941238 Free PMC article.
-
Circuit Mechanisms of L-DOPA-Induced Dyskinesia (LID).Front Neurosci. 2021 Mar 10;15:614412. doi: 10.3389/fnins.2021.614412. eCollection 2021. Front Neurosci. 2021. PMID: 33776634 Free PMC article. Review.
-
Normalizing the brain connectome for communication through synchronization.Netw Neurosci. 2022 Jul 1;6(3):722-744. doi: 10.1162/netn_a_00231. eCollection 2022 Jul. Netw Neurosci. 2022. PMID: 36607179 Free PMC article.
-
Movement-related neuromagnetic fields in preschool age children.Hum Brain Mapp. 2014 Sep;35(9):4858-75. doi: 10.1002/hbm.22518. Epub 2014 Apr 3. Hum Brain Mapp. 2014. PMID: 24700413 Free PMC article.
-
Characterization of Cortical Networks and Corticocortical Functional Connectivity Mediating Arbitrary Visuomotor Mapping.J Neurosci. 2015 Sep 16;35(37):12643-58. doi: 10.1523/JNEUROSCI.4892-14.2015. J Neurosci. 2015. PMID: 26377456 Free PMC article.
References
-
- Alegre M., Alonso-Frech F., Rodriguez-Oroz M. C., Guridi J., Zamarbide I., Valencia M., et al. (2005). Movement-related changes in oscillatory activity in the human subthalamic nucleus: ipsilateral vs. contralateral movements. Eur. J. Neurosci. 22, 2315–2324 10.1111/j.1460-9568.2005.04409.x - DOI - PubMed
LinkOut - more resources
Full Text Sources
Other Literature Sources