

A new mathematical approach for qualitative modeling of the insulin-TOR-MAPK network
- PMID: 24062690
- PMCID: PMC3771213
- DOI: 10.3389/fphys.2013.00245
A new mathematical approach for qualitative modeling of the insulin-TOR-MAPK network
Abstract
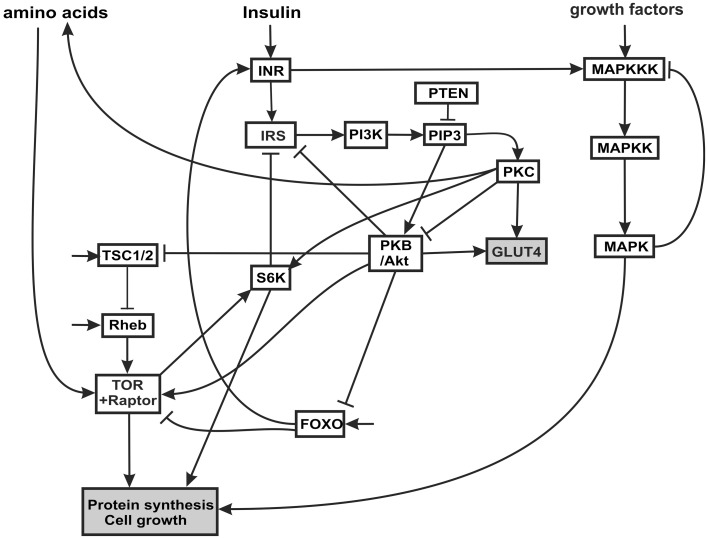
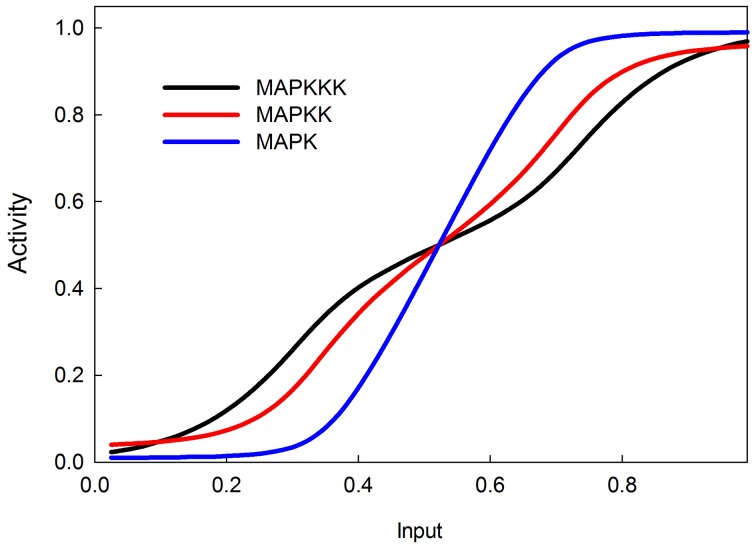
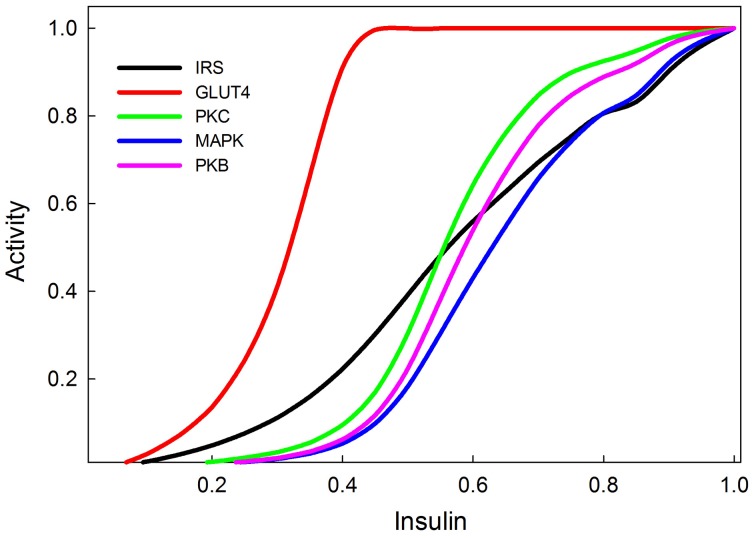
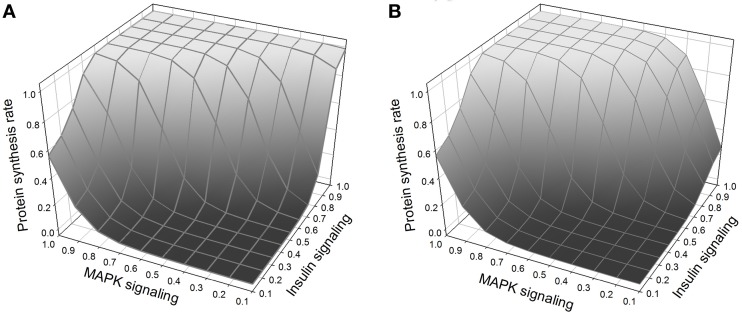
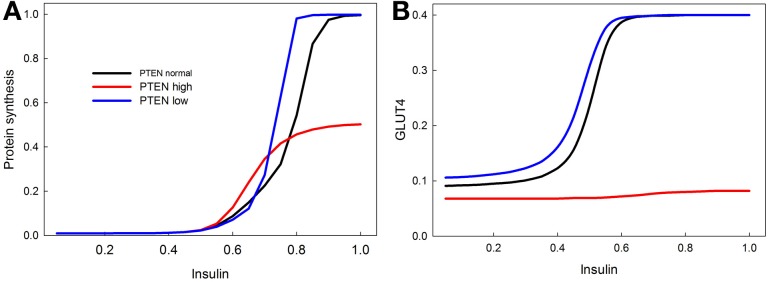
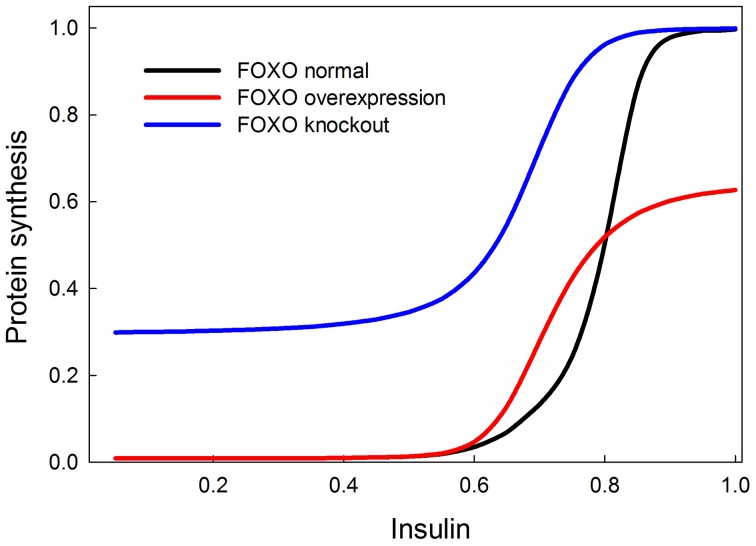
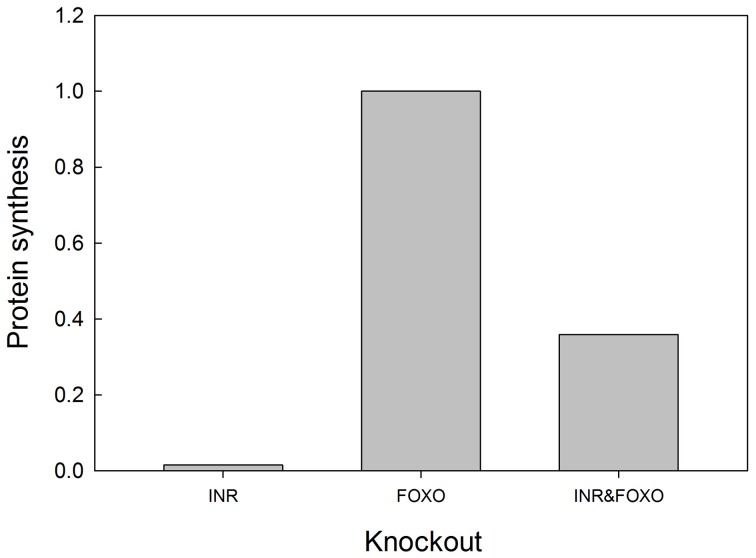
In this paper we develop a novel mathematical model of the insulin-TOR-MAPK signaling network that controls growth. Most data on the properties of the insulin and MAPK signaling networks are static and the responses to experimental interventions, such as knockouts, overexpression, and hormonal input are typically reported as scaled quantities. The modeling paradigm we develop here uses scaled variables and is ideally suited to simulate systems in which much of the available data are scaled. Our mathematical representation of signaling networks provides a way to reconcile theory and experiments, thus leading to a better understanding of the properties and function of these signaling networks. We test the performance of the model against a broad diversity of experimental data. The model correctly reproduces experimental insulin dose-response relationships. We study the interaction between insulin and MAPK signaling in the control of protein synthesis, and the interactions between amino acids, insulin and TOR signaling. We study the effects of variation in FOXO expression on protein synthesis and glucose transport capacity, and show that a FOXO knockout can partially rescue protein synthesis capacity of an insulin receptor (INR) knockout. We conclude that the modeling paradigm we develop provides a simple tool to investigate the qualitative properties of signaling networks.
Keywords: FOXO; MAPK; TOR; growth; insulin; mathematical model; sigmoid.
Figures
Similar articles
-
Cricket body size is altered by systemic RNAi against insulin signaling components and epidermal growth factor receptor.Dev Growth Differ. 2011 Sep;53(7):857-69. doi: 10.1111/j.1440-169X.2011.01291.x. Epub 2011 Jul 21. Dev Growth Differ. 2011. PMID: 21777227
-
Spargel/dPGC-1 is a new downstream effector in the insulin-TOR signaling pathway in Drosophila.Genetics. 2013 Oct;195(2):433-41. doi: 10.1534/genetics.113.154583. Epub 2013 Aug 9. Genetics. 2013. PMID: 23934892 Free PMC article.
-
Dynamic Modeling and Analysis of the Cross-Talk between Insulin/AKT and MAPK/ERK Signaling Pathways.PLoS One. 2016 Mar 1;11(3):e0149684. doi: 10.1371/journal.pone.0149684. eCollection 2016. PLoS One. 2016. PMID: 26930065 Free PMC article.
-
Insulin/TOR signaling in growth and homeostasis: a view from the fly world.Int J Biochem Cell Biol. 2009 May;41(5):1006-10. doi: 10.1016/j.biocel.2008.10.010. Epub 2008 Oct 18. Int J Biochem Cell Biol. 2009. PMID: 18992839 Review.
-
Insulin and amino-acid regulation of mTOR signaling and kinase activity through the Rheb GTPase.Oncogene. 2006 Oct 16;25(48):6361-72. doi: 10.1038/sj.onc.1209882. Oncogene. 2006. PMID: 17041622 Review.
Cited by
-
How Can Malnutrition Affect Autophagy in Chronic Heart Failure? Focus and Perspectives.Int J Mol Sci. 2021 Mar 24;22(7):3332. doi: 10.3390/ijms22073332. Int J Mol Sci. 2021. PMID: 33805128 Free PMC article. Review.
-
The roles of growth regulation and appendage patterning genes in the morphogenesis of treehopper pronota.Proc Biol Sci. 2022 Jun 8;289(1976):20212682. doi: 10.1098/rspb.2021.2682. Epub 2022 Jun 8. Proc Biol Sci. 2022. PMID: 35673859 Free PMC article.
-
A single mechanism can explain network-wide insulin resistance in adipocytes from obese patients with type 2 diabetes.J Biol Chem. 2014 Nov 28;289(48):33215-30. doi: 10.1074/jbc.M114.608927. Epub 2014 Oct 15. J Biol Chem. 2014. PMID: 25320095 Free PMC article. Clinical Trial.
-
The coming of age of insulin-signaling in insects.Front Physiol. 2014 Jun 10;5:216. doi: 10.3389/fphys.2014.00216. eCollection 2014. Front Physiol. 2014. PMID: 24959150 Free PMC article. No abstract available.
-
Insulin-like Peptides of the Western Flower Thrips Frankliniella occidentalis and Their Mediation of Immature Development.Insects. 2023 Jan 3;14(1):47. doi: 10.3390/insects14010047. Insects. 2023. PMID: 36661977 Free PMC article.
References
-
- Alon U. (2006). An Introduction to Systems Biology: Design Principles of Biological Circuits. New York, NY: Chapman and Hall
-
- Aoyama H., Daitoku H., Fukamizu A. (2006). Nutrient control of phosphorylation and translocation of Foxo1 in C57BL/6 and db/db mice. Int. J. Mol. Med. 18, 433–439 - PubMed
LinkOut - more resources
Full Text Sources
Other Literature Sources