. 2013 Sep 17:4:104.
doi: 10.3389/fpsyt.2013.00104. eCollection 2013.

The Role of Genetic Sex in Affect Regulation and Expression of GABA-Related Genes Across Species

Affiliations

The Role of Genetic Sex in Affect Regulation and Expression of GABA-Related Genes Across Species

Marianne L Seney et al. Front Psychiatry. .

Abstract

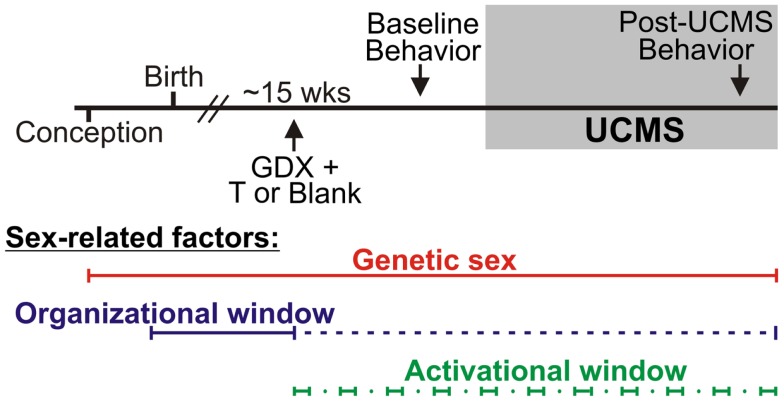
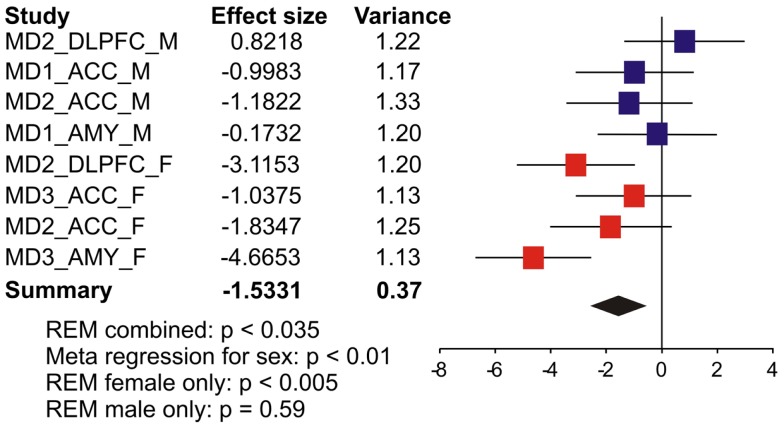
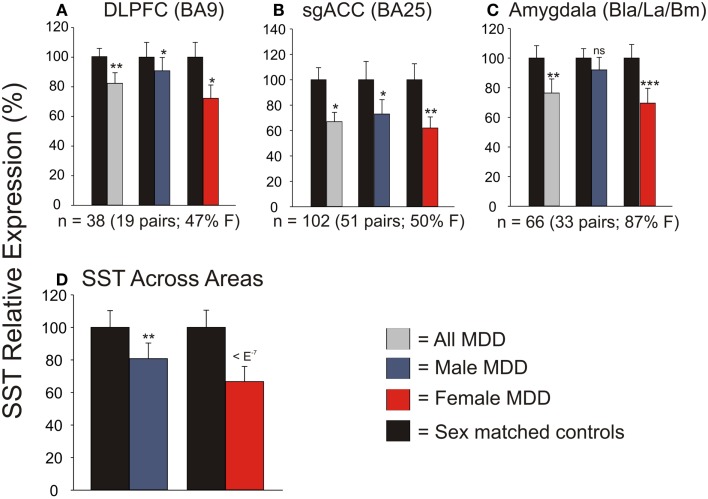
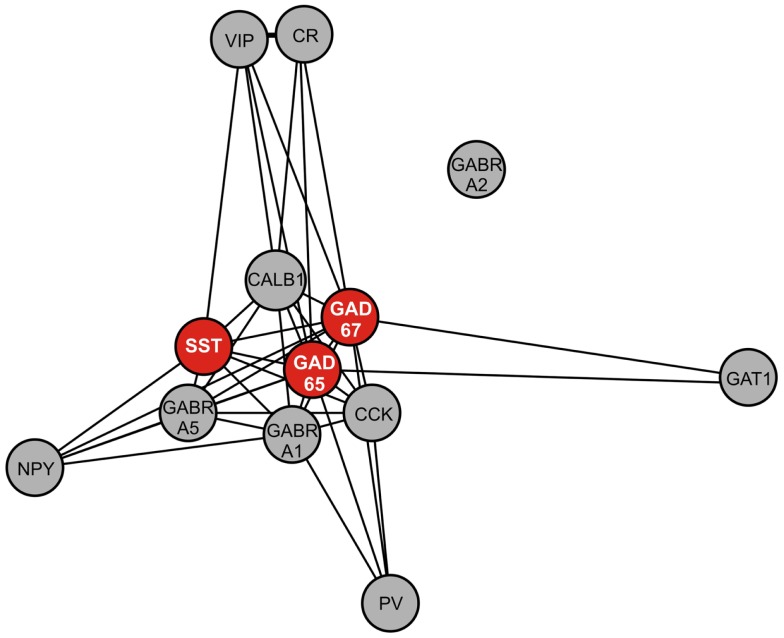
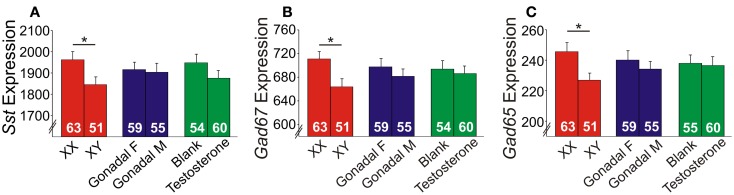
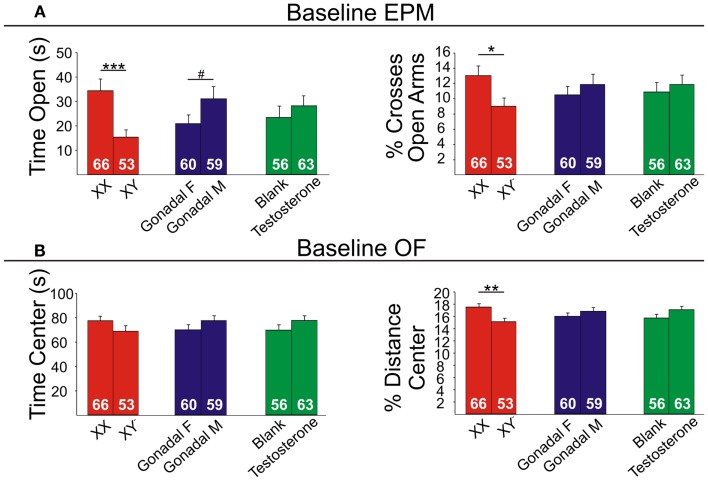
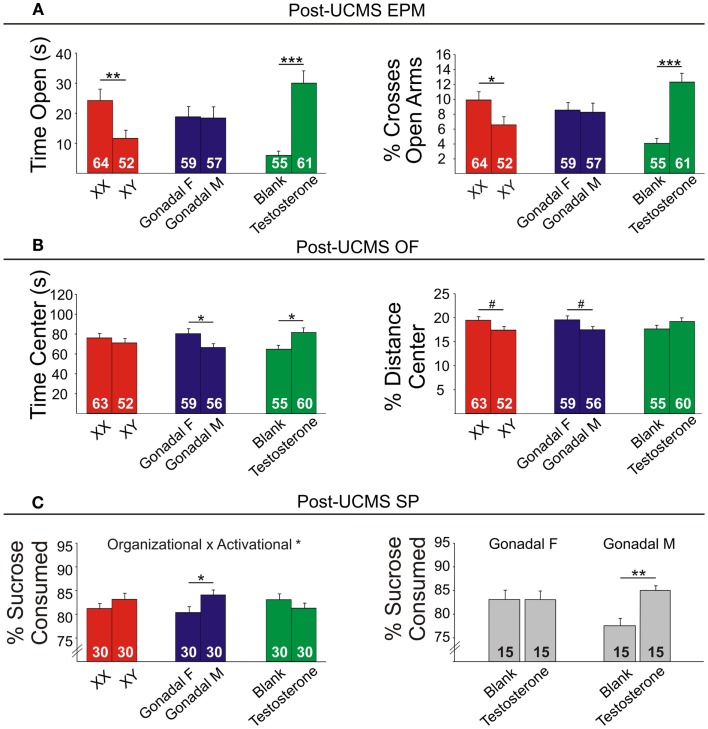
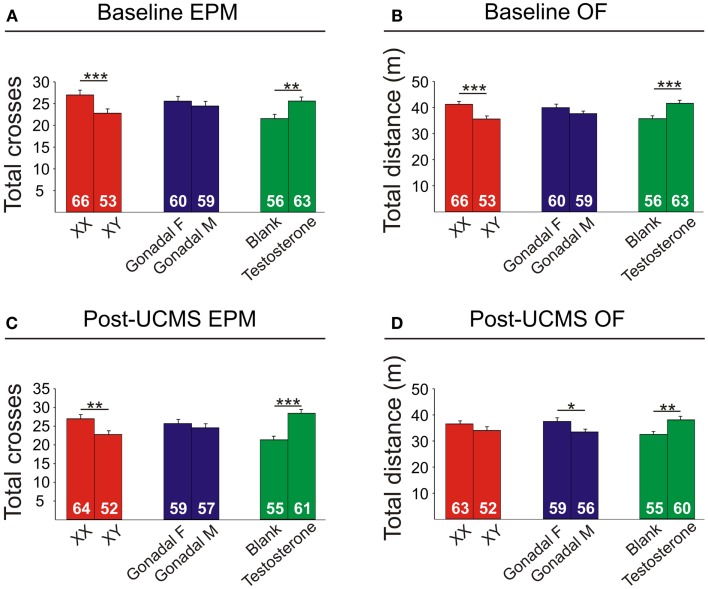
Although circulating hormones and inhibitory gamma-aminobutyric acid (GABA)-related factors are known to affect mood, considerable knowledge gaps persist for biological mechanisms underlying the female bias in mood disorders. Here, we combine human and mouse studies to investigate sexual dimorphism in the GABA system in the context of major depressive disorder (MDD) and then use a genetic model to dissect the role of sex-related factors in GABA-related gene expression and anxiety-/depressive-like behaviors in mice. First, using meta-analysis of gene array data in human postmortem brain (N = 51 MDD subjects, 50 controls), we show that the previously reported down-regulation in MDD of somatostatin (SST), a marker of a GABA neuron subtype, is significantly greater in women with MDD. Second, using gene co-expression network analysis in control human subjects (N = 214; two frontal cortex regions) and expression quantitative trait loci mapping (N = 170 subjects), we show that expression of SST and the GABA-synthesizing enzymes glutamate decarboxylase 67 (GAD67) and GAD65 are tightly co-regulated and influenced by X-chromosome genetic polymorphisms. Third, using a rodent genetic model [Four Core Genotypes (FCG) mice], in which genetic and gonadal sex are artificially dissociated (N ≥ 12/group), we show that genetic sex (i.e., X/Y-chromosome) influences both gene expression (lower Sst, Gad67, Gad65 in XY mice) and anxiety-like behaviors (higher in XY mice). This suggests that in an intact male animal, the observed behavior represents the outcomes of male genetic sex increasing and male-like testosterone decreasing anxiety-like behaviors. Gonadal sex was the only factor influencing depressive-like behavior (gonadal males < gonadal females). Collectively, these combined human and mouse studies provide mechanistic insight into sexual dimorphism in mood disorders, and specifically demonstrate an unexpected role of male-like factors (XY genetic sex) on GABA-related genes and anxiety-like behaviors.

Keywords: GABA; anxiety; depression; genetic sex; mood; somatostatin.


Figures

Figure 1
Figure 1
Experimental design and sex-related factors. FCG mice were gonadectomized (GDX) at approximately 15 weeks old and implanted with either testosterone (T)-filled or blank capsules. After allowing 3 weeks for animals to recover from surgery, all mice were exposed to behavioral tests to assess baseline (“non-stress”) anxiety-like behavior and activity. Mice were then exposed to 7 weeks of unpredictable chronic mild stress (UCMS). During weeks 6 and 7 of UCMS, mice were exposed to behavioral tests to assess chronic stress-induced anxiety-like and anhedonia-/depressive-like behavior and activity. Sex-related factors are shown at the bottom to indicate windows of time in which genetic sex, gonadal sex, and/or circulating hormones can act.
Figure 2
Figure 2
Somatostatin (SST) expression is more robustly down-regulated in women with MDD. Results from eight microarray studies [MDD subjects (N = 52) versus controls (N = 51)] were combined by meta-analysis. Two studies were performed in dorsolateral prefrontal cortex (DLPFC), four in anterior cingulate cortex (ACC), and two in amygdala (AMY). Half of the studies were performed in female subjects in each region. X-axis indicates effect of MDD. The left-hand columns list the names of the studies and the effect size values. The summary effect of each study is depicted as a point estimate (mean effect size) bounded by its 95% confidence interval (±1.96 standard deviation), represented by horizontal lines. The summarized effect is plotted as a diamond, which is shown on the bottom line with the associated REM p-value. The lack of overlap with the vertical no-effect line (effect size = 0) for the summarized diamond indicates statistical significance of the meta-analysis.
Figure 3
Figure 3
qPCR validation of microarray meta-analysis. Individual qPCR results in the dorsolateral prefrontal cortex (DLPFC) (A), subgenual anterior cingulate cortex (B), and amygdala (C). (D) When individual qPCR results are combined by meta-analysis, females have a much more robust down-regulation of SST expression than males. *p < 0.05; **p < 0.01; ***p < 0.001; ns, not significant.
Figure 4
Figure 4
Weighted gene co-expression network of GABA-signaling-related genes. Genes included in this network are GABA interneuron markers [somatostatin (SST), parvalbumin (PV), neuropeptide Y (NPY), calretinin (CR), calbindin (CALB1), vasoactive intestinal peptide (VIP), cholecystokinin (CCK)], GABA A receptor subunits (alpha 1 (GABRA1), alpha 2 (GABRA2), alpha 5 (GABRA5), and GABA-related genes [GAD67, GAD65, GABA transporter 1 (GAT1)]. Nearness of nodes is proportional to co-expression strength. Along with SST, GAD67, and GAD65, genes in the core module include CALB1, which is often co-localized with SST, and GABRA5, which is postsynaptic to SST-positive GABA neurons.
Figure 5
Figure 5
Expression of GABA-related genes in the frontal cortex of FCG mice. XY mice had lower (A) Sst, (B) Gad67, and (C) Gad65 expression levels compared to XX mice. Error bars indicated mean ± SEM. *p < 0.05. Y-axis, truncated arbitrary expression units.
Figure 6
Figure 6
Baseline emotionality measures in FCG mice. (A) Baseline elevated plus maze (EPM) results for time (left) and percent crosses (right) into open arms. (B) Baseline open Field (OF) results for time (left) and percent distance (right) in the center. Numbers at the base of bars indicate group sizes. Error bars indicated mean ± SEM. ***p < 0.001, **p < 0.01; *p < 0.05; #p < 0.1.
Figure 7
Figure 7
Post-UCMS emotionality measures in FCG mice. (A) Post-UCMS elevated plus maze (EPM) results for time (left) and percent crosses (right) into open arms. (B) Post-UCMS open Field (OF) results for time (left) and percent distance (right) in the center. (C) Post-UCMS sucrose preference (SP) results for percent sucrose consumed for all groups (left) and for the organizational × activational interaction (right). Numbers at the base of bars indicate group sizes. Error bars indicate mean ± SEM. ***p < 0.001, **p < 0.01; *p < 0.05; #p < 0.1.
Figure 8
Figure 8
Locomotor activity measures in FCG mice. Elevated plus maze (EPM) results for total crosses at baseline (A) and post-UCMS (C). Open field (OF) results for total distance at baseline (B) and post-UCMS (D). Numbers at the base of bars indicate N. Error bars indicate mean ± SEM. ***p < 0.001; **p < 0.01; *p < 0.05.

References

    1. Kessler RC, Berglund P, Demler O, Jin R, Merikangas KR, Walters EE. Lifetime prevalence and age-of-onset distributions of DSM-IV disorders in the National Comorbidity Survey Replication. Arch Gen Psychiatry (2005) 62(6):593–60210.1001/archpsyc.62.6.593 - DOI - PubMed
    1. Krueger RF, Chentsova-Dutton YE, Markon KE, Goldberg D, Ormel J. A cross-cultural study of the structure of comorbidity among common psychopathological syndromes in the general health care setting. J Abnorm Psychol (2003) 112(3):437–4710.1037/0021-843X.112.3.437 - DOI - PubMed
    1. Kotov R, Ruggero CJ, Krueger RF, Watson D, Yuan Q, Zimmerman M. New dimensions in the quantitative classification of mental illness. Arch Gen Psychiatry (2011) 68(10):1003–1110.1001/archgenpsychiatry.2011.107 - DOI - PubMed
    1. Kessler RC, Ormel J, Petukhova M, McLaughlin KA, Green JG, Russo LJ, et al. Development of lifetime comorbidity in the World Health Organization world mental health surveys. Arch Gen Psychiatry (2011) 68(1):90–10010.1001/archgenpsychiatry.2010.180 - DOI - PMC - PubMed
    1. Demirkan A, Penninx BW, Hek K, Wray NR, Amin N, Aulchenko YS, et al. Genetic risk profiles for depression and anxiety in adult and elderly cohorts. Mol Psychiatry (2011) 16(7):773–8310.1038/mp.2010.65 - DOI - PMC - PubMed

LinkOut - more resources