Virulence evolution of a generalist plant virus in a heterogeneous host system
- PMID: 24062798
- PMCID: PMC3779090
- DOI: 10.1111/eva.12073
Virulence evolution of a generalist plant virus in a heterogeneous host system
Abstract
Modelling virulence evolution of multihost parasites in heterogeneous host systems requires knowledge of the parasite biology over its various hosts. We modelled the evolution of virulence of a generalist plant virus, Cucumber mosaic virus (CMV) over two hosts, in which CMV genotypes differ for within-host multiplication and virulence. According to knowledge on CMV biology over different hosts, the model allows for inoculum flows between hosts and for host co-infection by competing virus genotypes, competition affecting transmission rates to new hosts. Parameters of within-host multiplication, within-host competition, virulence and transmission were determined experimentally for different CMV genotypes in each host. Emergence of highly virulent genotypes was predicted to occur as mixed infections, favoured by high vector densities. For most simulated conditions, evolution to high virulence in the more competent Host 1 was little dependent on inoculum flow from Host 2, while in Host 2, it depended on transmission from Host 1. Virulence evolution bifurcated in each host at low, but not at high, vector densities. There was no evidence of between-host trade-offs in CMV life-history traits, at odds with most theoretical assumptions. Predictions agreed with field observations and are relevant for designing control strategies for multihost plant viruses.
Keywords: Cucumber mosaic virus; multihost parasites; virulence evolution; virus emergence.
Figures

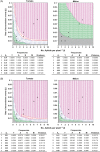
 ) or where Y isolates (Y
  ), A isolates (A
 ), N isolates (N
  ) or A+N isolates (M
  ) are the most prevalent in the virus populations. Figure 1A for tomato was redrawn from the study by Escriu et al. (2003). For a series of i and βe values, indicated by asterisks in the figure, the relative equilibrium frequency of the different virus genotypes in, and the average virulence of, the virus population is indicated.
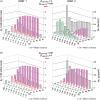
 ) or for plants infected by CMV isolates Y1, Y2 (
  ), A1, A2 (
  ), N1, N2 (
  ) or mixed infected with A+N isolates (M1, M2
 ).
).
 ) or for plants infected by CMV isolates Y1, Y2 (
  ), A1, A2 (
  ), N1, N2 (
  ) or mixed infected with A+N isolates (M1, M2
 ).
).
 ) or plants infected by Y isolates (Y
  ), by A isolates (A
  ), by N isolates (N
  ) or by A+N isolates (M
  ). The shadow indicates the overlapping of the life cycles of Host 1 and Host 2, and the arrow indicates the host that initiates the rotation.
 ) or plants infected by Y isolates (Y
  ), by A isolates (A
  ), by N isolates (N
  ) or by A+N isolates (M
  ). The shadow indicates the overlapping of the life cycles of Host 2 and Host 1, and the arrow indicates the host that initiates the rotation.
References
-
- Alizon S. Decreased overall virulence in coinfected hosts leads to the persistence of virulent parasites. American Naturalist. 2008;172:E67–E79. - PubMed
-
- Alizon S, Hurford A, Mideo N, Van Baalen M. Virulence evolution and the trade-off hypothesis: history, current state of affairs and the future. Journal of Evolutionary Biology. 2009;22:245–259. - PubMed
-
- Alonso-Prados JL, Aranda MA, Malpica JM, García-Arenal F, Fraile A. Satellite RNA of Cucumber mosaic cucumovirus spreads epidemically in natural populations of its helper virus. Phytopathology. 1998;88:520–524. - PubMed
-
- Alonso-Prados JL, Luis-Arteaga M, Alvarez JM, Moriones E, Batle A, García-Arenal F, Fraile A. Epidemics of aphid transmitted viruses in melon crops in Spain. European Journal of Plant Pathology. 2003;109:129–138.
LinkOut - more resources
Full Text Sources
Other Literature Sources

