

Pathway-based outlier method reveals heterogeneous genomic structure of autism in blood transcriptome
- PMID: 24063311
- PMCID: PMC3849321
- DOI: 10.1186/1755-8794-6-34
Pathway-based outlier method reveals heterogeneous genomic structure of autism in blood transcriptome
Abstract
Background: Decades of research strongly suggest that the genetic etiology of autism spectrum disorders (ASDs) is heterogeneous. However, most published studies focus on group differences between cases and controls. In contrast, we hypothesized that the heterogeneity of the disorder could be characterized by identifying pathways for which individuals are outliers rather than pathways representative of shared group differences of the ASD diagnosis.
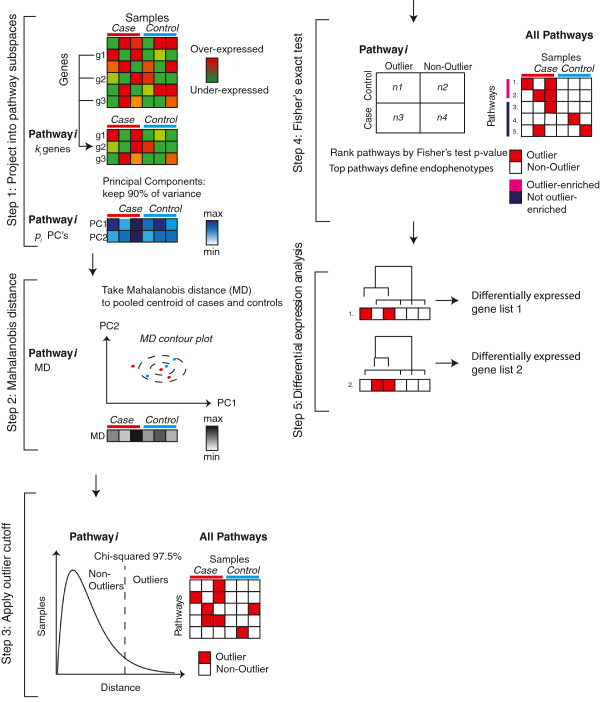
Methods: Two previously published blood gene expression data sets--the Translational Genetics Research Institute (TGen) dataset (70 cases and 60 unrelated controls) and the Simons Simplex Consortium (Simons) dataset (221 probands and 191 unaffected family members)--were analyzed. All individuals of each dataset were projected to biological pathways, and each sample's Mahalanobis distance from a pooled centroid was calculated to compare the number of case and control outliers for each pathway.
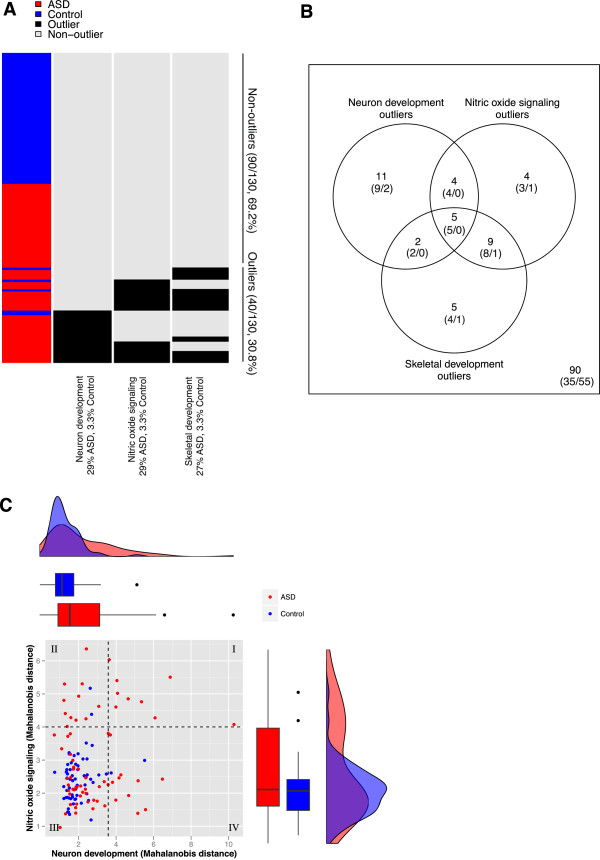
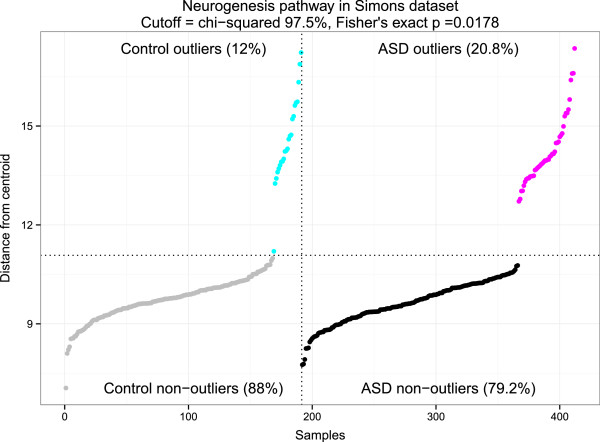
Results: Analysis of a set of blood gene expression profiles from 70 ASD and 60 unrelated controls revealed three pathways whose outliers were significantly overrepresented in the ASD cases: neuron development including axonogenesis and neurite development (29% of ASD, 3% of control), nitric oxide signaling (29%, 3%), and skeletal development (27%, 3%). Overall, 50% of cases and 8% of controls were outliers in one of these three pathways, which could not be identified using group comparison or gene-level outlier methods. In an independently collected data set consisting of 221 ASD and 191 unaffected family members, outliers in the neurogenesis pathway were heavily biased towards cases (20.8% of ASD, 12.0% of control). Interestingly, neurogenesis outliers were more common among unaffected family members (Simons) than unrelated controls (TGen), but the statistical significance of this effect was marginal (Chi squared P < 0.09).
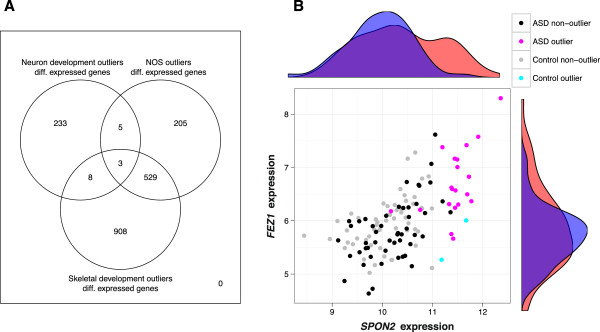
Conclusions: Unlike group difference approaches, our analysis identified the samples within the case and control groups that manifested each expression signal, and showed that outlier groups were distinct for each implicated pathway. Moreover, our results suggest that by seeking heterogeneity, pathway-based outlier analysis can reveal expression signals that are not apparent when considering only shared group differences.
Figures
Similar articles
-
Genome-wide transcriptome profiling reveals the functional impact of rare de novo and recurrent CNVs in autism spectrum disorders.Am J Hum Genet. 2012 Jul 13;91(1):38-55. doi: 10.1016/j.ajhg.2012.05.011. Epub 2012 Jun 21. Am J Hum Genet. 2012. PMID: 22726847 Free PMC article.
-
Integrated genome-wide Alu methylation and transcriptome profiling analyses reveal novel epigenetic regulatory networks associated with autism spectrum disorder.Mol Autism. 2018 Apr 16;9:27. doi: 10.1186/s13229-018-0213-9. eCollection 2018. Mol Autism. 2018. PMID: 29686828 Free PMC article.
-
Characteristics and predictive value of blood transcriptome signature in males with autism spectrum disorders.PLoS One. 2012;7(12):e49475. doi: 10.1371/journal.pone.0049475. Epub 2012 Dec 5. PLoS One. 2012. PMID: 23227143 Free PMC article.
-
Genomic and genetic aspects of autism spectrum disorder.Biochem Biophys Res Commun. 2014 Sep 19;452(2):244-53. doi: 10.1016/j.bbrc.2014.08.108. Epub 2014 Aug 27. Biochem Biophys Res Commun. 2014. PMID: 25173933 Review.
-
Etiological heterogeneity in autism spectrum disorders: more than 100 genetic and genomic disorders and still counting.Brain Res. 2011 Mar 22;1380:42-77. doi: 10.1016/j.brainres.2010.11.078. Epub 2010 Dec 1. Brain Res. 2011. PMID: 21129364 Review.
Cited by
-
Blood transcriptomic comparison of individuals with and without autism spectrum disorder: A combined-samples mega-analysis.Am J Med Genet B Neuropsychiatr Genet. 2017 Apr;174(3):181-201. doi: 10.1002/ajmg.b.32511. Epub 2016 Nov 11. Am J Med Genet B Neuropsychiatr Genet. 2017. PMID: 27862943 Free PMC article.
-
The ortholog of human ssDNA-binding protein SSBP3 influences neurodevelopment and autism-like behaviors in Drosophila melanogaster.PLoS Biol. 2023 Jul 24;21(7):e3002210. doi: 10.1371/journal.pbio.3002210. eCollection 2023 Jul. PLoS Biol. 2023. PMID: 37486945 Free PMC article.
-
High-resolution chromosome ideogram representation of currently recognized genes for autism spectrum disorders.Int J Mol Sci. 2015 Mar 20;16(3):6464-95. doi: 10.3390/ijms16036464. Int J Mol Sci. 2015. PMID: 25803107 Free PMC article.
-
An Improved CRISPR/dCas9 Interference Tool for Neuronal Gene Suppression.Front Genome Ed. 2020 Sep 15;2:9. doi: 10.3389/fgeed.2020.00009. eCollection 2020. Front Genome Ed. 2020. PMID: 34713218 Free PMC article.
-
Immune Dysfunction and Autoimmunity as Pathological Mechanisms in Autism Spectrum Disorders.Front Cell Neurosci. 2018 Nov 13;12:405. doi: 10.3389/fncel.2018.00405. eCollection 2018. Front Cell Neurosci. 2018. PMID: 30483058 Free PMC article. Review.
References
-
- Manolio TA, Collins FS, Cox NJ, Goldstein DB, Lucia A, Hunter DJ, Mccarthy MI, Ramos EM, Cardon LR, Cho JH, Guttmacher AE, Kong A, Kruglyak L, Mardis E, Rotimi CN, Slatkin M, Valle D, Alice S, Boehnke M, Clark AG, Eichler EE, Gibson G. Finding the missing heritability of complex diseases. Nature. 2009;461:747–753. doi: 10.1038/nature08494. - DOI - PMC - PubMed
Publication types
MeSH terms
Grants and funding
LinkOut - more resources
Full Text Sources
Other Literature Sources
