. 2013 Sep 24:14:44.
doi: 10.1186/1471-2172-14-44.

CAWS administration increases the expression of interferon γ and complement factors that lead to severe vasculitis in DBA/2 mice

Affiliations

CAWS administration increases the expression of interferon γ and complement factors that lead to severe vasculitis in DBA/2 mice

Noriko Nagi-Miura et al. BMC Immunol. .

Abstract

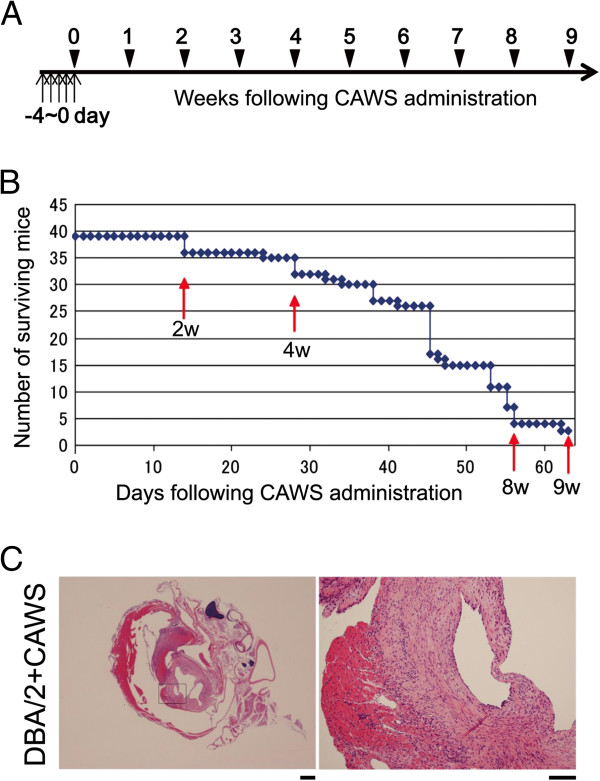
Background: Candida albicans water-soluble fraction (CAWS), a mannoprotein-β-glucan complex obtained from the culture supernatant of C. albicans NBRC1385, causes CAWS-mediated vasculitis (CAWS-vasculitis) in B6 and DBA/2 mice with mild and lethal symptoms, respectively. Why CAWS is lethal only in DBA/2 mice remains unknown.

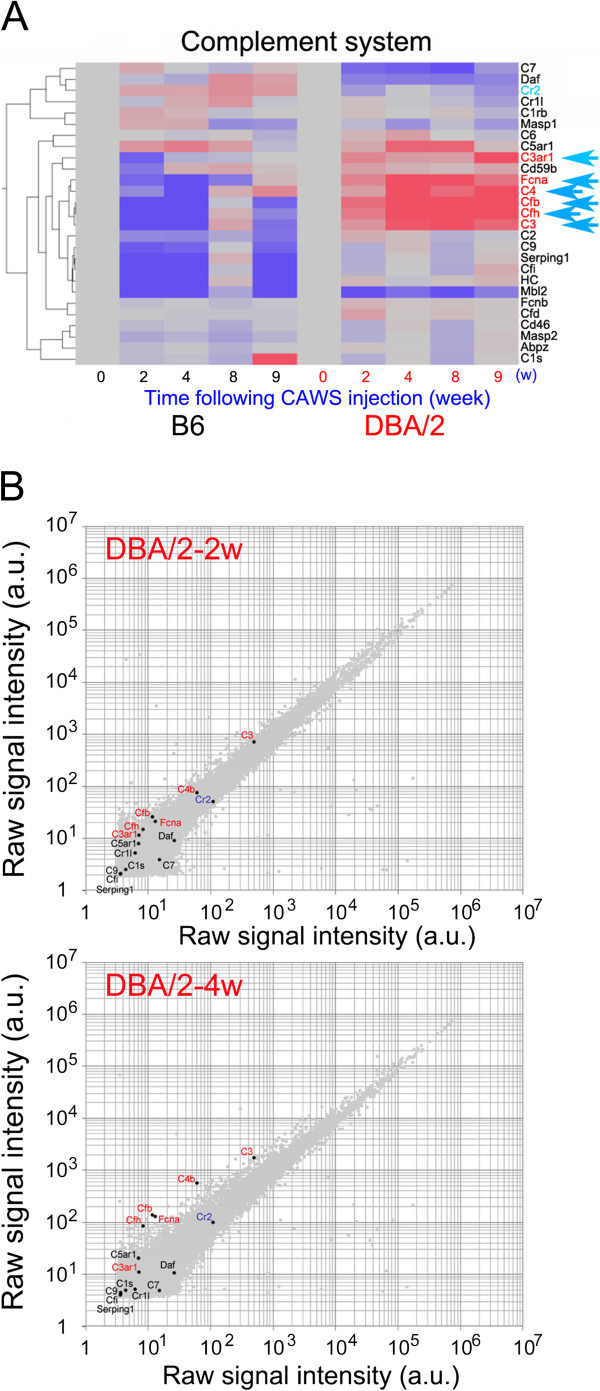
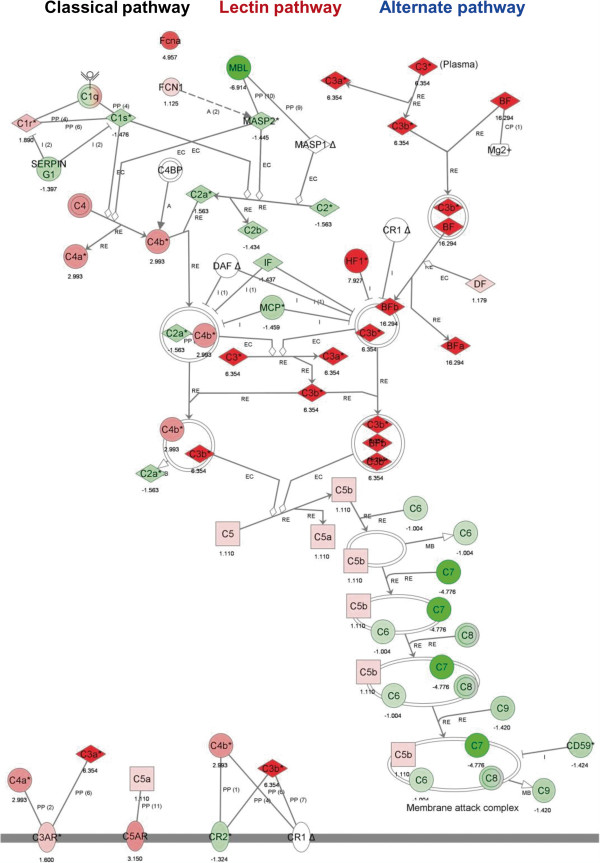
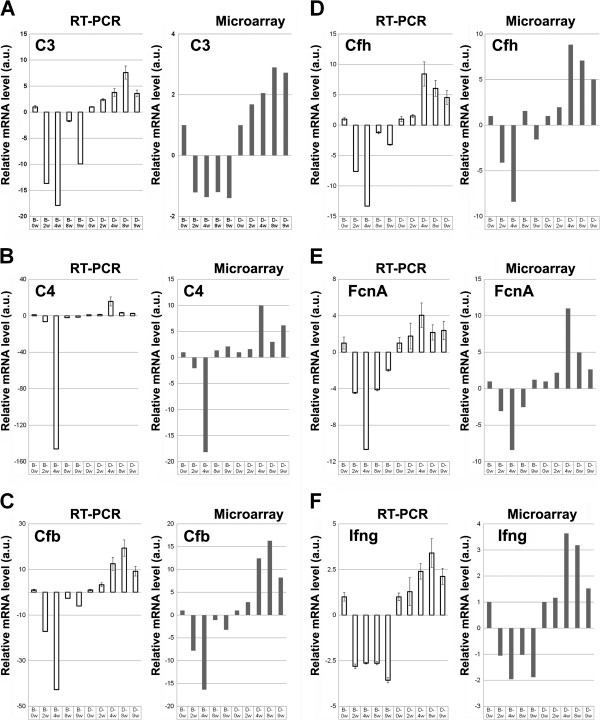
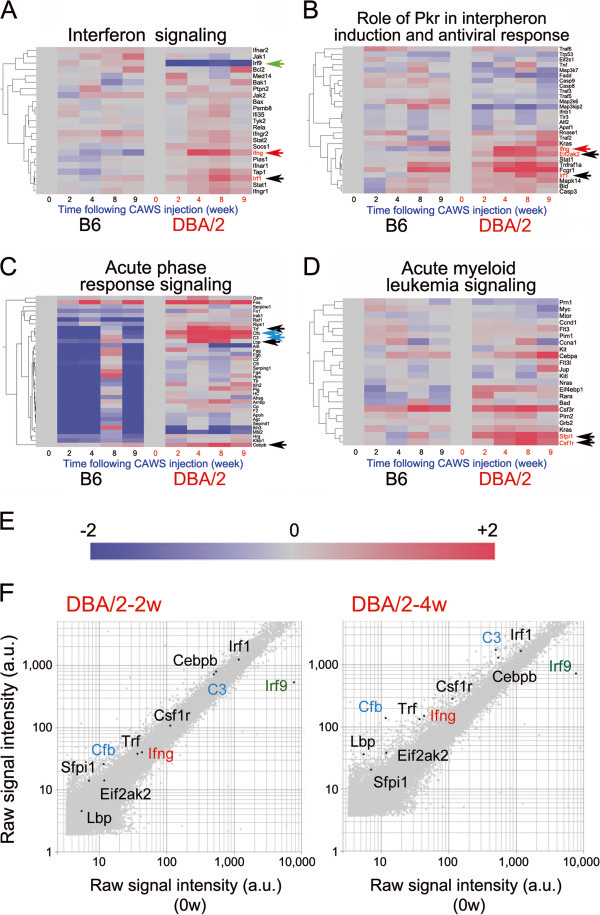
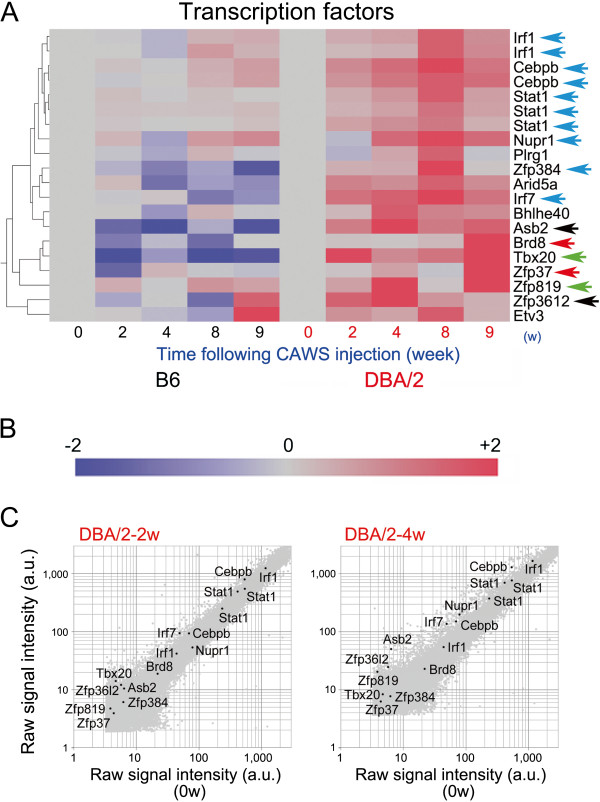
Results: We performed DNA microarray analyses using mRNA obtained from peripheral blood mononuclear cells (PBMCs) of B6 and DBA/2 mice and compared their respective transcriptomes. We found that the mRNA levels of interferon-γ (Ifng) and several genes that regulate the complement system, such as C3, C4, Cfb, Cfh, and Fcna, were increased dramatically only in DBA/2 mice at 4 and 8 weeks after CAWS administration. The dramatic increase was confirmed by quantitative real-time polymerase chain reactions (qRT-PCR). Moreover, mRNA levels of immune-related genes, such as Irf1, Irf7, Irf9, Cebpb, Ccl4, Itgam, Icam1, and IL-12rb1, whose expression levels are known to be increased by Ifng, were also increased, but only in DBA/2 mice. By contrast, the mRNA level of Dectin-2, the critical receptor for the α-mannans of CAWS, was increased slightly and similarly in both B6 and DBA/2 mice after CAWS administration.

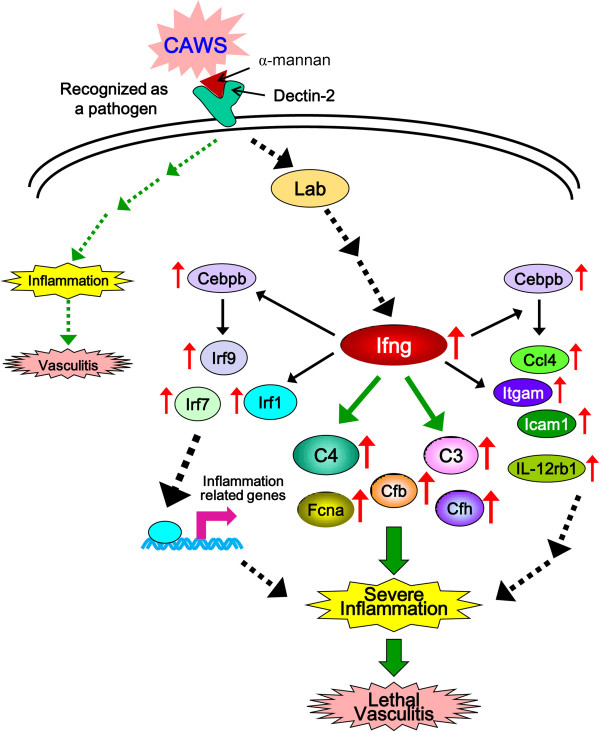
Conclusions: Taken together, our results suggest that CAWS administration induces Dectin-2 mediated CAWS-vasculitis in both B6 and DBA/2 mice and the expression of Ifng, but only in DBA/2 mice, which led to increased expression of C3, C4, Cfb, Cfh, and Fcna and an associated increase in lethality in these mice. This model may contribute to our understanding of the pathogenesis of severe human vasculitis.


Figures

Figure 1
Figure 1
Survival curve and histopathological analysis. (A) Schedule of CAWS administration. Vertical arrows indicate that CAWS was administered i.p. (0 or 1 mg/mouse) for 5 consecutive days to each B6 or DBA/2 mouse. (B) The surviving number of DBA/2 mice following CAWS administration is shown, and confirms that CAWS administration is as effective (toxic) as in our previous report [12]. Red vertical arrows indicate the time points (2 w, 4 w, 8 w and 9 w) at which three B6 mice and three DBA/2 mice were sacrificed for mRNA purification. (C) Histopathological analysis was performed on aortic roots and coronary arteries collected from DBA/2 mice at 6 w following CAWS administration stained with H&E. Enlarged views of the region indicated by rectangles in the left panels are shown in the right panels. Bar = 500 μm for left panels and 100 μm for right panels.
Figure 2
Figure 2
Expression profiling of microarray data for complement system genes following administration of CAWS to B6 and DBA/2 mice. (A) Mosaic tile representation of genes involved in the complement system. B6 and DBA/2 samples were clustered using a hierarchical clustering program (Spearman) to identify gene-to-gene relationships. Intensity gradients indicate the mean value of the expression level (log2 ratio): blue (down-regulation) and crimson (upregulation) are shown compared to the average value at week 0 (0 w) after CAWS administration (gray). C3ar1, Fcna, C4, Cfb, Cfh, and C3 genes are highlighted by turquoise arrows. (B) Scatter plots of the log of signal intensity at 2 w (top panel) or 4 w (bottom panel) versus 0 w of CAWS administration in DBA/2 mice. Data are plotted over the entire signal intensity range to demonstrate that these expression arrays provide a high-resolution platform. C3ar1, Fcna, C4, Cfb, Cfh, and C3 genes are highlighted in red font.
Figure 3
Figure 3
Analysis of the transcriptome data. The data were obtained from PBMCs following administration of CAWS to B6 and DBA/2 mice using Ingenuity Pathway Analysis software. This analysis suggested that among the three pathways of the complement system, the alternative pathway appears to be conspicuously activated. A network pathway is a graphical representation of the molecular relationships between molecules. Molecules are represented as nodes, and the biological relationship between two nodes is represented as an edge (line). All edges are supported by at least one reference from the literature, a textbook, or canonical information stored in the Ingenuity Knowledge Base. The green and red bars associated with each gene symbol indicate up- (red) and downregulated (green) mRNA expression at 2 w, 4 w, 8 w, or 9 w after CAWS administration in B6 (left; green bars) and DBA/2 mice (right; red bars). Upregulated and downregualted levels were measured as fold changes with respect to levels at 0 w.
Figure 4
Figure 4
Comparison of the mRNA expression levels. The mRNA expression levels of C3 (A), C4 (B), Cfb (C), Cfh (D), FcnA (E), and Ifng (F) were as assessed by qRT-PCR and DNA microarray of PBMCs obtained from B6 and DBA/2 mice at 2 w, 4 w, 8 w, and 9 w following CAWS administration. The vertical axis indicates the mRNA level (arbitrary unit: a.u.) relative to that at 0 w, which was fixed at 1.0 a.u.
Figure 5
Figure 5
Expression profiling of the microarray data for genes involved in interferon-related signal transduction pathways following administration of CAWS to B6 and DBA/2 mice. Mosaic tiles and hierarchical clustering of microarray data are shown for the genes involved in interferon signaling (A), the role of protein kinase R (Pkr) in interferon induction and antiviral response (B), acute phase response signaling (C), and acute myeloid leukemia signaling (D). B6 and DBA/2 samples were clustered using a hierarchical clustering program (Spearman) to discover gene-to-gene relationships. Irf1, Eif2ak2, Trl, Lbp, Cebpb, Sfpil1, and Csf1r are highlighted by black arrows, Cfb and C3 by turquoise, Ifng by red and Irf9 by green arrows. (E) Intensity gradients indicate the mean value of the expression level (log2 ratio): blue (down-regulation) and crimson (upregulation) are shown compared to the average value at 0 w after CAWS administration (gray). (F) Scatter plots of the highlighted genes in log of signal intensity at 2 w (left panel) or 4 w (right panel) versus 0 w following CAWS administration in DBA/2 mice; data are plotted along the vertical and horizontal axes (arbitrary unit: a.u.), respectively. Highlighted genes are Ifng (red font), C3 (turquoise font), Cfb (turquoise font), and Irf9 (green font).
Figure 6
Figure 6
Expression profiling of the microarray data for transcription factor genes following administration of CAWS to B6 and DBA/2 mice. (A) Mosaic tiles and hierarchical clustering of microarray data are shown. B6 and DBA/2 samples were clustered using a hierarchical clustering program (Spearman) to identify gene-to-gene relationships. Genes upregulated predominantly in DBA/2 mice following administration of CAWS are highlighted by colored and black arrows. (B) Intensity gradients indicate the mean value of the expression level (log2 ratio): blue (down-regulation) and crimson (upregulation) are shown compared to the average value at 0 w after CAWS administration (gray). (C) Scatter plots of highlighted genes in the log of signal intensity at 2 w (left panel) or 4 w (right panel) versus 0 w following CAWS administration in DBA/2 mice; data are plotted along the vertical and horizontal axes (arbitrary unit: a.u.), respectively.
Figure 7
Figure 7
A molecular model to elucidate the pathogenesis of severe CAWS-vasculitis in DBA/2 mice. Putative expression targets of Ifng are graphically represented. Upregulated genes following CAWS administration in DBA/2 mice are indicated by upward red arrows. Black and green arrows between the proteins represent known interactions. Dotted arrows indicate indirect interactions. See text for details.

Similar articles

Cited by

References

    1. Talarico R, Baldini C, Della Rossa A, Stagnaro C, Ferrari C, Luciano N, Bombardieri S. Large- and small-vessel vasculitis: a critical digest of the 2010–2011 literature. Clin Exp Rheumatol. 2000;30(70):S130–S138. - PubMed
    1. Ohno N. Chemistry and biology of angiitis inducer, Candida albicans water-soluble mannoprotein-β-glucan complex (CAWS) Microbiol Immunol. 2003;47(7):479–490. - PubMed
    1. Shinohara H, Nagi-Miura N, Ishibashi K, Adachi Y, Ishida-Okawara A, Oharaseki T, Takahashi K, Naoe S, Suzuki K, Ohno N. Beta-mannosyl linkages negatively regulate anaphylaxis and vasculitis in mice, induced by CAWS, fungal PAMPS composed of mannoprotein-beta-glucan complex secreted by Candida albicans. Biol Pharm Bull. 2006;29(9):1854–1861. doi: 10.1248/bpb.29.1854. - DOI - PubMed
    1. Ohno N. A murine model of vasculitis induced by fungal polysaccharide. Cardiovasc Hematol Agents Med Chem. 2008;6(1):44–52. doi: 10.2174/187152508783329957. - DOI - PubMed
    1. Nagi-Miura N, Shingo Y, Kurihara K, Adachi Y, Suzuki K, Ohno N. Involvement of platelet activating factor, histamine and serotonin in acute lethal shock induced by Candida albicans water-soluble extracellular polysaccharide fraction (CAWS) in mice. Biol Pharm Bull. 2007;30(7):1354–1357. doi: 10.1248/bpb.30.1354. - DOI - PubMed

Publication types

MeSH terms

Associated data