

Age and sex differences in the incorporation of EPA and DHA into plasma fractions, cells and adipose tissue in humans
- PMID: 24063767
- PMCID: PMC4351921
- DOI: 10.1017/S0007114513002985
Age and sex differences in the incorporation of EPA and DHA into plasma fractions, cells and adipose tissue in humans
Abstract
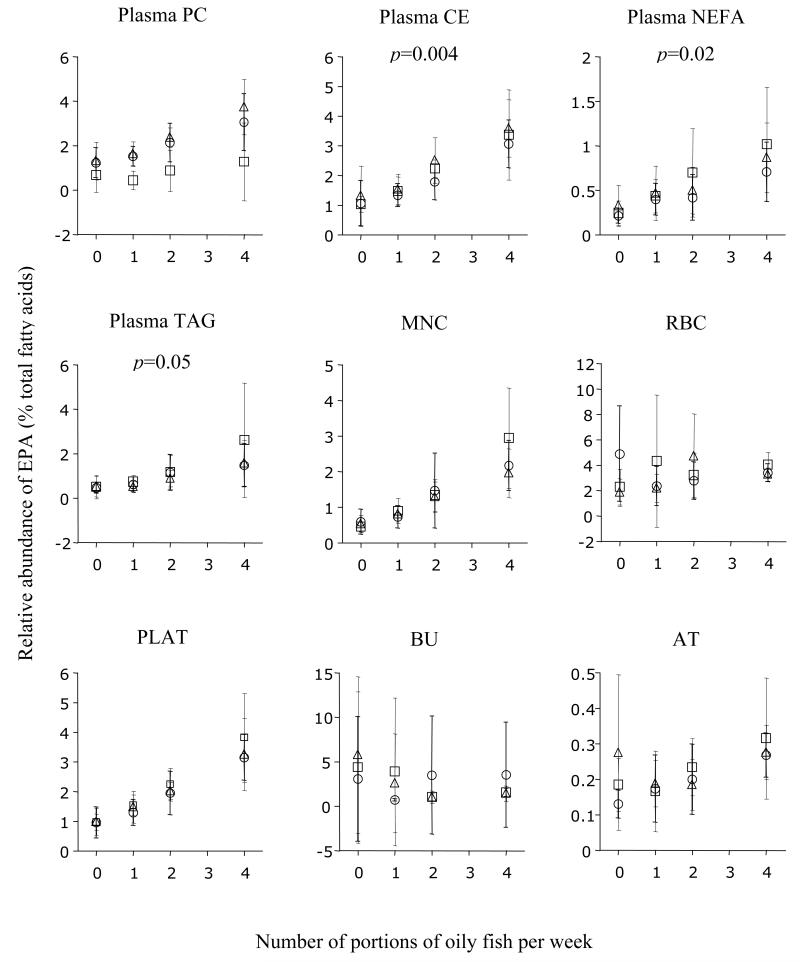
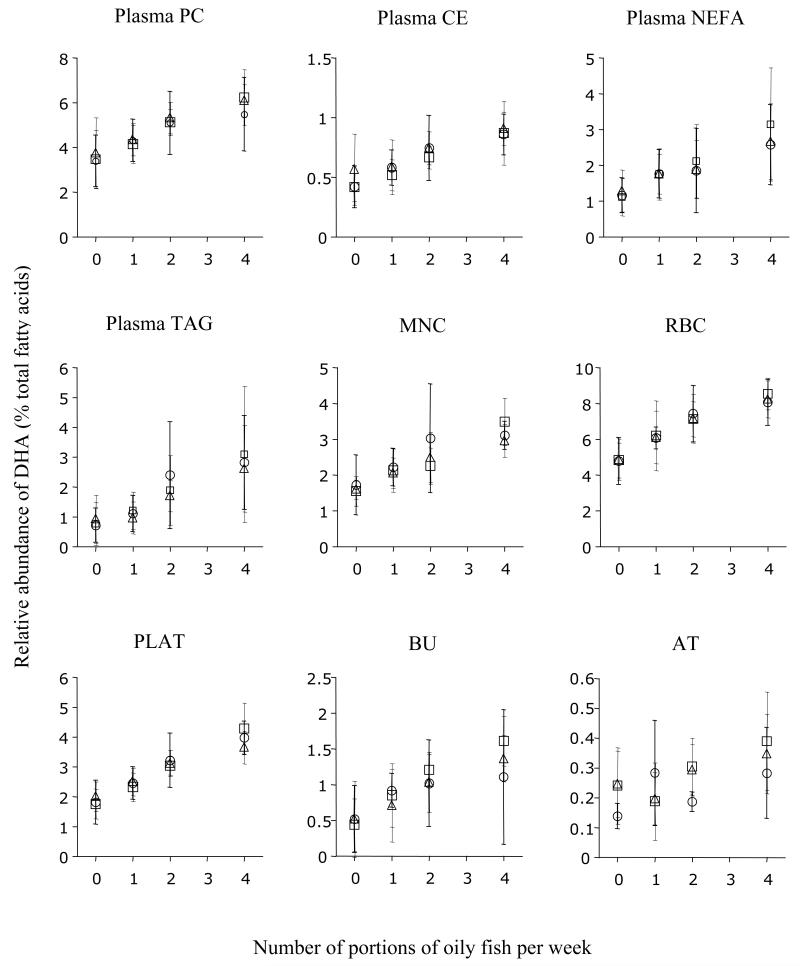
The aim of the present study was to determine whether age and sex influence both the status and incorporation of EPA and DHA into blood plasma, cells and tissues. The study was a double-blind, randomised, controlled intervention trial, providing EPA plus DHA equivalent to 0, 1, 2 or 4 portions of oily fish per week for 12 months. The participants were stratified by age and sex. A linear regression model was used to analyse baseline outcomes, with covariates for age or sex groups and by adjusting for BMI. The change in outcomes from baseline to 12 months was analysed with additional adjustment for treatment and average compliance. Fatty acid profiles in plasma phosphatidylcholine, cholesteryl esters, NEFA and TAG, mononuclear cells (MNC), erythrocyte membranes, platelets, buccal cells (BU) and adipose tissue (AT) were determined. At baseline, EPA concentrations in plasma NEFA and DHA concentrations in MNC, BU and AT were higher in females than in males (all P< 0·05). The concentrations of EPA in AT (P= 0·003) and those of DHA in plasma TAG (P< 0·01) and AT (P< 0·001) were higher with increasing age. Following 12-month supplementation with EPA plus DHA, adjusted mean difference for change in EPA concentrations in plasma TAG was significantly higher in females than in males (P< 0·05) and was greater with increasing age (P= 0·02). Adjusted mean difference for change in DHA concentrations in AT was significantly smaller with increasing age (P= 0·02). Although small differences in incorporation with age and sex were identified, these were not of sufficient magnitude to warrant a move away from population-level diet recommendations for n-3 PUFA.
Figures


References
-
- Hodson L, Skeaff CM, Fielding BA. Fatty acid composition of adipose tissue and blood in humans and its use as a biomarker of dietary intake. Prog Lipid Res. 2008;47:348–380. - PubMed
-
- Childs CE, Romeu-Nadal M, Burdge GC, Calder PC. Gender differences in the n-3 fatty acid content of tissues. Proc Nutr Soc. 2008;67:19–27. - PubMed
-
- Crowe FL, Skeaff CM, Green TJ, Gray AR. Serum n-3 long-chain PUFA differ by sex and age in a population-based survey of New Zealand adolescents and adults. Br J Nutr. 2008;99:168–174. - PubMed
-
- Bakewell L, Burdge GC, Calder PC. Polyunsaturated fatty acid concentrations in young men and women consuming their habitual diets. Br J Nutr. 2006;96:93–99. - PubMed
Publication types
MeSH terms
Substances
Grants and funding
LinkOut - more resources
Full Text Sources
Other Literature Sources
Medical
Research Materials
