

Changes in nasal airflow and heat transfer correlate with symptom improvement after surgery for nasal obstruction
- PMID: 24063885
- PMCID: PMC3959863
- DOI: 10.1016/j.jbiomech.2013.08.007
Changes in nasal airflow and heat transfer correlate with symptom improvement after surgery for nasal obstruction
Abstract
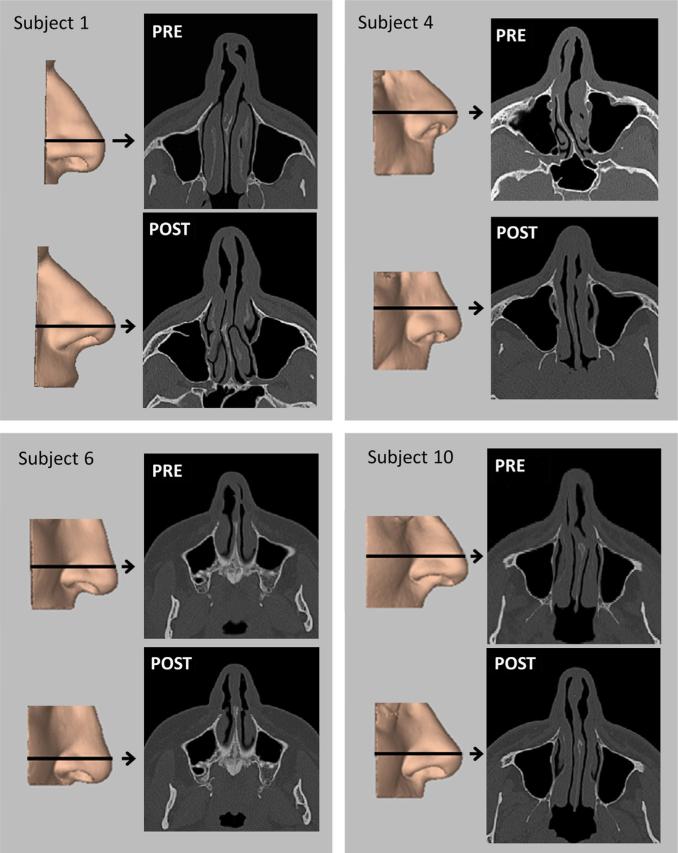
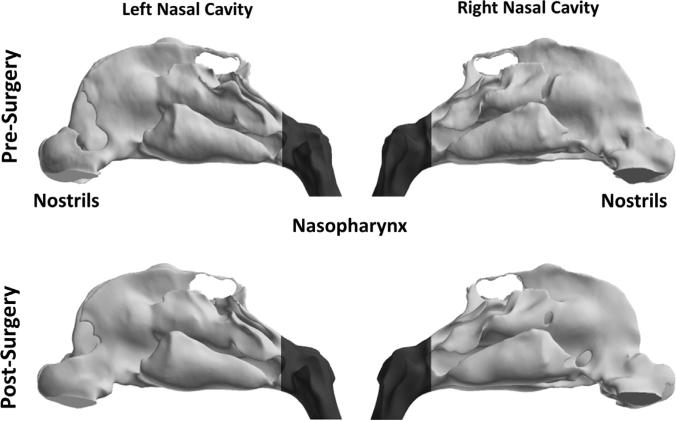
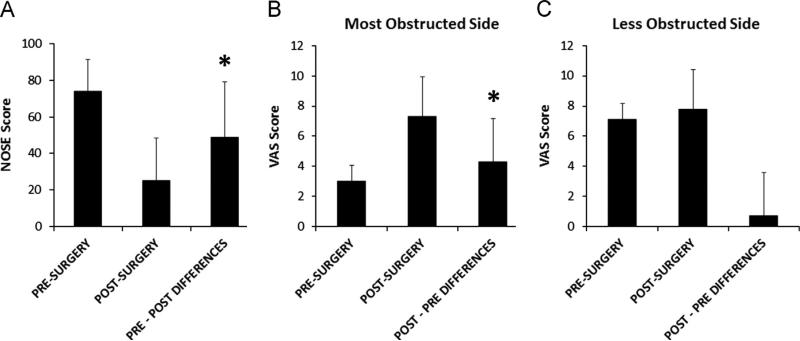
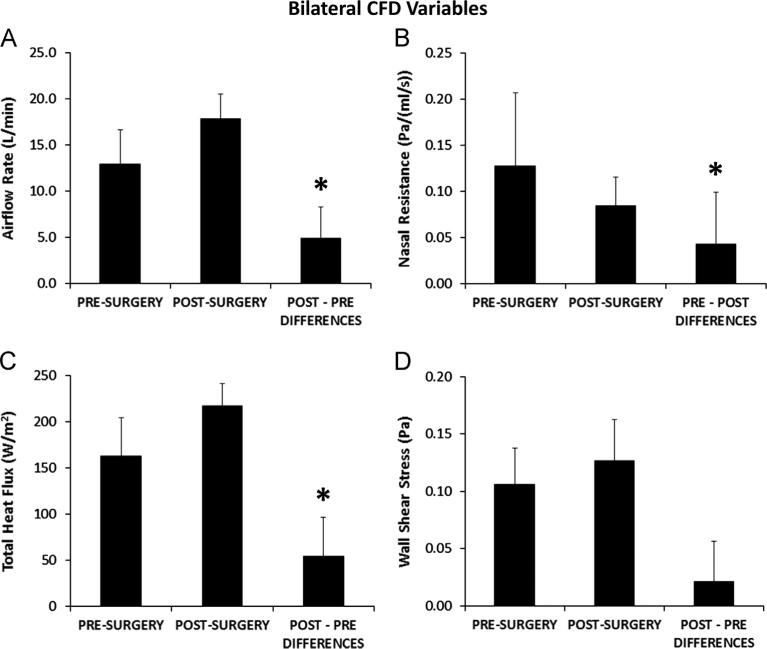
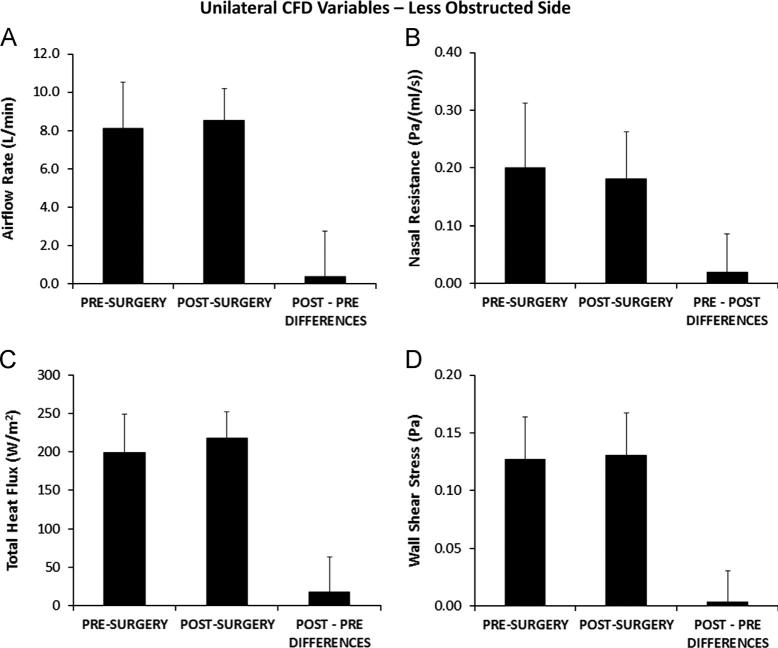
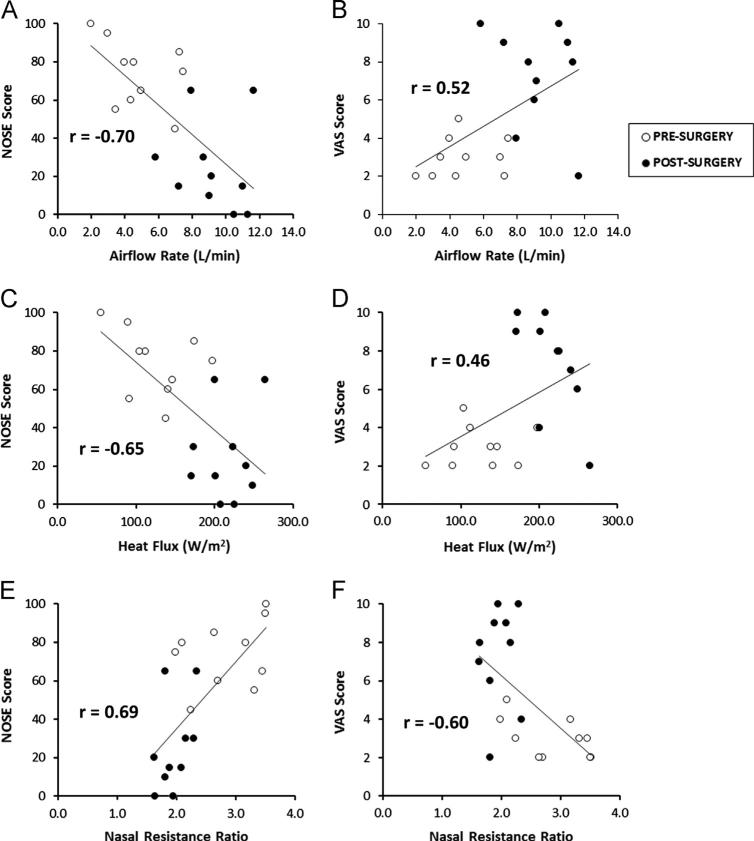
Surgeries to correct nasal airway obstruction (NAO) often have less than desirable outcomes, partly due to the absence of an objective tool to select the most appropriate surgical approach for each patient. Computational fluid dynamics (CFD) models can be used to investigate nasal airflow, but variables need to be identified that can detect surgical changes and correlate with patient symptoms. CFD models were constructed from pre- and post-surgery computed tomography scans for 10 NAO patients showing no evidence of nasal cycling. Steady-state inspiratory airflow, nasal resistance, wall shear stress, and heat flux were computed for the main nasal cavity from nostrils to posterior nasal septum both bilaterally and unilaterally. Paired t-tests indicated that all CFD variables were significantly changed by surgery when calculated on the most obstructed side, and that airflow, nasal resistance, and heat flux were significantly changed bilaterally as well. Moderate linear correlations with patient-reported symptoms were found for airflow, heat flux, unilateral allocation of airflow, and unilateral nasal resistance as a fraction of bilateral nasal resistance when calculated on the most obstructed nasal side, suggesting that these variables may be useful for evaluating the efficacy of nasal surgery objectively. Similarity in the strengths of these correlations suggests that patient-reported symptoms may represent a constellation of effects and that these variables should be tracked concurrently during future virtual surgery planning.
Keywords: Computational fluid dynamics; Nasal heat flux; Nasal resistance; Numerical modeling; Patient symptoms.
© 2013 Elsevier Ltd. All rights reserved.
Figures

Similar articles
-
Computed nasal resistance compared with patient-reported symptoms in surgically treated nasal airway passages: a preliminary report.Am J Rhinol Allergy. 2012 May-Jun;26(3):e94-8. doi: 10.2500/ajra.2012.26.3766. Am J Rhinol Allergy. 2012. PMID: 22643935 Free PMC article.
-
Correlations between computational fluid dynamics and clinical evaluation of nasal airway obstruction due to septal deviation: An observational study.Clin Otolaryngol. 2019 Jul;44(4):603-611. doi: 10.1111/coa.13344. Epub 2019 May 16. Clin Otolaryngol. 2019. PMID: 31004557
-
Normative ranges of nasal airflow variables in healthy adults.Int J Comput Assist Radiol Surg. 2020 Jan;15(1):87-98. doi: 10.1007/s11548-019-02023-y. Epub 2019 Jul 2. Int J Comput Assist Radiol Surg. 2020. PMID: 31267334 Free PMC article.
-
Functional relevance of computational fluid dynamics in the field of nasal obstruction: A literature review.Clin Otolaryngol. 2019 Sep;44(5):801-809. doi: 10.1111/coa.13396. Epub 2019 Jul 7. Clin Otolaryngol. 2019. PMID: 31233660 Review.
-
An Overview of Computational Fluid Dynamics Preoperative Analysis of the Nasal Airway.Facial Plast Surg. 2021 Jun;37(3):306-316. doi: 10.1055/s-0041-1722956. Epub 2021 Feb 8. Facial Plast Surg. 2021. PMID: 33556971 Review.
Cited by
-
Computational Analysis of the Mature Unilateral Cleft Lip Nasal Deformity on Nasal Patency.Plast Reconstr Surg Glob Open. 2019 May 16;7(5):e2244. doi: 10.1097/GOX.0000000000002244. eCollection 2019 May. Plast Reconstr Surg Glob Open. 2019. PMID: 31333968 Free PMC article.
-
Dynamics of airflow in a short inhalation.J R Soc Interface. 2015 Jan 6;12(102):20140880. doi: 10.1098/rsif.2014.0880. J R Soc Interface. 2015. PMID: 25551147 Free PMC article.
-
Evidence of Nasal Cooling and Sensory Impairments Driving Patient Symptoms With Septal Deviation.Laryngoscope. 2022 Mar;132(3):509-517. doi: 10.1002/lary.29673. Epub 2021 Jun 14. Laryngoscope. 2022. PMID: 34125439 Free PMC article.
-
In reference to Regional peak mucosal cooling predicts the perception of nasal patency.Laryngoscope. 2014 May;124(5):E210. doi: 10.1002/lary.24600. Epub 2014 Feb 20. Laryngoscope. 2014. PMID: 24443036 Free PMC article. No abstract available.
-
Correlation between Subjective Nasal Patency and Intranasal Airflow Distribution.Otolaryngol Head Neck Surg. 2017 Apr;156(4):741-750. doi: 10.1177/0194599816687751. Epub 2017 Jan 31. Otolaryngol Head Neck Surg. 2017. PMID: 28139171 Free PMC article.
References
-
- Andre RF, D'Souza AR, Kunst HP, Vuyk HD. Sub-alar batten grafts as treatment for nasal valve incompetence; description of technique and functional evaluation. Rhinology. 2006;44:118–122. - PubMed
-
- Chen XB, Lee HP, Chong VF, Wang de Y. Assessment of septal deviation effects on nasal air flow: a computational fluid dynamics model. Laryngoscope. 2009;119:1730–1736. - PubMed
-
- Chung SK, Son YR, Shin SJ, Kim SK. Nasal airflow during respiratory cycle. American Journal of Rhinology. 2006;20:379–384. - PubMed
-
- Dinis PB, Haider H. Septoplasty: long-term evaluation of results. American Journal of Otolaryngology. 2002;23:85–90. - PubMed
-
- Elad D, Naftali S, Rosenfeld M, Wolf M. Physical stresses at the air–wall interface of the human nasal cavity during breathing. Journal of Applied Physiology. 2006;100:1003–1010. - PubMed
Publication types
MeSH terms
Grants and funding
LinkOut - more resources
Full Text Sources
Other Literature Sources
Miscellaneous
