

Steroid receptor-DNA interactions: toward a quantitative connection between energetics and transcriptional regulation
- PMID: 24064251
- PMCID: PMC3902896
- DOI: 10.1093/nar/gkt859
Steroid receptor-DNA interactions: toward a quantitative connection between energetics and transcriptional regulation
Abstract
Steroid receptors comprise an evolutionarily conserved family of transcription factors. Although the qualitative aspects by which individual receptors regulate transcription are well understood, a quantitative perspective is less clear. This is primarily because receptor function is considerably more complex than that of classical regulatory factors such as phage or bacterial repressors. Here we discuss recent advances in placing receptor-specific transcriptional regulation on a more quantitative footing, specifically focusing on the role of macromolecular interaction energetics. We first highlight limitations and challenges associated with traditional approaches for assessing the role of energetics (more specifically, binding affinity) with functional outcomes such as transcriptional activation. We next demonstrate how rigorous in vitro measurements and straightforward interaction models quantitatively relate energetics to transcriptional activity within the cell, and follow by discussing why such an approach is unexpectedly effective in explaining complex functional behavior. Finally, we examine the implications of these findings for considering the unique gene regulatory properties of the individual receptors.
Figures
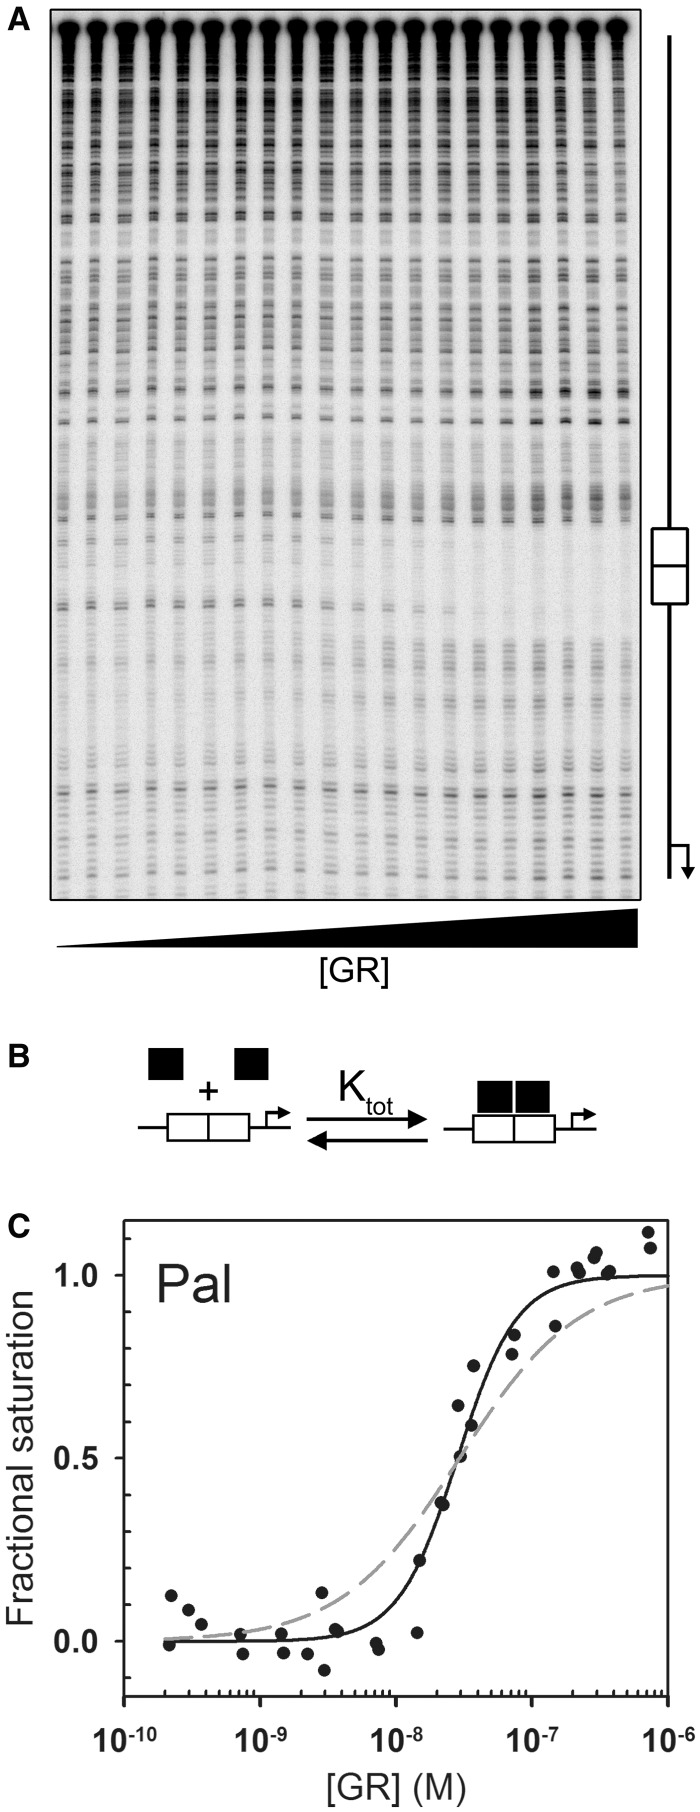
 ) was determined by integrating band intensities across the entire HRE. (B) GR-HRE assembly model depicting the total binding reaction and macroscopic product constant (Ktot), the total affinity for assembling two GR monomers at a palindromic response element. (C) Fractional saturation of the Pal sequence from two independent footprint titrations. Solid line represents global fit to both data sets using the Ktot binding model in Panel (B) and Equation 2 (SD = 0.087); dashed line represents fit to Equation 1 (SD = 0.126).
Similar articles
-
Dissection of androgen receptor-promoter interactions: steroid receptors partition their interaction energetics in parallel with their phylogenetic divergence.J Mol Biol. 2013 Nov 15;425(22):4223-35. doi: 10.1016/j.jmb.2013.07.033. Epub 2013 Aug 3. J Mol Biol. 2013. PMID: 23917122 Free PMC article.
-
Dissecting Steroid Receptor Function by Analytical Ultracentrifugation.Methods Enzymol. 2015;562:363-89. doi: 10.1016/bs.mie.2015.04.005. Epub 2015 Jun 12. Methods Enzymol. 2015. PMID: 26412661
-
Role of co-activators and co-repressors in the mechanism of steroid/thyroid receptor action.Recent Prog Horm Res. 1997;52:141-64; discussion 164-5. Recent Prog Horm Res. 1997. PMID: 9238851 Review.
-
Glucocorticoid receptor-DNA interactions: binding energetics are the primary determinant of sequence-specific transcriptional activity.J Mol Biol. 2012 Sep 7;422(1):18-32. doi: 10.1016/j.jmb.2012.06.005. Epub 2012 Jun 11. J Mol Biol. 2012. PMID: 22698871
-
Transcriptional regulation by steroid hormones.Steroids. 1996 Apr;61(4):240-51. doi: 10.1016/0039-128x(96)00030-x. Steroids. 1996. PMID: 8733009 Review.
Cited by
-
Synergistic Regulation of Coregulator/Nuclear Receptor Interaction by Ligand and DNA.Structure. 2017 Oct 3;25(10):1506-1518.e4. doi: 10.1016/j.str.2017.07.019. Epub 2017 Sep 7. Structure. 2017. PMID: 28890360 Free PMC article.
-
A Model of Glucocorticoid Receptor Interaction With Coregulators Predicts Transcriptional Regulation of Target Genes.Front Pharmacol. 2019 Mar 13;10:214. doi: 10.3389/fphar.2019.00214. eCollection 2019. Front Pharmacol. 2019. PMID: 30930776 Free PMC article.
-
Homolog comparisons further reconcile in vitro and in vivo correlations of protein activities by revealing over-looked physiological factors.Protein Sci. 2019 Oct;28(10):1806-1818. doi: 10.1002/pro.3695. Epub 2019 Aug 9. Protein Sci. 2019. PMID: 31351028 Free PMC article.
-
Steroids and the brain: 50years of research, conceptual shifts and the ascent of non-classical and membrane-initiated actions.Horm Behav. 2018 Mar;99:1-8. doi: 10.1016/j.yhbeh.2018.01.002. Epub 2018 Jan 12. Horm Behav. 2018. PMID: 29305886 Free PMC article. Review.
-
Concerted Gene Expression of Hippocampal Steroid Receptors during Spatial Learning in Male Wistar Rats: A Correlation Analysis.Front Behav Neurosci. 2016 May 17;10:94. doi: 10.3389/fnbeh.2016.00094. eCollection 2016. Front Behav Neurosci. 2016. PMID: 27242463 Free PMC article.
References
-
- Tsai MJ, O'Malley BW. Molecular mechanisms of action of steroid/thyroid receptor superfamily members. Annu. Rev. Biochem. 1994;63:451–486. - PubMed
-
- Nuclear Receptors Nomenclature Committee. A unified nomenclature system for the nuclear receptor superfamily. Cell. 1999;97:161–163. - PubMed
-
- Metivier R, Penot G, Hubner MR, Reid G, Brand H, Kos M, Gannon F. Estrogen receptor-alpha directs ordered, cyclical, and combinatorial recruitment of cofactors on a natural target promoter. Cell. 2003;115:751–763. - PubMed
-
- Nagaich AK, Walker DA, Wolford R, Hager GL. Rapid periodic binding and displacement of the glucocorticoid receptor during chromatin remodeling. Mol. Cell. 2004;14:163–174. - PubMed
Publication types
MeSH terms
Substances
Grants and funding
LinkOut - more resources
Full Text Sources
Other Literature Sources
