

Cerebral hemodynamic and ventilatory responses to hypoxia, hypercapnia, and hypocapnia during 5 days at 4,350 m
- PMID: 24064493
- PMCID: PMC3887348
- DOI: 10.1038/jcbfm.2013.167
Cerebral hemodynamic and ventilatory responses to hypoxia, hypercapnia, and hypocapnia during 5 days at 4,350 m
Abstract
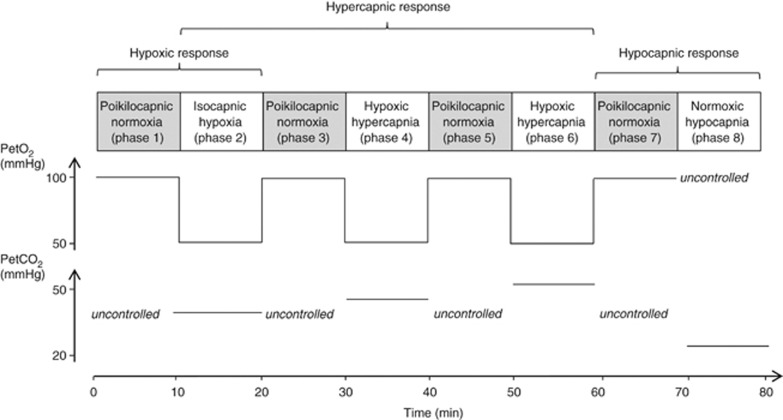
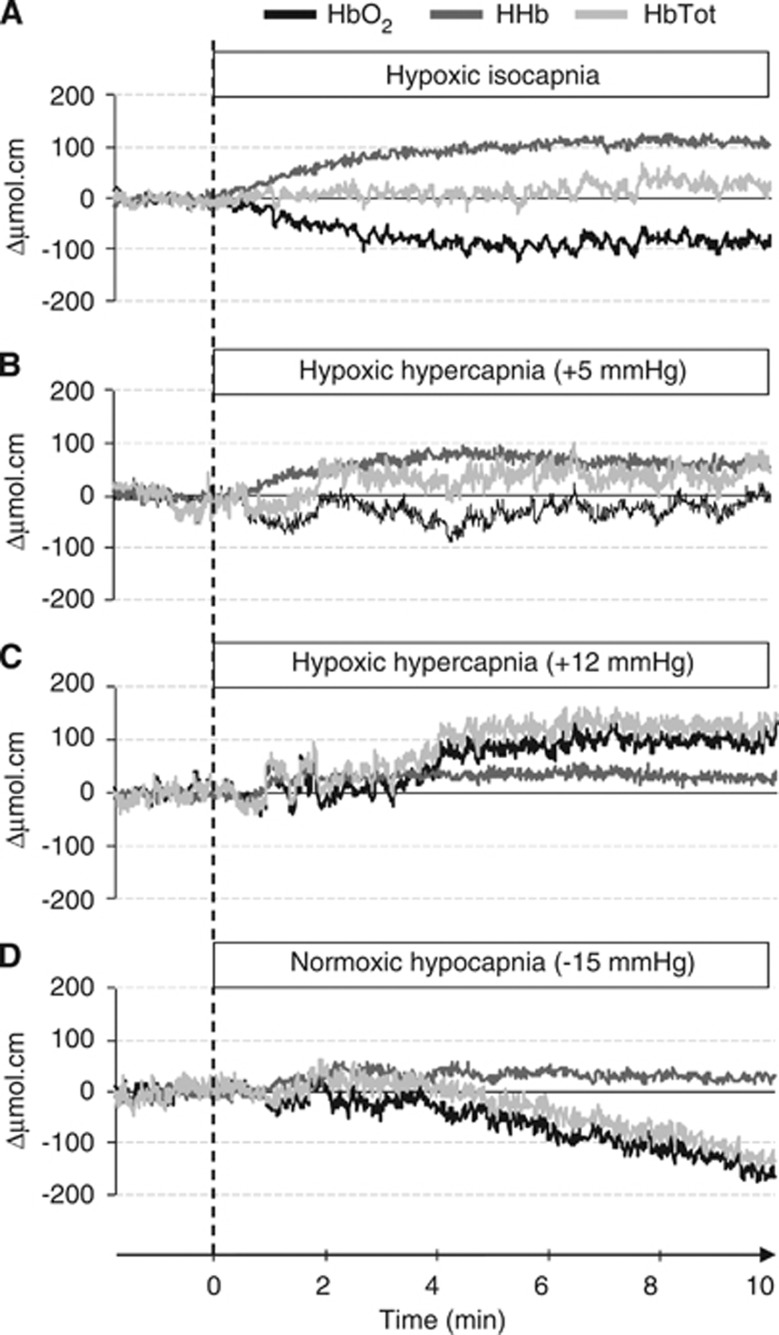
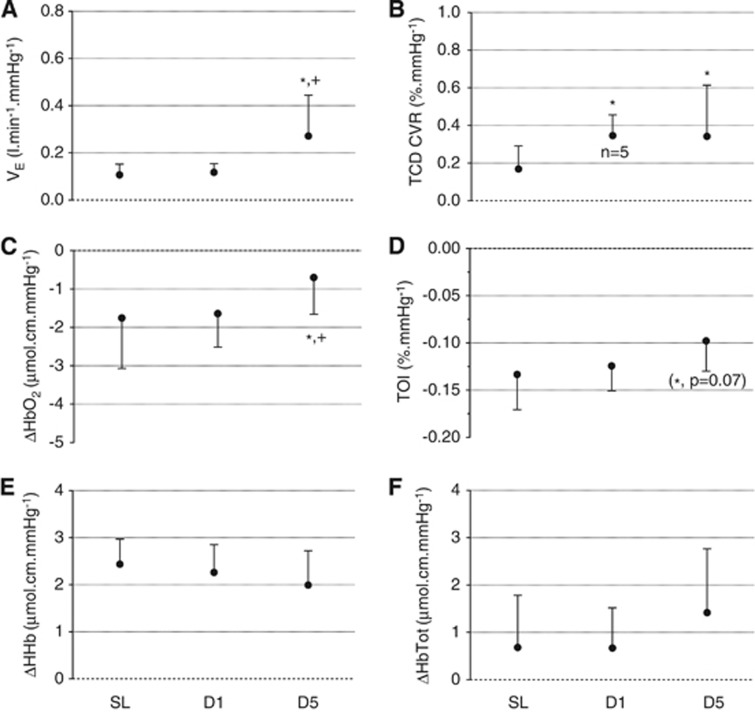
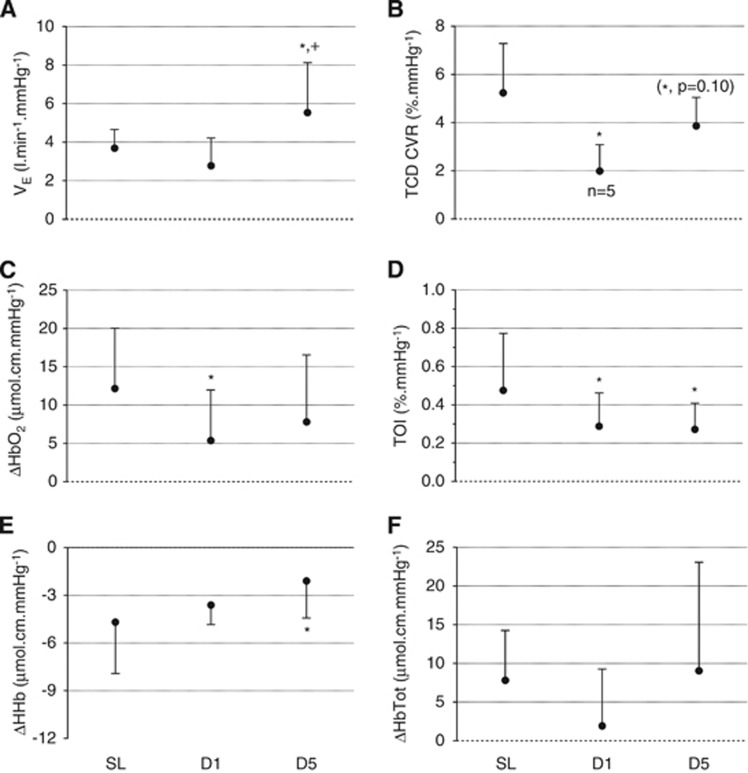
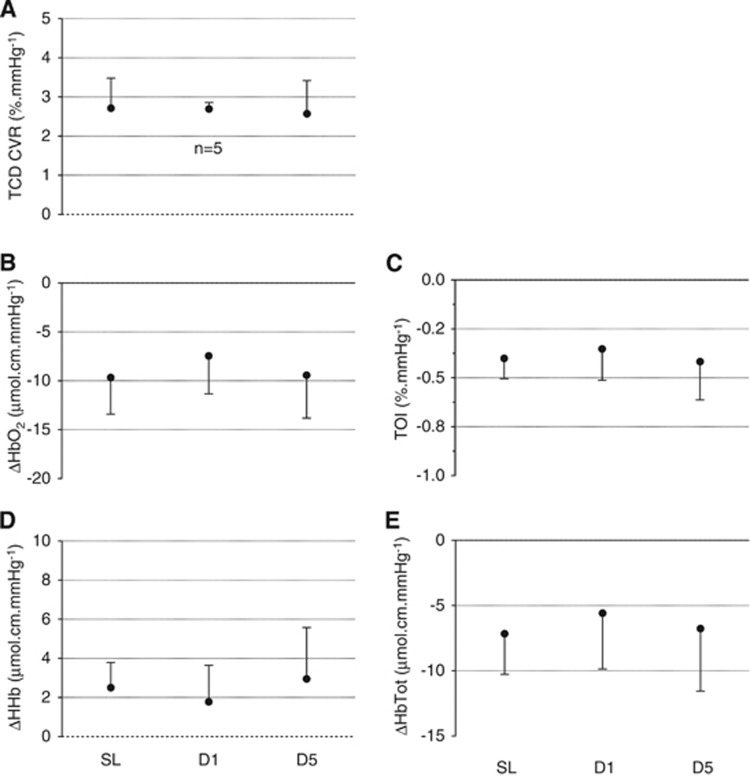
This study investigated the changes in cerebral near-infrared spectroscopy (NIRS) signals, cerebrovascular and ventilatory responses to hypoxia and CO2 during altitude exposure. At sea level (SL), after 24 hours and 5 days at 4,350 m, 11 healthy subjects were exposed to normoxia, isocapnic hypoxia, hypercapnia, and hypocapnia. The following parameters were measured: prefrontal tissue oxygenation index (TOI), oxy- (HbO2), deoxy- and total hemoglobin (HbTot) concentrations with NIRS, blood velocity in the middle cerebral artery (MCAv) with transcranial Doppler and ventilation. Smaller prefrontal deoxygenation and larger ΔHbTot in response to hypoxia were observed at altitude compared with SL (day 5: ΔHbO2-0.6±1.1 versus -1.8±1.3 μmol/cmper mm Hg and ΔHbTot 1.4±1.3 versus 0.7±1.1 μmol/cm per mm Hg). The hypoxic MCAv and ventilatory responses were enhanced at altitude. Prefrontal oxygenation increased less in response to hypercapnia at altitude compared with SL (day 5: ΔTOI 0.3±0.2 versus 0.5±0.3% mm Hg). The hypercapnic MCAv and ventilatory responses were decreased and increased, respectively, at altitude. Hemodynamic responses to hypocapnia did not change at altitude. Short-term altitude exposure improves cerebral oxygenation in response to hypoxia but decreases it during hypercapnia. Although these changes may be relevant for conditions such as exercise or sleep at altitude, they were not associated with symptoms of acute mountain sickness.
Figures
Similar articles
-
Impaired cerebrovascular CO2 reactivity at high altitude in prematurely born adults.J Physiol. 2024 Nov;602(21):5801-5815. doi: 10.1113/JP285048. Epub 2023 Dec 20. J Physiol. 2024. PMID: 38116893
-
Influence of sympathoexcitation at high altitude on cerebrovascular function and ventilatory control in humans.J Appl Physiol (1985). 2012 Oct;113(7):1058-67. doi: 10.1152/japplphysiol.00463.2012. Epub 2012 Jul 26. J Appl Physiol (1985). 2012. PMID: 22837165
-
Hypocapnia during hypoxic exercise and its impact on cerebral oxygenation, ventilation and maximal whole body O₂ uptake.Respir Physiol Neurobiol. 2013 Jan 15;185(2):461-7. doi: 10.1016/j.resp.2012.08.012. Epub 2012 Aug 24. Respir Physiol Neurobiol. 2013. PMID: 22922610
-
Regional Cerebrovascular Responses to Hypercapnia and Hypoxia.Adv Exp Med Biol. 2016;903:157-67. doi: 10.1007/978-1-4899-7678-9_11. Adv Exp Med Biol. 2016. PMID: 27343095 Review.
-
Impact of intermittent hypoxia on human vascular responses during sleep.Exp Neurol. 2022 Jan;347:113897. doi: 10.1016/j.expneurol.2021.113897. Epub 2021 Oct 13. Exp Neurol. 2022. PMID: 34655575 Review.
Cited by
-
Comparisons Between Normobaric Normoxic and Hypoxic Recovery on Post-exercise Hemodynamics After Sprint Interval Cycling in Hypoxia.Front Physiol. 2022 Mar 24;13:843574. doi: 10.3389/fphys.2022.843574. eCollection 2022. Front Physiol. 2022. PMID: 35399262 Free PMC article.
-
Effects of acute hypercapnia on cognitive function in patients undergoing bronchoscope intervention.J Thorac Dis. 2019 Mar;11(3):1065-1071. doi: 10.21037/jtd.2018.12.15. J Thorac Dis. 2019. PMID: 31019796 Free PMC article.
-
Effects of high-altitude exposure on supraspinal fatigue and corticospinal excitability and inhibition.Eur J Appl Physiol. 2017 Aug;117(8):1747-1761. doi: 10.1007/s00421-017-3669-y. Epub 2017 Jun 24. Eur J Appl Physiol. 2017. PMID: 28647868
-
Human cerebrovascular function in health and disease: insights from integrative approaches.J Physiol Anthropol. 2018 Feb 17;37(1):4. doi: 10.1186/s40101-018-0164-z. J Physiol Anthropol. 2018. PMID: 29454381 Free PMC article. Review.
-
Cerebrovascular reactivity is increased with acclimatization to 3,454 m altitude.J Cereb Blood Flow Metab. 2015 Aug;35(8):1323-30. doi: 10.1038/jcbfm.2015.51. Epub 2015 Mar 25. J Cereb Blood Flow Metab. 2015. PMID: 25806704 Free PMC article. Clinical Trial.
References
-
- Hornbein TF. The high-altitude brain. J Exp Biol. 2001;204:3129–3132. - PubMed
-
- Moller K, Paulson OB, Hornbein TF, Colier WN, Paulson AS, Roach RC, et al. Unchanged cerebral blood flow and oxidative metabolism after acclimatization to high altitude. J Cereb Blood Flow Metab. 2002;22:118–126. - PubMed
-
- Severinghaus JW, Chiodi H, Eger EI, 2nd, Brandstater B, Hornbein TF. Cerebral blood flow in man at high altitude. Role of cerebrospinal fluid pH in normalization of flow in chronic hypocapnia. Circ Res. 1966;19:274–282. - PubMed
-
- Jensen JB, Wright AD, Lassen NA, Harvey TC, Winterborn MH, Raichle ME, et al. Cerebral blood flow in acute mountain sickness. J Appl Physiol. 1990;69:430–433. - PubMed
-
- Ainslie PN, Ogoh S. Regulation of cerebral blood flow in mammals during chronic hypoxia: a matter of balance. Exp Physiol. 2009;95:251–262. - PubMed
Publication types
MeSH terms
Substances
LinkOut - more resources
Full Text Sources
Other Literature Sources
Medical
