

The role of the microcirculation in delayed cerebral ischemia and chronic degenerative changes after subarachnoid hemorrhage
- PMID: 24064495
- PMCID: PMC3851911
- DOI: 10.1038/jcbfm.2013.173
The role of the microcirculation in delayed cerebral ischemia and chronic degenerative changes after subarachnoid hemorrhage
Abstract
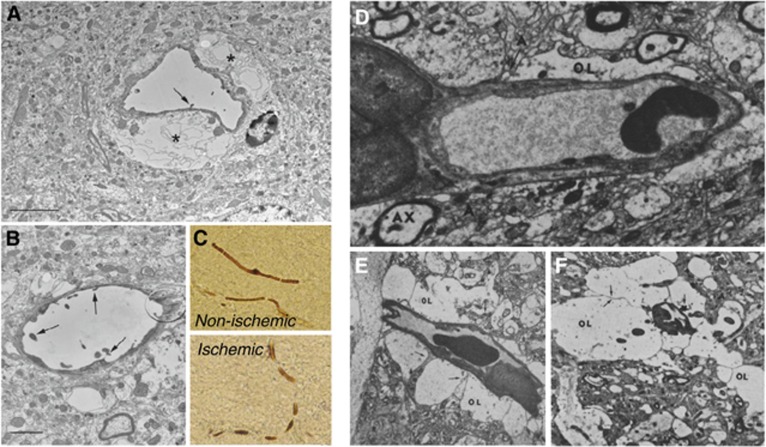
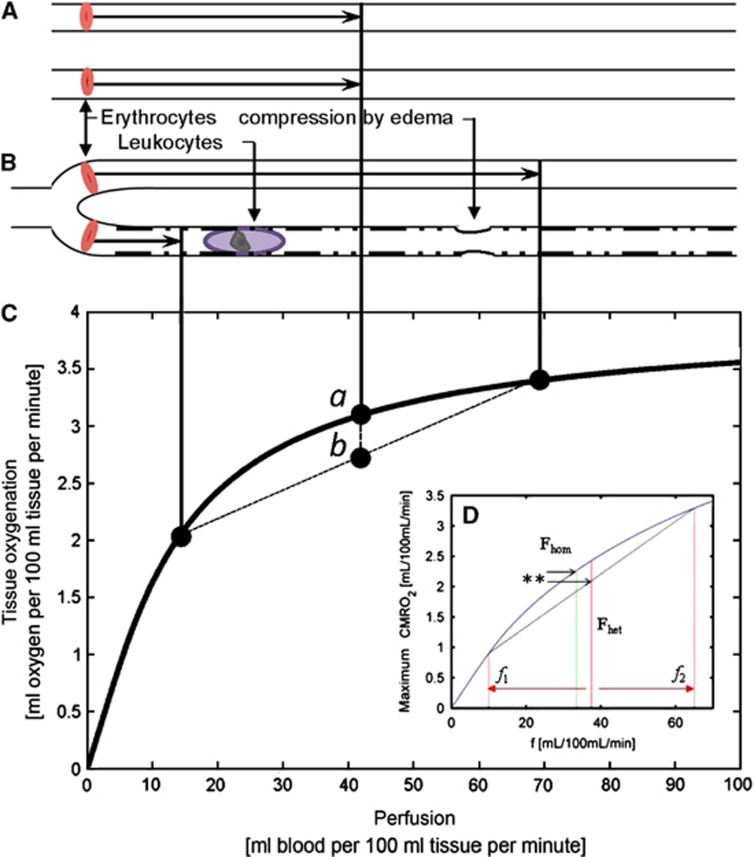
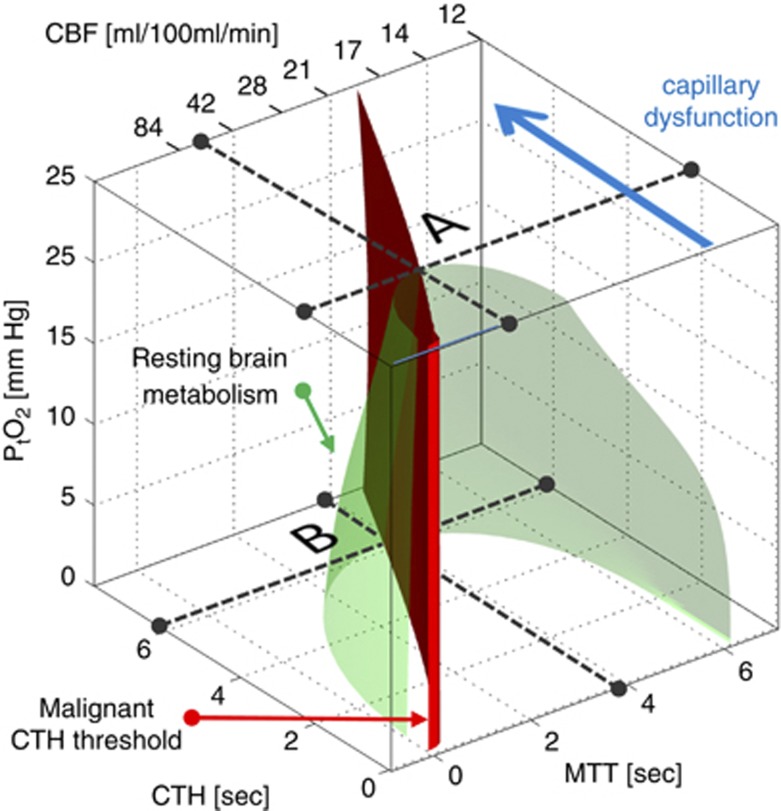
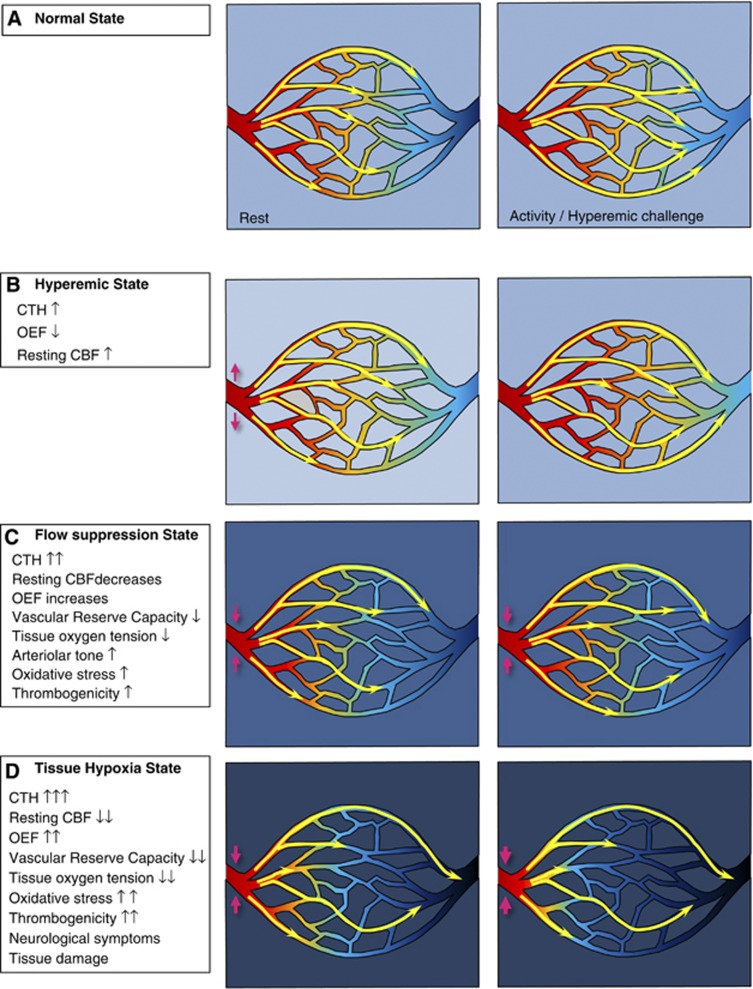
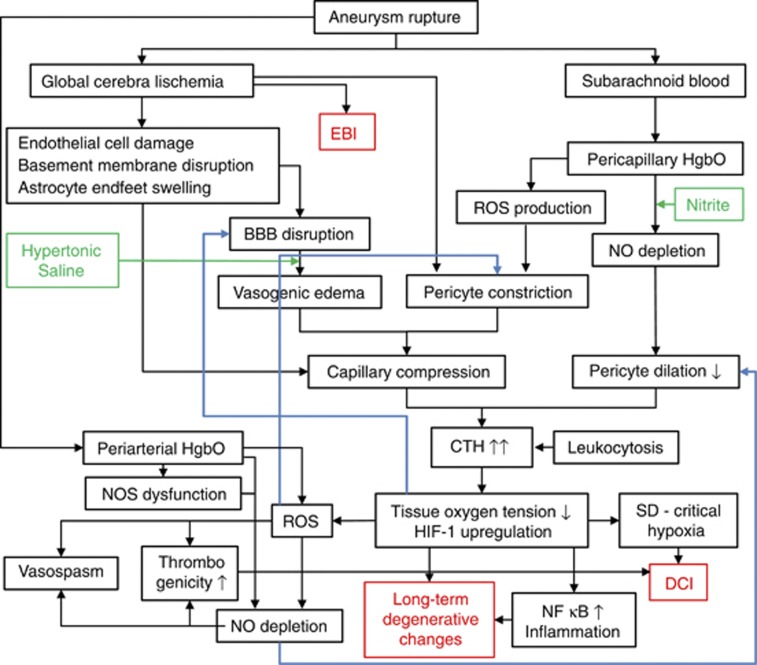
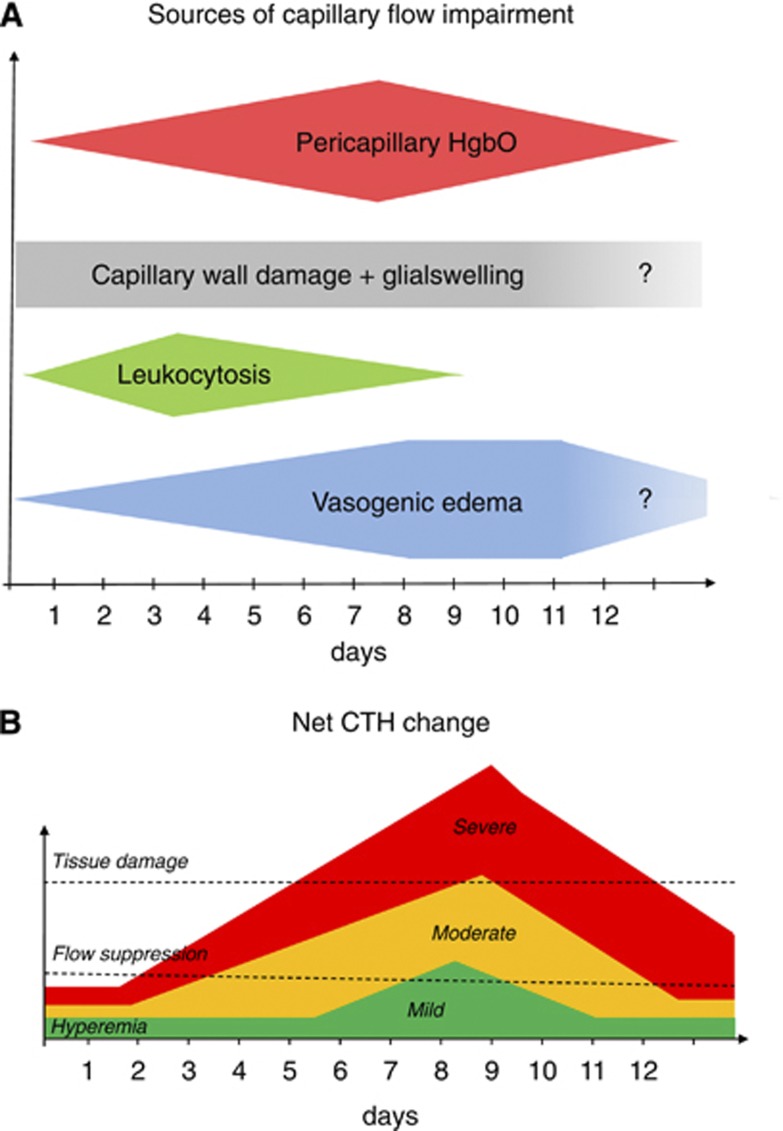
The mortality after aneurysmal subarachnoid hemorrhage (SAH) is 50%, and most survivors suffer severe functional and cognitive deficits. Half of SAH patients deteriorate 5 to 14 days after the initial bleeding, so-called delayed cerebral ischemia (DCI). Although often attributed to vasospasms, DCI may develop in the absence of angiographic vasospasms, and therapeutic reversal of angiographic vasospasms fails to improve patient outcome. The etiology of chronic neurodegenerative changes after SAH remains poorly understood. Brain oxygenation depends on both cerebral blood flow (CBF) and its microscopic distribution, the so-called capillary transit time heterogeneity (CTH). In theory, increased CTH can therefore lead to tissue hypoxia in the absence of severe CBF reductions, whereas reductions in CBF, paradoxically, improve brain oxygenation if CTH is critically elevated. We review potential sources of elevated CTH after SAH. Pericyte constrictions in relation to the initial ischemic episode and subsequent oxidative stress, nitric oxide depletion during the pericapillary clearance of oxyhemoglobin, vasogenic edema, leukocytosis, and astrocytic endfeet swelling are identified as potential sources of elevated CTH, and hence of metabolic derangement, after SAH. Irreversible changes in capillary morphology and function are predicted to contribute to long-term relative tissue hypoxia, inflammation, and neurodegeneration. We discuss diagnostic and therapeutic implications of these predictions.
Figures
Similar articles
-
Capillary flow disturbances after experimental subarachnoid hemorrhage: A contributor to delayed cerebral ischemia?Microcirculation. 2019 Apr;26(3):e12516. doi: 10.1111/micc.12516. Epub 2019 Mar 7. Microcirculation. 2019. PMID: 30431201
-
Role of endothelial nitric oxide synthase for early brain injury after subarachnoid hemorrhage in mice.J Cereb Blood Flow Metab. 2021 Jul;41(7):1669-1681. doi: 10.1177/0271678X20973787. Epub 2020 Nov 30. J Cereb Blood Flow Metab. 2021. PMID: 33256507 Free PMC article.
-
Ultra-early Detection of Microcirculatory Injury as Predictor of Developing Delayed Cerebral Ischemia After Aneurysmal Subarachnoid Hemorrhage.Clin Neuroradiol. 2018 Dec;28(4):501-507. doi: 10.1007/s00062-017-0616-6. Epub 2017 Aug 15. Clin Neuroradiol. 2018. PMID: 28812108
-
Circulatory and vascular changes after aneurysmal subarachnoid hemorrhage.J Neurosurg Sci. 2011 Dec;55(4):329-41. J Neurosurg Sci. 2011. PMID: 22198585 Review.
-
Delayed cerebral ischemia after subarachnoid hemorrhage: from vascular spasm to cortical spreading depolarizations.Curr Neurovasc Res. 2012 Nov;9(4):310-9. doi: 10.2174/156720212803530663. Curr Neurovasc Res. 2012. PMID: 22873726 Review.
Cited by
-
Different effects of arginine vasopressin on high-mobility group box 1 expression in astrocytes isolated from stroke-prone spontaneously hypertensive rats and congenic SHRpch1_18 rats.Int J Exp Pathol. 2016 Apr;97(2):97-106. doi: 10.1111/iep.12172. Epub 2016 Apr 29. Int J Exp Pathol. 2016. PMID: 27126918 Free PMC article.
-
The yin and yang of KV channels in cerebral small vessel pathologies.Microcirculation. 2018 Jan;25(1):10.1111/micc.12436. doi: 10.1111/micc.12436. Microcirculation. 2018. PMID: 29247493 Free PMC article. Review.
-
The protective effect of low-dose minocycline on brain microvascular ultrastructure in a rodent model of subarachnoid hemorrhage.Histochem Cell Biol. 2023 Jan;159(1):91-114. doi: 10.1007/s00418-022-02150-9. Epub 2022 Sep 24. Histochem Cell Biol. 2023. PMID: 36153470 Free PMC article.
-
The blood-brain barrier and the neurovascular unit in subarachnoid hemorrhage: molecular events and potential treatments.Fluids Barriers CNS. 2022 Apr 11;19(1):29. doi: 10.1186/s12987-022-00312-4. Fluids Barriers CNS. 2022. PMID: 35410231 Free PMC article. Review.
-
Laminar perfusion imaging with zoomed arterial spin labeling at 7 Tesla.Neuroimage. 2021 Dec 15;245:118724. doi: 10.1016/j.neuroimage.2021.118724. Epub 2021 Nov 12. Neuroimage. 2021. PMID: 34780918 Free PMC article.
References
-
- van Gijn J, Kerr RS, Rinkel GJ. Subarachnoid haemorrhage. Lancet. 2007;369:306–318. - PubMed
-
- Linn FH, Rinkel GJ, Algra A, van Gijn J. Incidence of subarachnoid hemorrhage: role of region, year, and rate of computed tomography: a meta-analysis. Stroke. 1996;27:625–629. - PubMed
-
- Hop JW, Rinkel GJ, Algra A, van Gijn J. Case-fatality rates and functional outcome after subarachnoid hemorrhage: a systematic review. Stroke. 1997;28:660–664. - PubMed
-
- Al-Khindi T, Macdonald RL, Schweizer TA. Cognitive and functional outcome after aneurysmal subarachnoid hemorrhage. Stroke. 2010;41:e519–e536. - PubMed
-
- Broderick JP, Brott TG, Duldner JE, Tomsick T, Leach A. Initial and recurrent bleeding are the major causes of death following subarachnoid hemorrhage. Stroke. 1994;25:1342–1347. - PubMed
Publication types
MeSH terms
LinkOut - more resources
Full Text Sources
Other Literature Sources
Medical
