. 2013:4:2384.
doi: 10.1038/ncomms3384.

Microbiome remodelling leads to inhibition of intestinal farnesoid X receptor signalling and decreased obesity

Affiliations

Microbiome remodelling leads to inhibition of intestinal farnesoid X receptor signalling and decreased obesity

Fei Li et al. Nat Commun. 2013.

Abstract

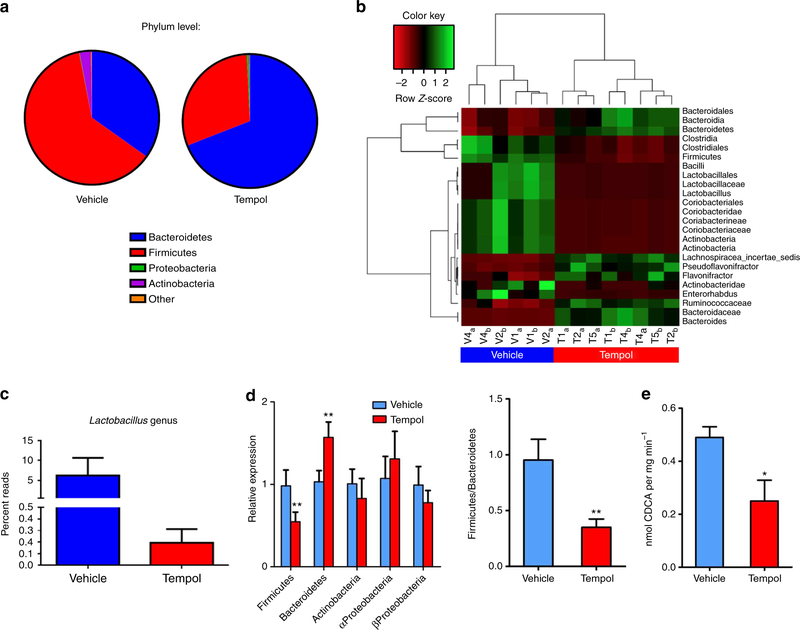
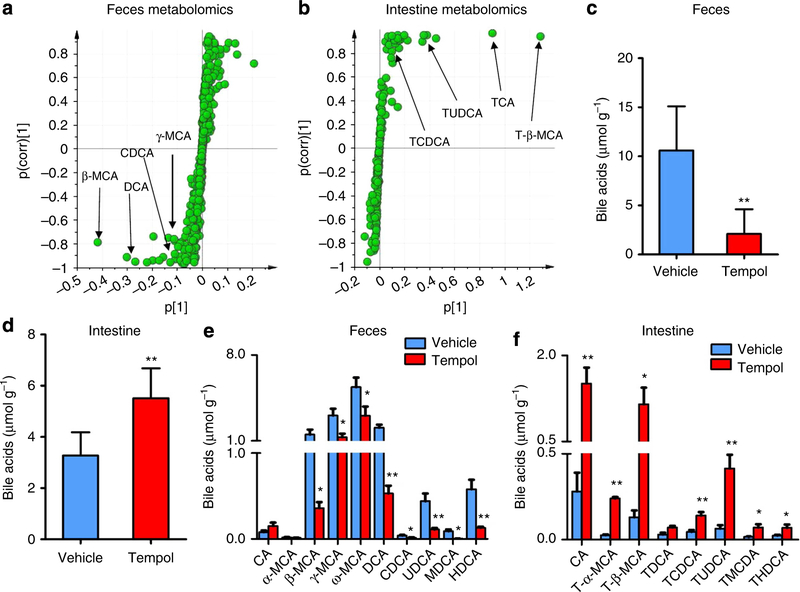
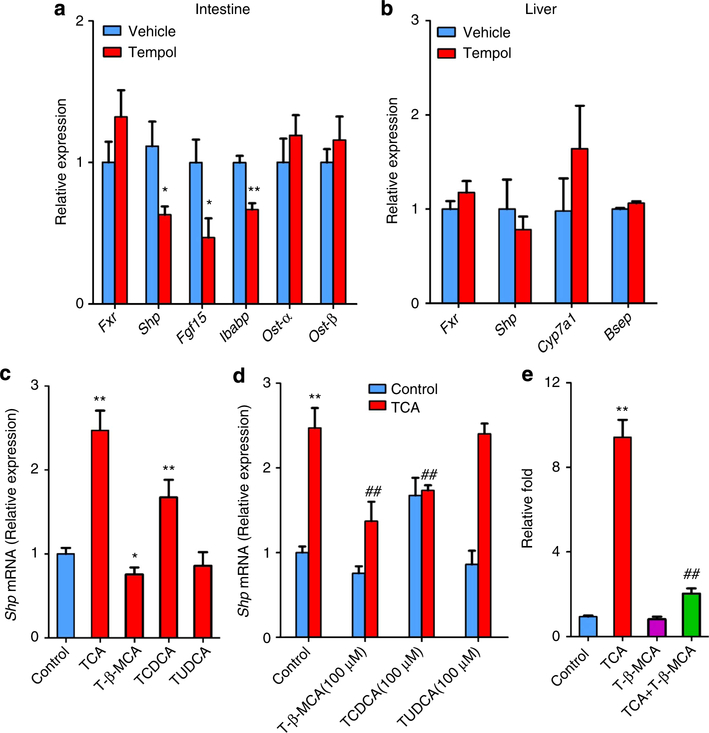
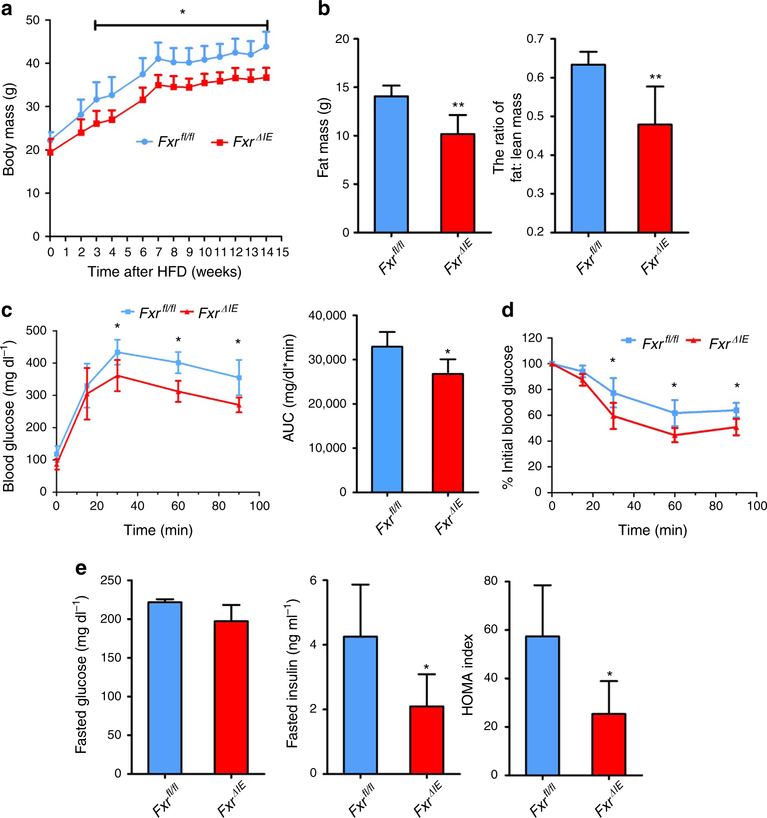
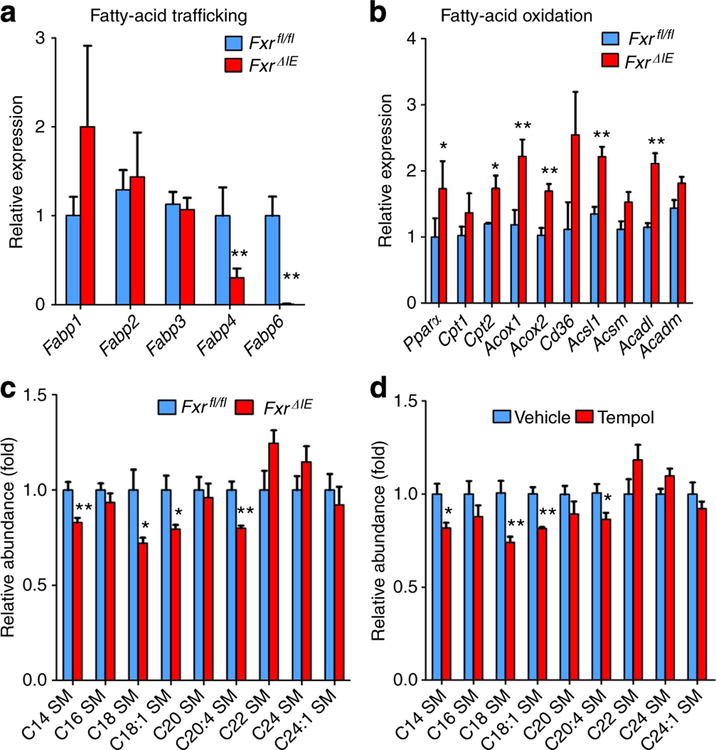
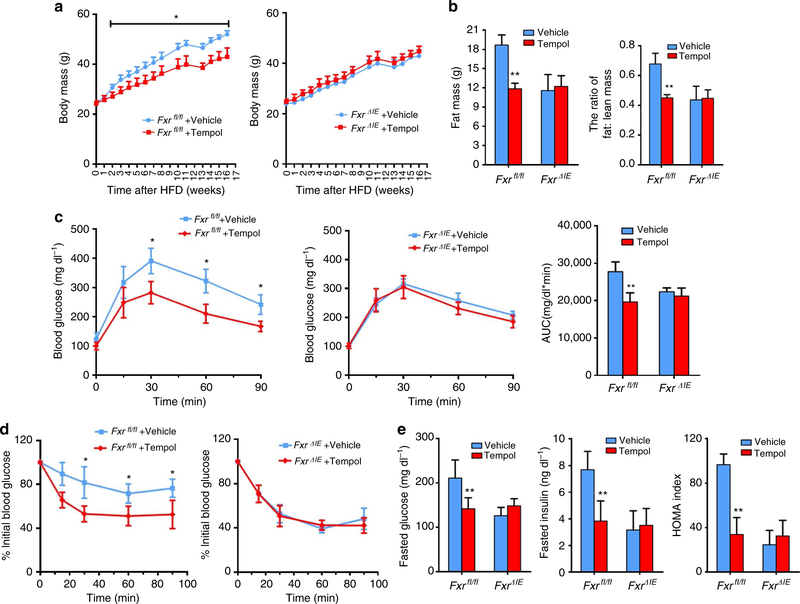
The antioxidant tempol reduces obesity in mice. Here we show that tempol alters the gut microbiome by preferentially reducing the genus Lactobacillus and its bile salt hydrolase (BSH) activity leading to the accumulation of intestinal tauro-β-muricholic acid (T-β-MCA). T-β-MCA is an farnesoid X receptor (FXR) nuclear receptor antagonist, which is involved in the regulation of bile acid, lipid and glucose metabolism. Its increased levels during tempol treatment inhibit FXR signalling in the intestine. High-fat diet-fed intestine-specific Fxr-null (Fxr(ΔIE)) mice show lower diet-induced obesity, similar to tempol-treated wild-type mice. Further, tempol treatment does not decrease weight gain in Fxr(ΔIE) mice, suggesting that the intestinal FXR mediates the anti-obesity effects of tempol. These studies demonstrate a biochemical link between the microbiome, nuclear receptor signalling and metabolic disorders, and suggest that inhibition of FXR in the intestine could be a target for anti-obesity drugs.


Conflict of interest statement

Competing financial interests: The authors declare no competing financial interests.

Figures

Figure 1 |
Figure 1 |. Tempol treatment induces gut micriobiome robust shifts.
(a) 16S rRNA gene sequencing analysis at the phylum levels of caecum content after 5 days of tempol treatment by gavage (250 mg kg−1). n = 3 per vehicle group, n = 4 per tempol group. (b) The heat map of 16S rRNA gene sequencing analysis of caecum content after 5 days of tempol treatment by gavage (250 mg kg−1). The scale: green colours indicate high values, whereas red colours indicate low values for the percent of reads that were classified at that rank. (c) 16S rRNA gene sequencing analysis of genus Lactobacillus caecum content after 5 days of tempol treatment by gavage (250 mg kg−1). n = 3 per vehicle group, n = 4 per tempol group. Data are presented as mean ± s.d. (d) qPCR analysis of phylum-level modifications from 16S rRNA of fecal microbiome after tempol treatment on a HFD for 12 weeks. n = 5 mice per group. Data are presented as mean ± s.d., ANOVA followed by two-tailed Student’s t-test. **P<0.01 compared with vehicle-treated mice. (e) Fecal BSH enzyme activity on vehicle- and tempol-treated mice on a HFD for 12 weeks. n = 5 mice per group. All data are presented as mean ± s.d., ANOVA followed by two-tailed Student’s t-test. *P<20.05, **P<0.01 compared with vehicle-treated mice.
Figure 2 |
Figure 2 |. Metabolomics analysis identifies the alteration of bile-acid composition by tempol.
(a) Scatter plot of PLS-DA of fecal ions from vehicle and tempol treatment in HFD-fed mice. Each point represents an individual mouse fecal ion. The labelled ions were identified as β-MCA, DCA, CDCA and γ-MCA, which were decreased by tempol treatment. The p(corr)[1] P-values represent the interclass difference and p[1] P-values represent the relative abundance of the ions. All data were obtained in negative mode (ESI -). (b) Scatter plot of PLS-DA of intestinal ions from vehicle and tempol treatment on a HFD-fed mice. Each point represents an individual mouse intestinal ion. The labelled ions are identified to be T-β-MCA, TCA, TUDCA and TCDCA, which were increased by tempol treatment. The p(corr)[1] values represent the interclass difference and p[1] values represent the relative abundance of the ions. All data are obtained in negative mode (ESI —). (c) Total level of bile acid in feces of the vehicle and tempol group on a HFD for 12 weeks. n =5 mice per group. (d) Total level of bile acid in the intestine of vehicle and tempol group on a HFD for 17 weeks. n = 5 mice per group. (e) Bile-acid composition in fecesof the vehicle and tempol group on a HFD for 12 weeks. n = 5 mice per group. (f) Bile-acid composition in the intestine of vehicle and tempol group on a HFD for 17 weeks. n = 5 mice per group. The total bile acids were quantified by bile-acid kit and bile-acid composition was determined using UPLC-ESI-QTOFMS. All data are presented as mean±s.d., ANOVA followed by two-tailed Student’s t-test. *P<0.05, **P<0.01 compared with vehicle-treated mice.
Figure 3 |
Figure 3 |. T-β-MCA inhibits the FXR signalling pathway.
(a) mRNA levels of FXR target genes in the intestine on vehicle- and tempol-treated mice on a HFD. Expression was normalized to 18S RNA. n = 5 mice per group. All data are presented as mean ± s.d., ANOVA followed by two-tailed Student’s t-test. *P<0.05, **P<0.01 compared with vehicle-treated mice. (b) mRNA levels of FXR target genes in the liver on vehicle- and tempol-treated mice on a HFD. Expression was normalized to 18S RNA. n = 5 mice per group. Data are presented as mean ± s.d., ANOVA followed by two-tailed Student’s t-test. *P<0.05, **P<0.01 compared with vehicle-treated mice. (c) Shp mRNA expression of primary hepatocytes after treatment with 100μM TCA, T-β-MCA, TCDCA and TUDCA (n = 4). Expression was normalized to 18S RNA. All data are presented as mean ± s.d., ANOVA followed by two-tailed Student’s t-test. *P< 0.05, **P<0.01 compared with control. (d) Shp mRNA expression of primary hepatocytes after exposure to 100 μM T-β-MCA, TCDCA or TUDCA with100 μM TCA (n = 4). Expression was normalized to 18S RNA. All data are presented as mean ± s.d., ANOVA followed by one-way ANOVA with Dunnett’s test. **P<0.01 compared with control, ##P<0.01 compared with TCA (100 μM) treatment. (e) Luciferase assays of the inhibition of FXR by T-β-MCA in CaCo2 cells. CaCo2 cells are transfected with a PGL4-Shp-TK firefly luciferase construct, the control plasmid phRL-SV40, human FXR and human ASBTexpression plasmids. After 24 h, the cells are treated with 100 μM TCA, T-β-MCA or T-β-MCA with 100 μM TCA. n = 4. All data are presented as mean ± s.d., ANOVA followed by one-way ANOVA with Dunnett’s test. **P<0.01 compared with control, ##P<0.01 compared with TCA treatment.
Figure 4 |
Figure 4 |. Intestine-specific FXR knockout mice are resistant to obesity and insulin resistance.
(a) Typical growth curves of the mice maintainedon a HFD. n = 5 mice per group. (b) The fat mass and fat mass to lean mass ratio of the mice on 6 weeks of HFD. n = 5 mice per group. (c) GTTand the area under the curve on 7 weeks of HFD. n = 5 mice per group. (d) ITT on 13 weeks of HFD. n = 5 mice per group. (e) Fasted glucose, fasted serum insulin levels and homoeostasis model assessment index on 14 weeks of HFD. n = 5 mice per group. All data are presented as mean ± s.d., ANOVA followed by two-tailed Student’s t-test. *P<0.05, **P<0.01 compared with Fxrfl/fl mice.
Figure 5 |
Figure 5 |. Intestine-specific FXR deletion increases lipid oxidation and decreases serum sphingolipids.
(a) qPCR analysis of fatty-acid trafficking- related genes in the intestinal mucosa of Fxrfl/fl mice and FxrΔIE mice on a HFD for 14 weeks. Expression was normalized to 18S. n = 5 mice per group. (b) qPCR analysis of fatty-acid trafficking- and mobilization-related genes in the intestinal mucosa of Fxrfl/fl mice and FxrΔIE mice on a HFD for 14 weeks. Expression was normalized to 18S RNA. n = 5 mice per group. (c) Lipidomics profile of serum sphingomyelin (SM) of Fxrfl/fl mice and FxrΔIE mice on a HFD for 14 weeks. All data are presented as mean ± s.d., ANOVA followed by two-tailed Student’s t-test. *P<0.05, **P<0.01 compared with Fxrfl/fl mice. (d) Lipidomics profile of serum SM after tempol treatment on a HFD for 17 weeks. n = 5 mice per group. Data are presented as mean ± s.d., ANOVA followed by two-tailed Student’s t-test. *P<0.05, **P<0.01 compared with vehicle-treated mice.
Figure 6 |
Figure 6 |. The inhibition of intestinal FXR is crucial for tempol to improve metabolic profile.
(a) Growth curves of vehicle- and tempol-treated Fxrfl/fl mice and FxrΔIE mice on a HFD. n = 4−5 mice per group. (b) Body composition by NMR to show the fat mass (left) and fat mass to lean mass ratio (right) in vehicle- and tempol-treated mice on 13 weeks of HFD. n = 4−5 mice per group. (c) GTTand the area under the curve after 5 weeks of tempol-treated mice on a HFD. n = 4−5 mice per group. (d) ITT after 6 weeks of HFD. n = 4−5 mice per group. (e) Fasted glucose, fasted serum insulin levels and homoeostasis model assessment index after tempol treatment on a HFD for 16 weeks. n = 5 mice per group. All data are presented as mean ± s.d., ANOVA followed by one-way ANOVA with Tukey’s test. *P<0.05, **P<0.01 compared with vehicle-treated mice of the same genotype.

References

    1. Khandekar MJ, Cohen P & Spiegelman BM Molecular mechanisms of cancer development in obesity. Nat. Rev. Cancer 11, 886–895 (2011). - PubMed
    1. Li Y et al. Homocysteine upregulates resistin production from adipocytes in vivo and in vitro. Diabetes 57, 817–827 (2008). - PubMed
    1. Wadikar DD & Premavalli KS Appetite control and obesity. Crit. Rev. Food. Sci. Nutr 52, 949–956 (2012). - PubMed
    1. Soule BP et al. The chemistry and biology of nitroxide compounds. Free Radic. Biol. Med 42, 1632–1650 (2007). - PMC - PubMed
    1. Mitchell JB et al. The antioxidant tempol reduces carcinogenesis and enhances survival in mice when administered after nonlethal total body radiation. Cancer Res 72, 4846–4855 (2012). - PMC - PubMed

Publication types

MeSH terms