

Montreal prognostic score: estimating survival of patients with non-small cell lung cancer using clinical biomarkers
- PMID: 24064979
- PMCID: PMC3798950
- DOI: 10.1038/bjc.2013.515
Montreal prognostic score: estimating survival of patients with non-small cell lung cancer using clinical biomarkers
Abstract
Background: For evidence-based medical practice, well-defined risk scoring systems are essential to identify patients with a poor prognosis. The objective of this study was to develop a prognostic score, the Montreal prognostic score (MPS), to improve prognostication of patients with incurable non-small cell lung cancer (NSCLC) in everyday practice.
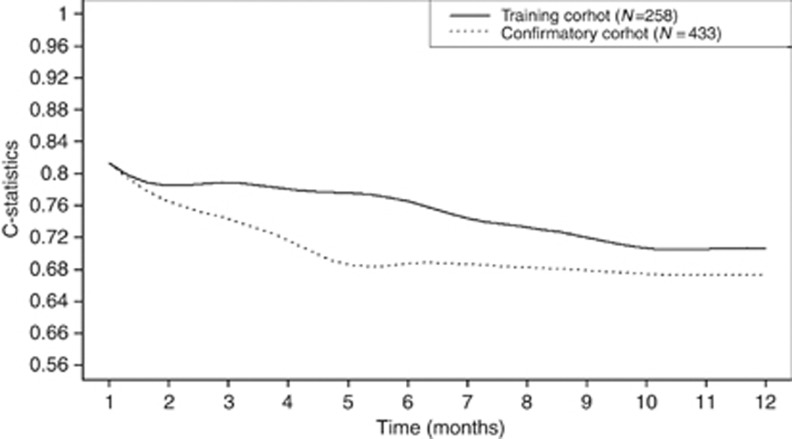
Methods: A training cohort (TC) and a confirmatory cohort (CC) of newly diagnosed patients with NSCLC planning to receive chemotherapy were used to develop the MPS. Stage and clinically available biomarkers were entered into a Cox model and risk weights were estimated. C-statistics were used to test the accuracy.
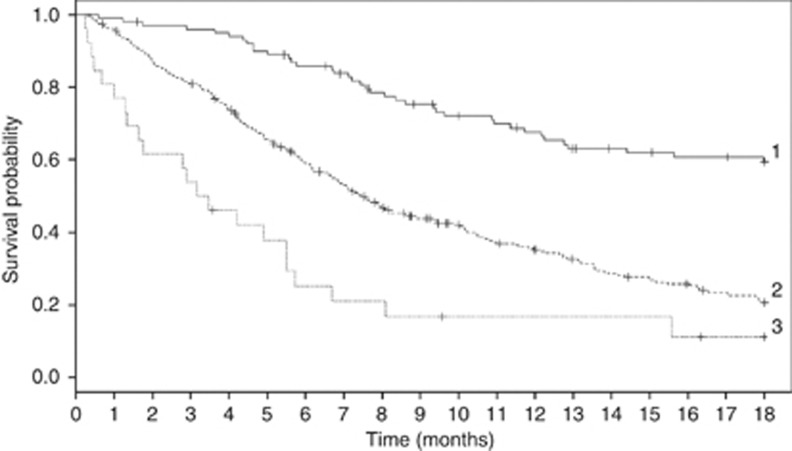
Results: The TC consisted of 258 patients and the CC consisted of 433 patients. Montreal prognostic score classified patients into three distinct groups with median survivals of 2.5 months (95% confidence interval (CI): 1.8, 4.2), 8.2 months (95% CI: 7.0, 9.4) and 18.2 months (95% CI: 14.0, 27.5), respectively (log-rank, P<0.001). Overall, the C-statistics were 0.691 (95% CI: 0.685, 0.697) for the TC and 0.665 (95% CI: 0.661, 0.670) for the CC.
Conclusion: The MPS, by classifying patients into three well-defined prognostic groups, provides valuable information, which physicians could use to better inform their patients about treatment options, especially the best timing to involve palliative care teams.
Figures
References
-
- Breiman L, Friedman J, Olshen R, Stone C. Classification and Regression Trees. Wadsworth International Group: Belmont, CA; 1984.
-
- Chow E, Abdolell M, Panzarella T, Harris KE, Bezjak A, Warde P, Tannock I. Predictive model for survival in patients with advanced cancer. J Clin Oncol. 2008;26 (36:5863–5869. - PubMed
Publication types
MeSH terms
Substances
Grants and funding
LinkOut - more resources
Full Text Sources
Other Literature Sources
Medical
