. 2013 Oct 16;32(20):2751-63.
doi: 10.1038/emboj.2013.203. Epub 2013 Sep 24.

IFNβ-dependent increases in STAT1, STAT2, and IRF9 mediate resistance to viruses and DNA damage

Affiliations

IFNβ-dependent increases in STAT1, STAT2, and IRF9 mediate resistance to viruses and DNA damage

HyeonJoo Cheon et al. EMBO J. .

Abstract

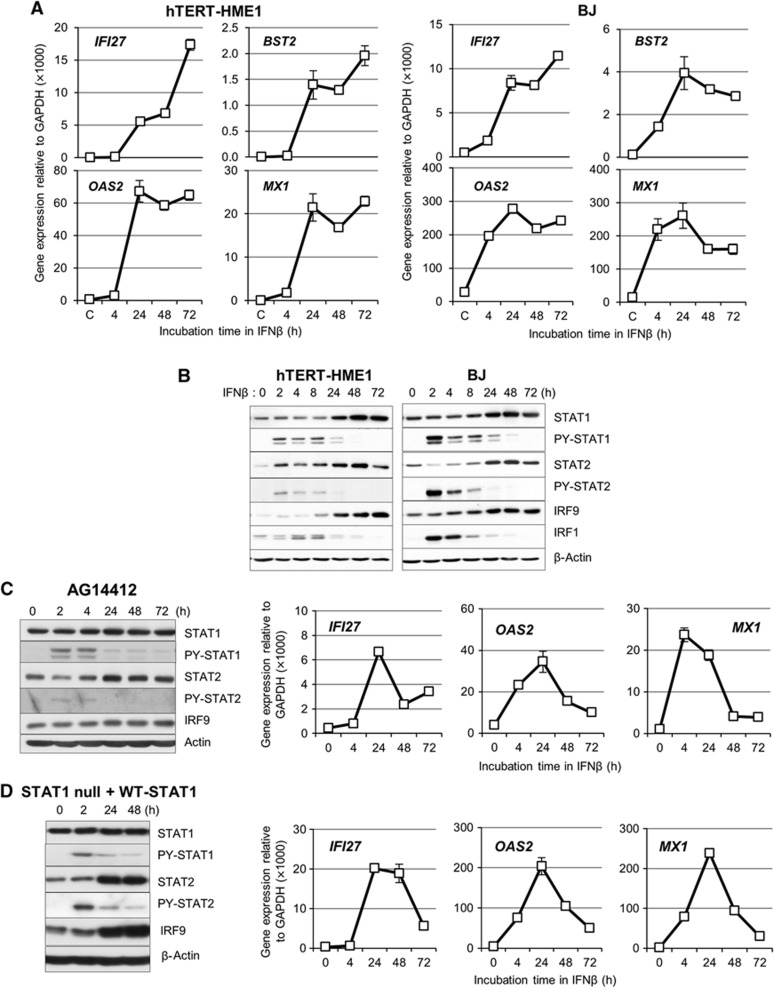
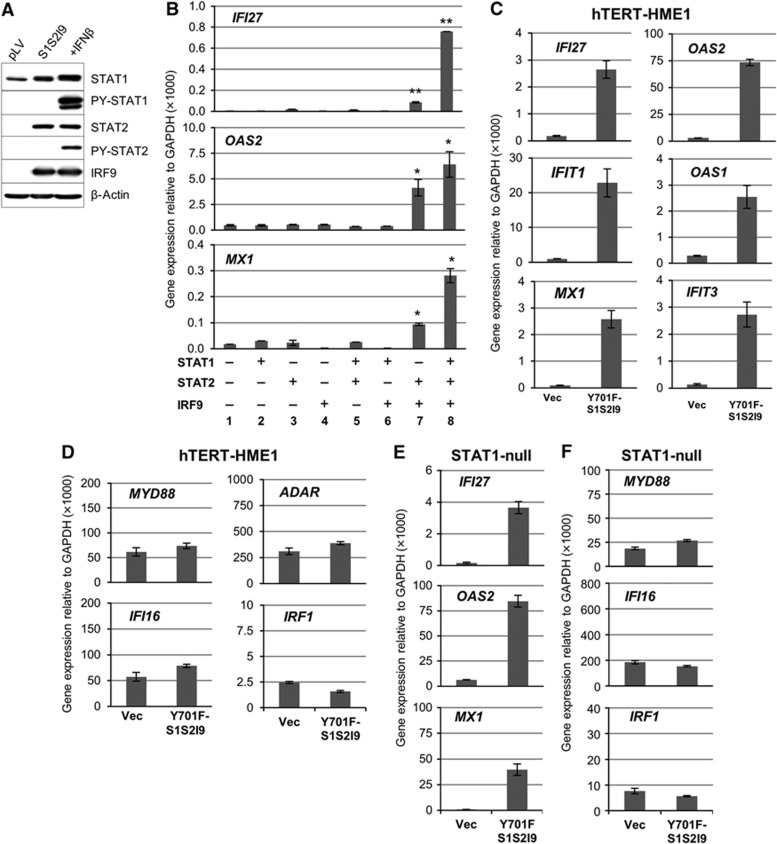
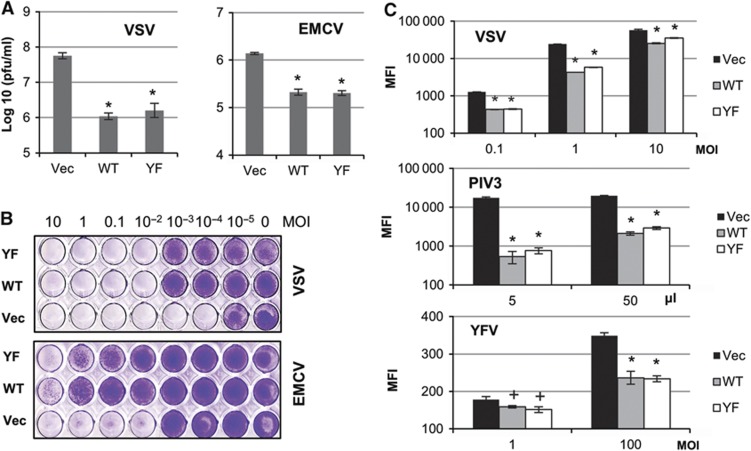
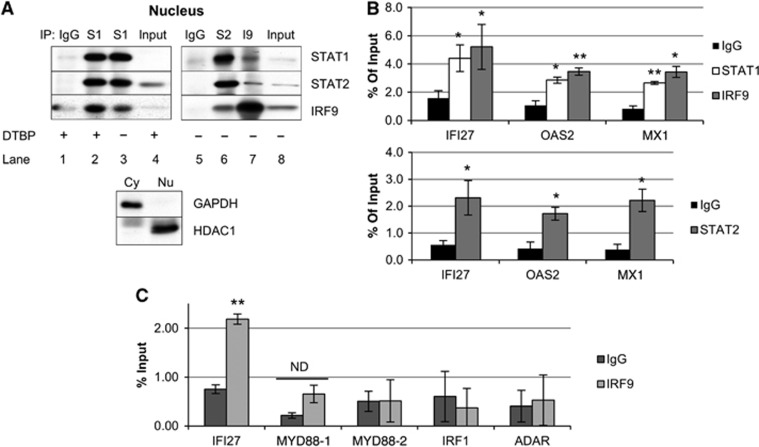
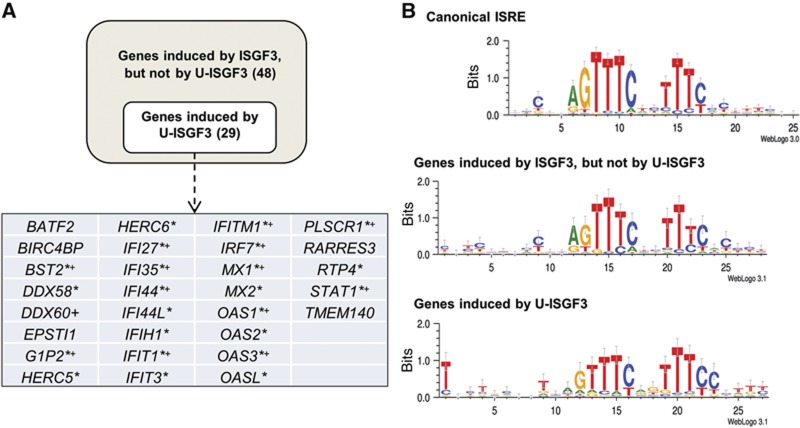
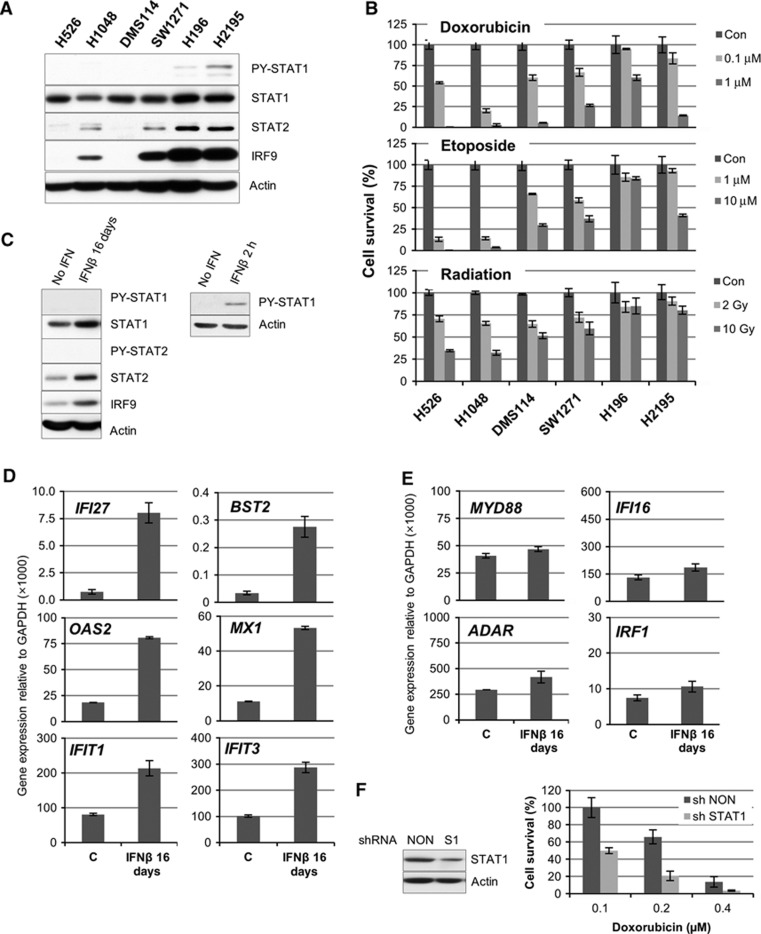
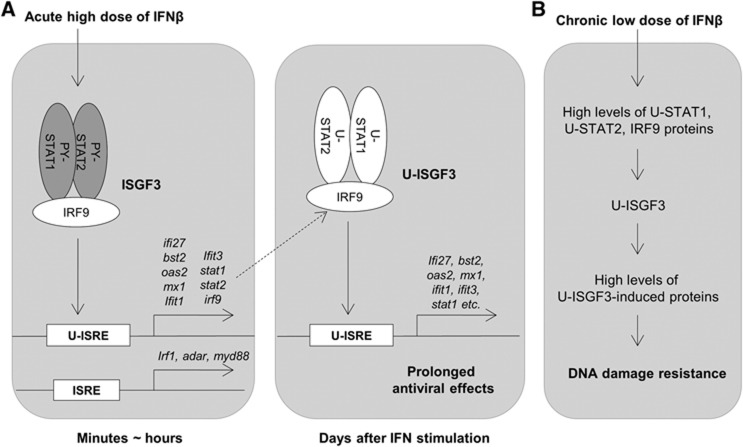
A single high dose of interferon-β (IFNβ) activates powerful cellular responses, in which many anti-viral, pro-apoptotic, and anti-proliferative proteins are highly expressed. Since some of these proteins are deleterious, cells downregulate this initial response rapidly. However, the expression of many anti-viral proteins that do no harm is sustained, prolonging a substantial part of the initial anti-viral response for days and also providing resistance to DNA damage. While the transcription factor ISGF3 (IRF9 and tyrosine-phosphorylated STATs 1 and 2) drives the first rapid response phase, the related factor un-phosphorylated ISGF3 (U-ISGF3), formed by IFNβ-induced high levels of IRF9 and STATs 1 and 2 without tyrosine phosphorylation, drives the second prolonged response. The U-ISGF3-induced anti-viral genes that show prolonged expression are driven by distinct IFN stimulated response elements (ISREs). Continuous exposure of cells to a low level of IFNβ, often seen in cancers, leads to steady-state increased expression of only the U-ISGF3-dependent proteins, with no sustained increase in other IFNβ-induced proteins, and to constitutive resistance to DNA damage.


Conflict of interest statement

The authors declare that they have no conflict of interest.

Figures

Figure 1
Figure 1
The expression of anti-viral genes is sustained for several days after IFN stimulation, along with increased levels of the STAT1, STAT2, and IRF9 proteins. (A) The expression of the anti-viral genes IFI27, BST2, OAS2, and MX1 was analysed by real-time PCR after stimulation of hTERT-HME1 or BJ cells with IFNβ (3 IU/ml). The levels of gene expression were calculated semi-quantitatively by using the ΔΔCt method (see Materials and methods). The data are represented as means of triplicate PCR analyses±standard deviations (s.d.). (B) hTERT-HME1 or BJ cells were treated with IFNβ (50 IU/ml) and the levels of total IRF9 and STATs 1 and 2, or tyrosine-phosphorylated STATs 1 and 2 (PY-701-STAT1 or PY-690-STAT2) were analysed by the western method. (C, D) AG14412 umbilical fibroblasts (C) and STAT1-null fibroblasts transfected with the lentiviral vector containing wild-type STAT1 (D) were used. Left, Cells were treated with IFNβ (50 IU/ml) and the levels of total IRF9, STAT1, and STAT2, or tyrosine-phosphorylated STATs (PY-701-STAT1 or PY-690-STAT2) were analysed by the western method. Right, the expression of the IFI27, OAS2, and MX1 genes was analysed by real-time PCR after stimulation with IFNβ (3 IU/ml). The levels of gene expression were calculated semi-quantitatively by using the ΔΔCt method. The data are represented as means of triplicate PCR analyses±s.d. Source data for this figure is available on the online supplementary information page.
Figure 2
Figure 2
High levels of STAT1, STAT2, and IRF9 proteins are necessary and sufficient for the induction of some anti-viral genes without IFN-induced phosphorylation. (A) The phosphorylation status of STAT1 (Y701) and STAT2 (Y690) was examined in hTERT-HME1 cells transfected with empty pLV vector or pLV-STAT1, -STAT2, and -IRF9 together (S1S2I9). As a positive control, S1S2I9 cells were treated with 500 IU/ml of IFNβ for 1 h. (B) The expression of the indicated genes was measured by real-time PCR in hTERT-HME1 cells stably transfected with various combinations of STAT1, STAT2, and IRF9 in the lentiviral vector pLV. The levels of gene expression were calculated semi-quantitatively by using the ΔΔCt method. The data are represented as means of triplicate PCR analyses±s.d. ** represents P<0.01 and * represents P<0.05 by two-tailed t-test, compared to vector-transfected controls (column 1). (C, D) The expression of the indicated genes was measured by real-time PCR in hTERT-HME1 cells stably transfected with empty pLV vector (Vec), or pLV-Y701F-STAT1, pLV-STAT2, and pLV-IRF9 together (YF-S1S2I9). The levels of gene expression were calculated semi-quantitatively by using the ΔΔCt method. The data are represented as means of triplicate PCR analyses±s.d. (E, F) STAT1-null fibroblasts were stably transfected with empty pLV vector (Vec), or pLV-Y701F-STAT1, pLV-STAT2, and pLV-IRF9 together (YF-S1S2I9). The expression of the indicated genes was measured by real-time PCR. The levels of gene expression were calculated semi-quantitatively by using the ΔΔCt method. The data are represented as means of triplicate PCR analyses±s.d. Source data for this figure is available on the online supplementary information page.
Figure 3
Figure 3
High levels of STAT1, STAT2, and IRF9 proteins protect cells from various RNA viruses in an IFN-independent manner. hTERT-HME1 cells transfected with empty vector (Vec), wild-type STAT1/STAT2/IRF9 (WT) or Y701F-STAT1/STAT2/IRF9 (YF) were used. (A) Cells were infected with 0.1 MOI of VSV or 1 MOI of EMCV, and the infected cells and cell-culture media were collected after 10 h (VSV) or 6 h (EMCV). The infectious viral titres in the collected samples were analysed by plaque assays on Vero cells. The data are represented as means of triplicate infections±s.d. An asterisk (*) represents P<0.01, by two-tailed t-test, compared to cells transfected with empty vector (Vec). (B) Cells were infected with VSV or EMCV (10–10−5 MOI). After 48 h, the surviving cells were fixed with methanol (VSV) or 4% paraformaldehyde (EMCV) and stained with crystal violet. (C) Cells were infected with recombinant viral constructs (VSV, PIV3, or YFV) expressing GFP. After 8 h (VSV) or 48 h (PIV3 or YFV), GFP fluorescence was monitored by FACS analyses. The data are represented as mean GFP intensities (MFI)±s.d. of triplicate infections. An asterisk (*) represents P<0.01 and a cross (+) represents P<0.05, by two-tailed t-test, compared to Vec cells.
Figure 4
Figure 4
U-STAT1, U-STAT2, and IRF9 form U-ISGF3, which binds to ISREs on the target gene promoters. hTERT-HME1 cells expressing high levels of U-STAT1, U-STAT2, and IRF9 without IFN stimulation were analysed by co-immunoprecipitation (Co-IP) and chromatin-immunoprecipitation (ChIP) assays. (A) Nuclear proteins were used for Co-IP with normal rabbit IgG or rabbit polyclonal antibodies against STAT1, STAT2, or IRF9. To stabilize protein–protein interactions, the nuclear fraction was treated with the cleavable cross-linker, dimethyl-3,3′-dithiobis-propinimidate (DTBP, lanes 1, 2, and 4). Mouse monoclonal antibodies against STAT1, STAT2, or IRF9 were used for the western method. The purity of the fractions was assessed by determining the levels of GAPDH (a cytoplasmic protein) and HDAC1 (a nuclear protein) in the input lysates by the western method. (B, C) Total protein lysates were cross-linked with 1% formaldehyde and the cell lysates were cross-linked with DTBP. Chromatin was sheared into <1 kb lengths by sonication. Rabbit polyclonal antibodies against STAT1, STAT2, or IRF9, or comparable amounts of normal rabbit IgG, were used for immunoprecipitations. Real-time PCR was performed to amplify the precipitated DNAs with primer pairs spanning ISREs in the promoters of IFI27, OAS2, MX1, MYD88, IRF1, and ADAR genes. MYD88-1 and -2 mean 2 different ISREs in the promoter of MYD88 gene. The amount of amplified DNA was calculated by using the standard curve method. The values (% input) are the percentages of DNA amount in immunoprecipitated samples compared to 2% input DNA. The data are represented as means of triplicate PCR analyses±s.d. ** represents P<0.01 and * represents P<0.05, by two-tailed t-test, compared to the IgG control. ND, not different statistically (P>0.05, by two-tailed t-test). Source data for this figure is available on the online supplementary information page.
Figure 5
Figure 5
U-ISGF3-induced genes have distinct ISREs. (A) BJ cells were treated with 3 IU/ml of IFNβ for 6 h, followed by microarray analyses for the expression of IFNβ-induced genes. To identify the U-ISGF3-induced genes, the cells were stably transfected with a lentiviral vector encoding Y701F-STAT1, without IFN treatment. The analysis criteria are described in ‘Materials and methods’. The genes marked with asterisks (*) are those with known anti-viral functions, and those marked with crosses (+) are known to be upregulated in DNA damage-resistant cancer cells. DDX58 is also known as RIG-I, and IFIH1 is known as MDA5. DDX60 and TMEM140 are newer names for FLJ20035 and FLJ11000, respectively. (B) The ISRE sites in promoter regions (2500 base pairs upstream and 500 base pair downstream from the annotated transcription start sites) of 48 genes induced by ISGF3 and not by U-ISGF3 (listed in Supplementary Table S1), and those of 29 genes induced by U-ISGF3 were analysed and the results were visualized using the WebLogo software. The canonical ISRE shown in the top panel is annotated in Transfac as a standard sequence. The conserved ISRE sequences of the U-ISGF3-induced genes (bottom panel) are statistically different from the sequences of the genes induced by ISGF3 but not by U-ISGF3 (middle panel), applying symmetrized, position-averaged Kullback-Leibler distance (P<0.05).
Figure 6
Figure 6
U-ISGF3 induced by chronic exposure to IFNβ confers resistance to DNA damage. (A) The expression of PY-701- or total STAT1, PY-690- or total STAT2, and total IRF9 was examined by the western method in six different small cell lung carcinoma cell lines. A signal for PY-690-STAT2 was not detected in any lane. (B) The six cell lines were treated with doxorubicin, etoposide, or radiation at the indicated doses. After 72 h, cell viability was assessed by using an Alamar Blue assay. Cell numbers were determined by generating standard curves with known numbers of untreated cells. The values are percentages of the number of treated cells compared to untreated cells. The data are represented as means of triplicate Alamar Blue assays±s.d. (C) BJ cells were treated with 0.5 U/ml of IFNβ every other day for 16 days (left panel) or 2 h (right panel), and the levels of total and tyrosine-phosphorylated proteins (PY-701-STAT1 or PY-690-STAT2) were examined by the western method. (D, E) Total RNA was extracted from BJ cells treated with 0.5 IU/ml of IFNβ every other day for 16 days. The expression of U-ISGF3-induced genes (IFI27, BST2, OAS2, MX1, IFIT1, and IFIT3) and other ISGs (MYD88, IFI16, ADAR, and IRF1) was examined by real-time PCR. The levels of gene expression were calculated semi-quantitatively by using the ΔΔCt method. The data are represented as means of triplicate PCR analyses±s.d. (F) BJ cells were infected with an shRNA targeting STAT1 (S1) or a non-targeted shRNA (NON) and the levels of STAT1 protein expression were examined by the western method. The cells were treated with doxorubicin and their viability was assessed after 72 h by using an Alamar Blue assay. Cell numbers were determined by generating standard curves with known numbers of untreated cells. The values are percentages of the numbers of treated cells compared to untreated cells. The data are represented as means of triplicate of Alamar Blue assays±s.d. Source data for this figure is available on the online supplementary information page.
Figure 7
Figure 7
Biological significance of U-ISGF3-induced gene expression. (A) U-ISGF3 prolongs anti-viral effects. IFNβ induces the expression of a large number of ISGs (>100 genes) within minutes to hours through the action of ISGF3 (PY-701-STAT1, PY-690-STAT2, and IRF9), which binds to standard ISREs in ISG promoters. ISGs induced by an initial treatment with IFNβ include STAT1, STAT2, and IRF9, and the encoded proteins accumulate in their unphosphorylated forms for days after IFN stimulation. The accumulated STAT1, STAT2, and IRF9 proteins form U-ISGF3, which selectively binds to the distinct ISREs in promoters of a subset of ISGs (about 30 genes), most of which are anti-viral genes. The expression of these genes is prolonged, whereas the expression of the genes induced by ISGF3, but not by U-ISGF3, is terminated rapidly. (B) U-ISGF3 induces resistance to DNA damage. Chronic exposure to low doses of IFNβ increases the levels of U-ISGF3 and the U-ISGF3-induced proteins, with no increase in STAT phosphorylation. The proteins induced by U-ISGF3 increase resistance to DNA damage.

References

    1. Andersen JB, Hassel BA (2006) The interferon regulated ubiquitin-like protein, ISG15, in tumorigenesis: friend or foe? Cytokine Growth Factor Rev 17: 411–42a - PubMed
    1. Borden EC, Sen GC, Uze G, Silverman RH, Ransohoff RM, Foster GR, Stark GR (2007) Interferons at age 50: past, current and future impact on biomedicine. Nat Rev Drug Discov 6: 975–990 - PMC - PubMed
    1. Brass AL, Huang IC, Benita Y, John SP, Krishnan MN, Feeley EM, Ryan BJ, Weyer JL, van der Weyden L, Fikrig E, Adams DJ, Xavier RJ, Farzan M, Elledge SJ (2009) The IFITM proteins mediate cellular resistance to influenza A H1N1 virus, West Nile virus, and dengue virus. Cell 139: 1243–1254 - PMC - PubMed
    1. Cai D, Cao J, Li Z, Zheng X, Yao Y, Li W, Yuan Z (2009) Up-regulation of bone marrow stromal protein 2 (BST2) in breast cancer with bone metastasis. BMC Cancer 9: 102. - PMC - PubMed
    1. Cardenas WB, Loo YM, Gale M Jr, Hartman AL, Kimberlin CR, Martinez-Sobrido L, Saphire EO, Basler CF (2006) Ebola virus VP35 protein binds double-stranded RNA and inhibits alpha/beta interferon production induced by RIG-I signaling. J Virol 80: 5168–5178 - PMC - PubMed

Publication types

MeSH terms