. 2013 Nov 13;32(22):2920-37.
doi: 10.1038/emboj.2013.207. Epub 2013 Sep 24.

Amyloid-β oligomers induce synaptic damage via Tau-dependent microtubule severing by TTLL6 and spastin

Affiliations

Amyloid-β oligomers induce synaptic damage via Tau-dependent microtubule severing by TTLL6 and spastin

Hans Zempel et al. EMBO J. .

Abstract

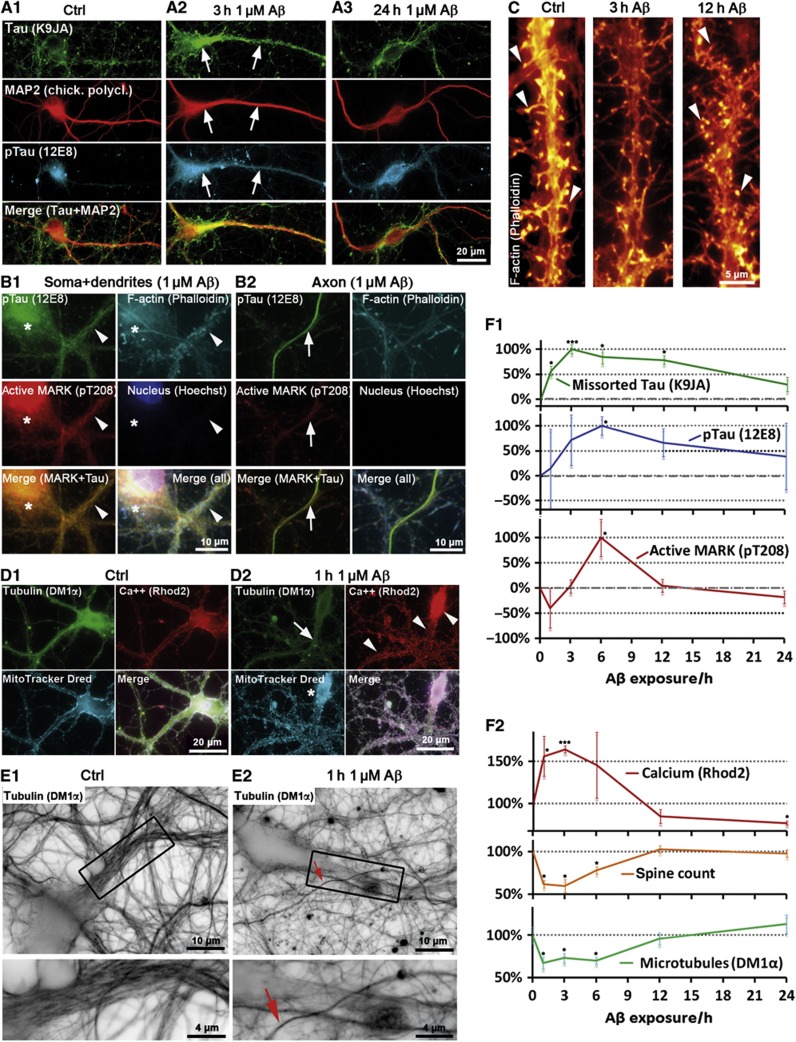
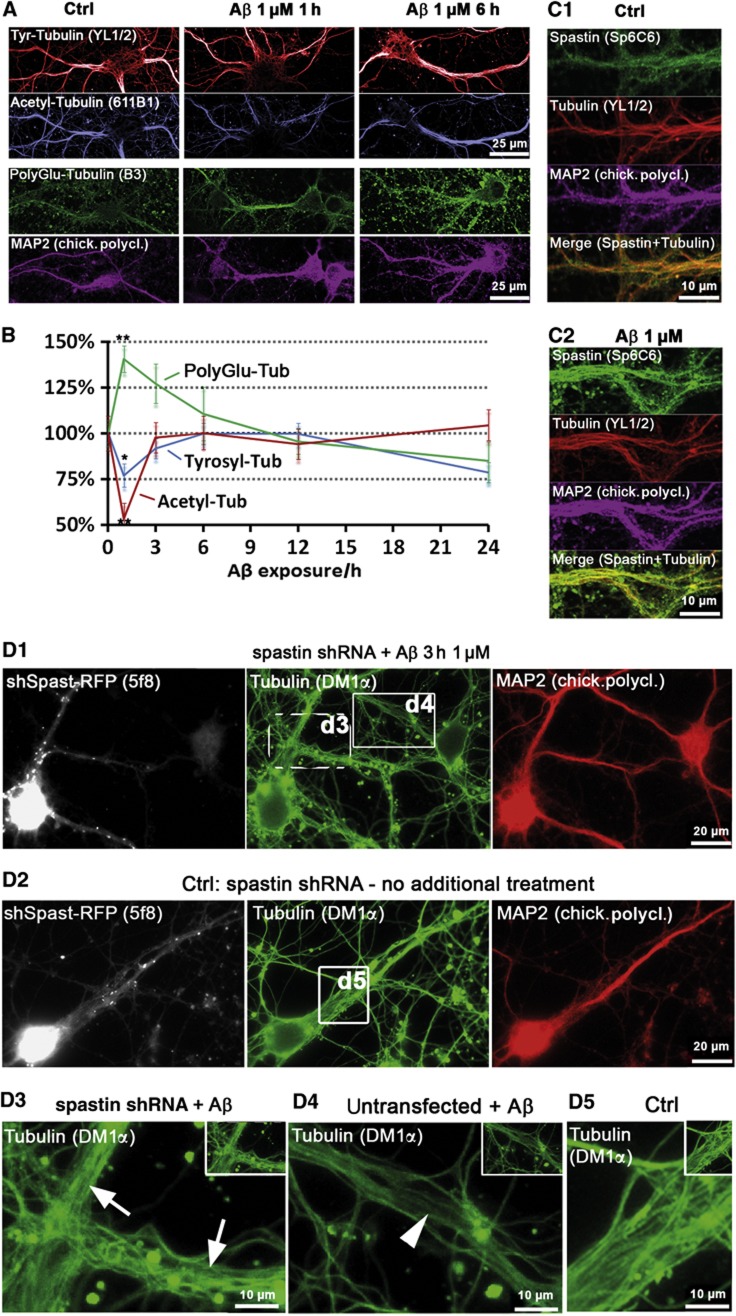
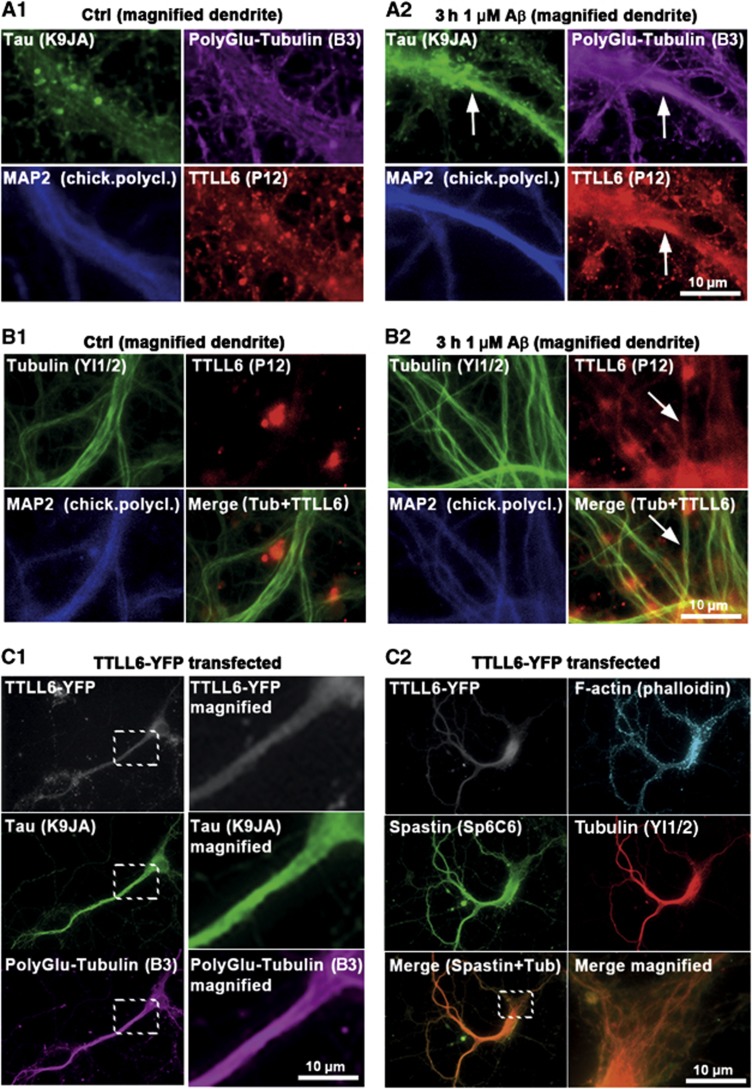
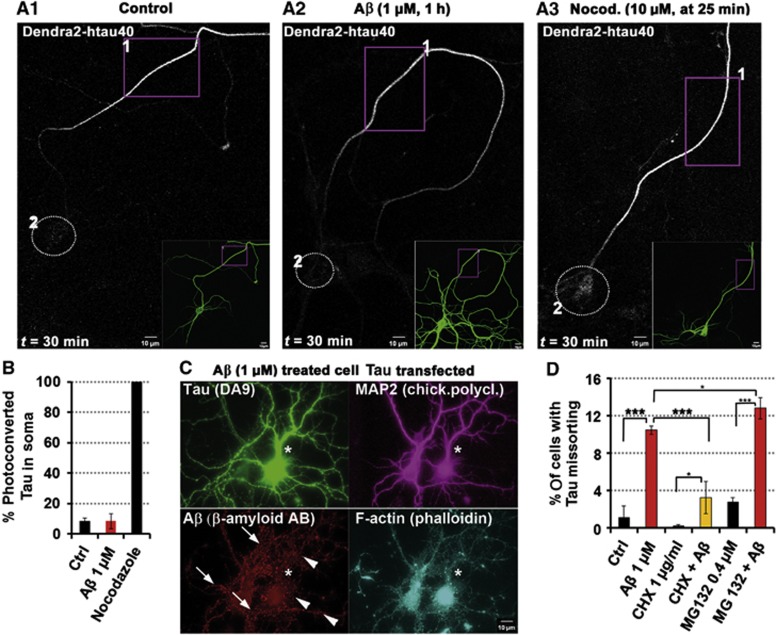
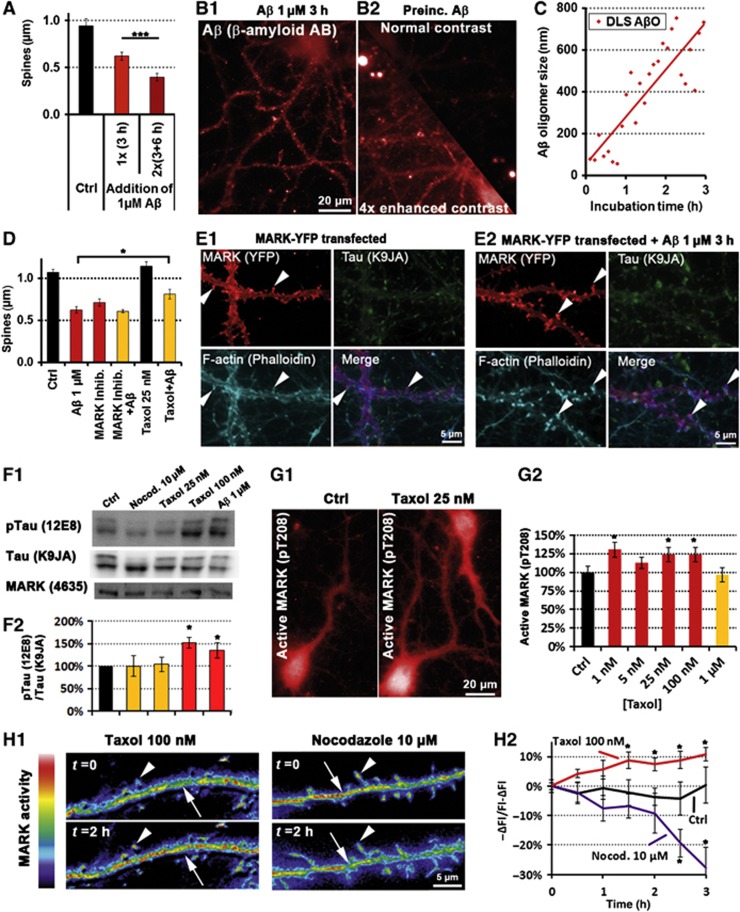
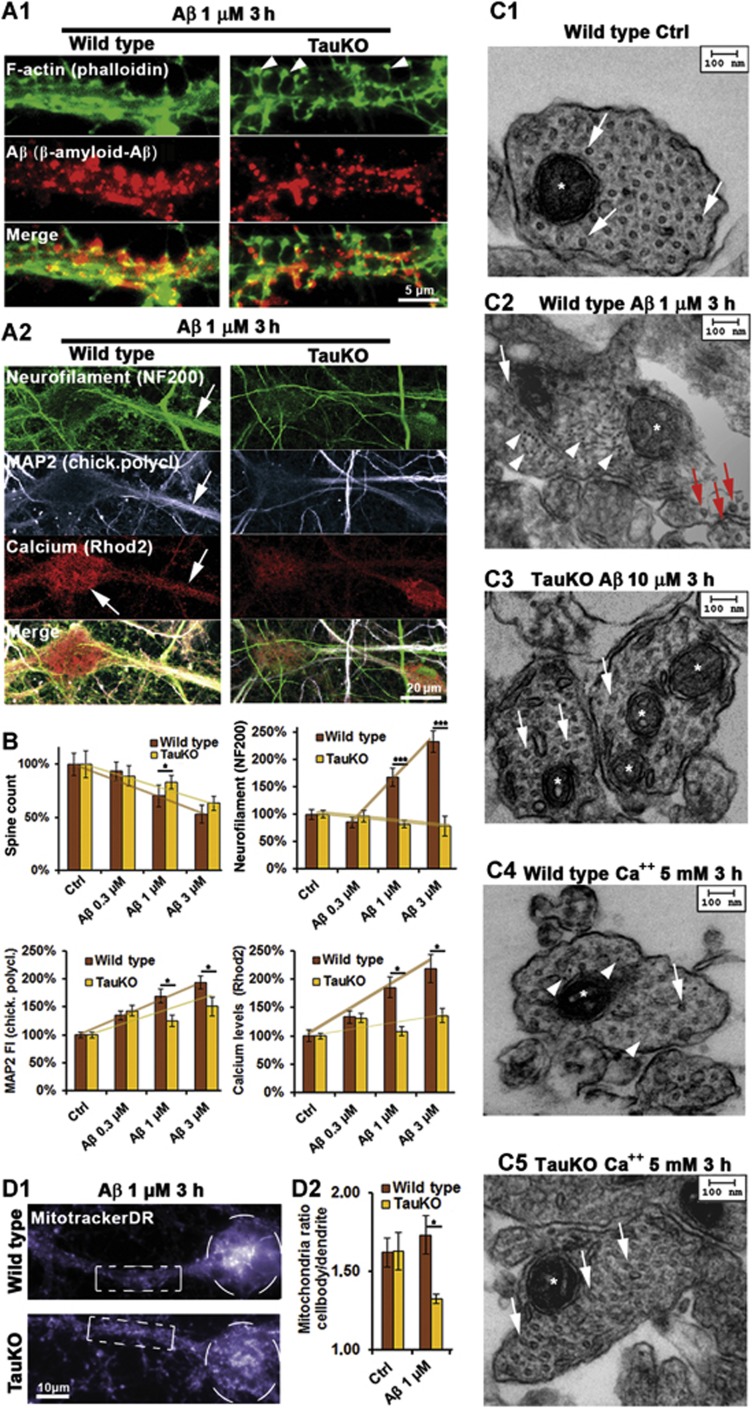
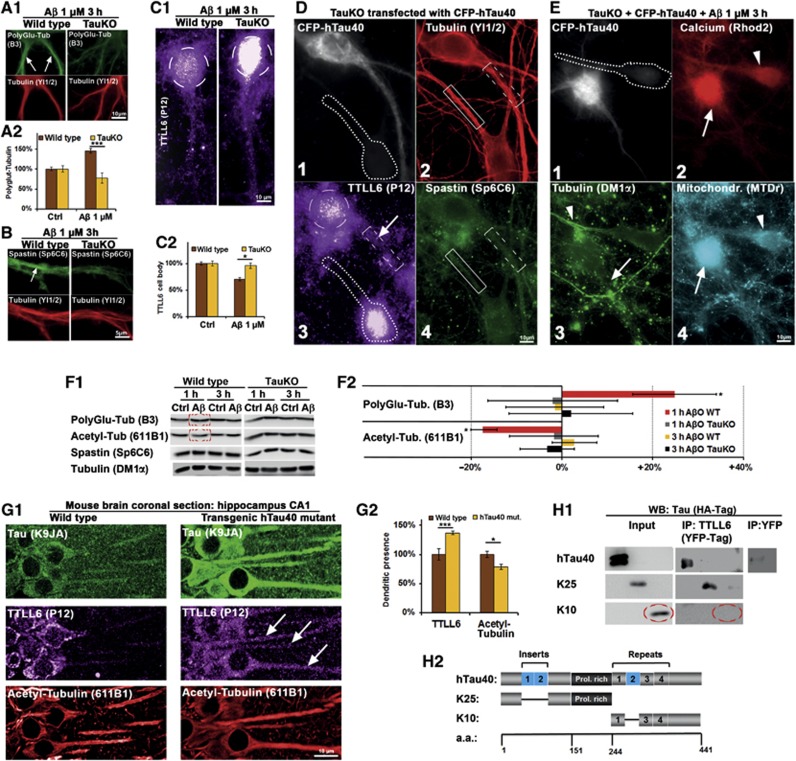
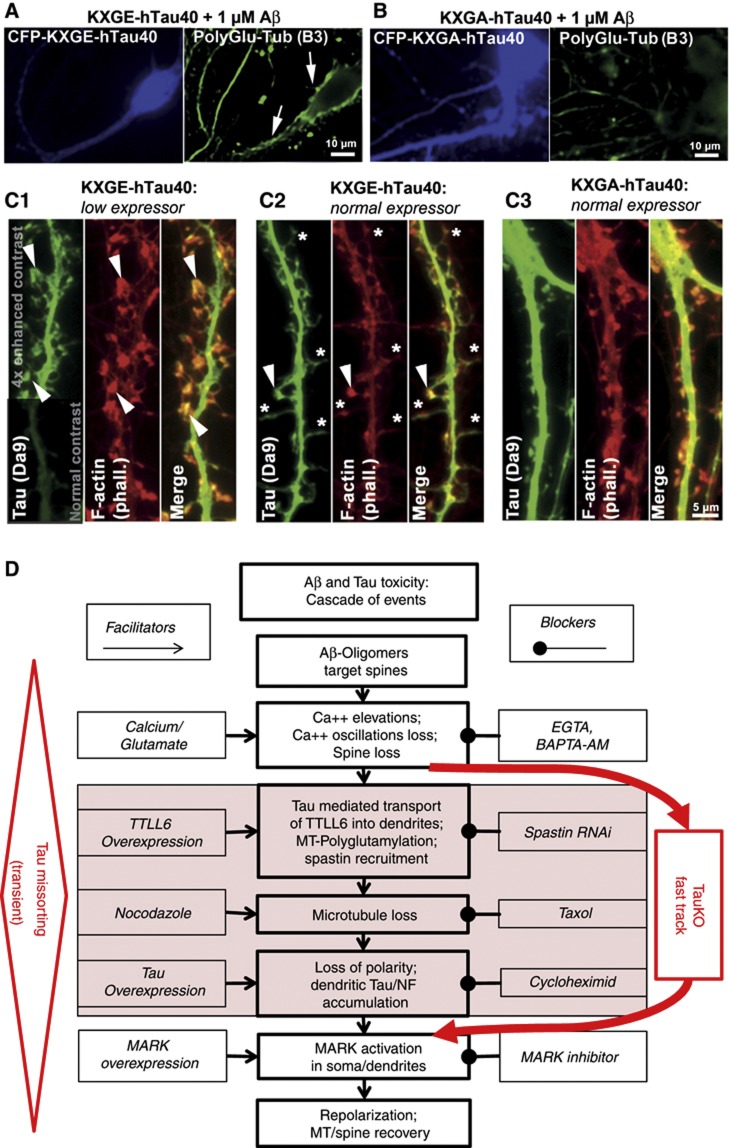
Mislocalization and aggregation of Aβ and Tau combined with loss of synapses and microtubules (MTs) are hallmarks of Alzheimer disease. We exposed mature primary neurons to Aβ oligomers and analysed changes in the Tau/MT system. MT breakdown occurs in dendrites invaded by Tau (Tau missorting) and is mediated by spastin, an MT-severing enzyme. Spastin is recruited by MT polyglutamylation, induced by Tau missorting triggered translocalization of TTLL6 (Tubulin-Tyrosine-Ligase-Like-6) into dendrites. Consequences are spine loss and mitochondria and neurofilament mislocalization. Missorted Tau is not axonally derived, as shown by axonal retention of photoconvertible Dendra2-Tau, but newly synthesized. Recovery from Aβ insult occurs after Aβ oligomers lose their toxicity and requires the kinase MARK (Microtubule-Affinity-Regulating-Kinase). In neurons derived from Tau-knockout mice, MTs and synapses are resistant to Aβ toxicity because TTLL6 mislocalization and MT polyglutamylation are prevented; hence no spastin recruitment and no MT breakdown occur, enabling faster recovery. Reintroduction of Tau re-establishes Aβ-induced toxicity in TauKO neurons, which requires phosphorylation of Tau's KXGS motifs. Transgenic mice overexpressing Tau show TTLL6 translocalization into dendrites and decreased MT stability. The results provide a rationale for MT stabilization as a therapeutic approach.


Conflict of interest statement

The authors declare that they have no conflict of interest.

Figures

Figure 1
Figure 1
MARK activation triggers repolarization and spine recovery after Aβ-induced Tau missorting. Primary rat hippocampal neurons 21DIV were treated with 1 μM Aβ for different durations as indicated. (A1) Control cells show only background staining of Tau and very low phosphorylation of Tau at the KXGS motifs (12E8 epitope). (A2, A3) Cells treated with 1 μM Aβ. (A2) After 3 h of incubation, Tau is missorted into the somatodendritic compartment (arrows) and phosphorylated at the KXGS motifs. (A3) After 24 h of incubation, dendritic total Tau and p-Tau intensities decrease (quantification in F1). (B) Active MARK does not localize to axons. Cells were co-stained with antibodies against active MARK (pT208) and p-Tau (12E8), and with nuclear and F-actin stains. (B1) After exposure to Aβ (3 h, 1 μM), active MARK signals increase, but only in the somatodendritic compartment (quantified in F1; dendrite is indicated by arrowhead, cell body by star). (B2) Active MARK cannot be detected in axons (axon is indicated by arrows), in contrast to the somatodendritic compartment (compare B2 and B1, left middle panels). (C) Spine loss is reversible; in control conditions (left panel) cells display a normal number of spines. After Aβ exposure for 3 h (middle panel), spines decay but grow back after 12 h (right panel). Arrowheads indicate spines, quantification in F2. (D, E) Cells were treated with 1 μM Aβ for 1 h. (D1) Control cells show dense packaging of MTs, homogeneously distributed mitochondria and low Ca++ levels. (D2) After treatment with Aβ (1 h, 1 μM), MTs depolymerize (dendrite indicated by arrow), Ca++ levels are elevated (arrowheads; quantified in F2), and mitochondria cluster in the soma (star). (E) MTs are lost in dendrites, but not in axons. (E1) Control cells display dense MTs in the dendrites (box: magnified in lower panel). (E2) After exposure to Aβ, dendritic MTs are lost (box: magnified in lower panel), whereas axonal MTs remain intact. Arrow indicates an axon crossing the dendrite. (F1) Changes in total Tau, pTau, and pMARK (A, C) revert to baseline after 12–24 h of treatment with Aβ. Dendritic increase in total Tau and pTau precede activation of MARK. (F2) Quantification of Ca++ and MT levels (B, D, E) in the proximal dendrites and spine count after different incubation times with 1 μM Aβ. Changes revert to baseline after 12–24 h of treatment. Rapid increases in Ca++ correlate with drop in MT and spine levels.
Figure 2
Figure 2
Aβ exposure leads to rapid loss of acetylated, but not tyrosinated MTs, induces MT polyglutamylation and spastin recruitment in dendrites. Primary rat hippocampal neurons (16–21DIV) were treated with 1 μM Aβ as indicated, MAP2 staining was used as a marker for somatodendritic compartment. (A) In control cells, dendrites display high levels of tyrosinated and acetylated MTs, and low levels of polyglutamylated MTs. After short treatments (1 and 3 h), there is almost no change in tyrosinated MTs (upper panels), but a fast drop in acetylated MTs (middle panels). Polyglutamylation of MTs increases already after 1 h. Changes in all MT modifications are not observable anymore after 6 h of treatment (right panels). (B) Quantification of (A); changes revert to baseline after 6–12 h of treatment. (C) Cells were co-stained for spastin and MTs. (C1) Controls show only a diffuse spastin staining. (C2) After treatment with Aβ (1 μM, 3 h), spastin is recruited to MTs (increased colocalization with Tubulin in merge, lower panel). (D) Spastin was silenced using shRNA with a vector co-expressing RFP (5 days), cells were then treated with 1 μM Aβ for 3 h (D1, D3, D4) or left untreated (D2, D5). (D1) Silencing of spastin results in stable MTs after Aβ treatment. Cells expressing shRNA (RFP-positive cells, dotted box, magnified in D3, arrows) show no MT reduction as neighbouring untransfected cells do (RFP-negative cells, solid box, magnified in D4, arrowheads). (D2) Silencing of spastin in control cells has no effect on microtubule density. (D3D5) Magnification of boxed areas in (D1) and (D2).
Figure 3
Figure 3
TTLL6 induces polyglutamylation of MTs and Tau missorting. (A, B) Primary rat hippocampal neurons 21DIV treated with 1 μM Aβ for 3 h. MAP2 was used as a marker for the somatodendritic compartment. (A) Increases in dendritic polyglutamylation of MTs correlate with dendritic appearance of TTLL6 and Tau missorting (note colocalization indicated by arrows in A2) after Aβ treatment. Only basal/background levels of polyglutamylation of MTs, and no presence of TTLL6 or Tau can be detected in controls (A1). (B) Fixation and extraction to preserve MTs indicate recruitment of TTLL6 to MTs after Aβ treatment (B2; arrows), no recruitment is apparent in the case of controls (B1). (C) YFP-tagged TTLL6 was transfected into primary neurons for 1 day. (C1) Transfection of TTLL6 results in increased polyglutamylation and missorting of Tau. Right panels show magnification of boxed areas. (C2) TTLL6-transfected cells show enhanced spastin recruitment to MTs; merged images of spastin and tubulin show colocalization (lower right panel shows magnification of boxed area in lower left panel).
Figure 4
Figure 4
Missorted Tau is not axonally derived but newly synthesized. (AC) Primary rat hippocampal neurons 23DIV were transfected with hTau40 fused to the photoconvertible FP Dendra2 (TauD2) 5 days prior to treatment/observation. (A1) Transfected TauD2 displays homogeneous distribution in the cell (insert). After photoconversion in ROI 1 (box) at t=0 min, TauD2 propagation is restricted to the axon, TauD2 does not reach the cell body (circle, ROI 2) even after 30 min of observation. (A2) Treatment with Aβ (1 μM, 1 h) prior to photoactivation does not change the TauD2 propagation behaviour, TauD2 propagation is still restricted to the axon, and does not reach the cell body (circle). (A3) Nocodazole treatment at t=25 min induces rapid diffusion of TauD2 across the Tau diffusion barrier; Tau reaches the cell body (circle). (B) Quantification of photoconverted TauD2 fluorescence intensities in the cell body 30 min after photoactivation of conditions from (A1) to (A3). (C) After transfection with TauD2, imaging and treatment with Aβ (1 μM), cells were fixed and stained as indicated. In transfected cells (star), despite higher levels of Tau, Aβ is associated to dendrites (arrowheads, lower panel), comparable to cells with weak missorting of endogeneous Tau (arrows, lower panel) after Aβ treatment. Both the presence of spines and MAP2 indicate the somatodendritic compartment. (D) Quantification of missorting after treatment with Aβ (1 μM, 3 h) and modulators of protein homeostasis. Co-treatment with the translation inhibitor cycloheximide (1 μg/ml) reduces Tau missorting, whereas treatment or co-treatment with the proteasome inhibitor MG132 (0.4 μM) showed a trend to increase the amount of missorting.
Figure 5
Figure 5
MARK re-establishes Tau polarity and restores spines after Aβ loses its toxicity. Primary rat hippocampal neurons (21DIV) were treated with 1 μM Aβ or as indicated. (A) Quantification of spine number in control conditions and after one insult or two sequential insults with a lag time of 3 h indicate that neurons do not become resistant; spine loss increases with the hit number. (B) Aβ targeting to neurons. (B1) Normally oligomerized Aβ targets neurons. (B2) AβO was pre-incubated for 3 h under cell-culture conditions at the usual concentration (1 μM), and then applied to cells for 3 h. Aβ targeting to dendrites becomes apparent only with enhanced contrast (lower half shows mirrored image of upper half, but contrast was enhanced four-fold). (C) Dynamic light scattering (DLS) of AβO at 37°C reveals that even at low concentrations (shown here: 1 μM) AβO rapidly grow in size. (D) Quantification of spine number with MARK modulators after 3 h exposure. The MARK inhibitor F7 (compound 39621; 1 μM, 3 h) decreases the number of spines similarly to Aβ, while taxol (25 nM) as an MARK activator protects spines from Aβ toxicity. (E) YFP-tagged MARK2 was transfected and expressed for 3 days. (E1) YFP-MARK2 localizes to the somatodendritic compartment and is enriched in spines (magnified images of dendrites). Arrowheads indicate spines. (E2) Transfected MARK2 protects against Aβ-induced missorting of Tau. Magnified images of dendrites; 3 days after transfection, cells were treated with 1 μM Aβ for 3 h and stained for total Tau. MARK2-transfected neurons (left panel) do not show missorting of Tau or spine loss (spines are indicated by arrowheads). (F1) Western blots with antibodies against pTau (12E8, phosphorylation at KXGS motifs) and total Tau and MARK shows increased phosphorylation only in the case of high taxol concentration (100 nM) and Aβ (1 μM), but not with nocodazole (10 μM) or low taxol concentration (25 nM) and no change in total Tau or MARK expression. (F2) Quantification of (F1). (G) Cells were treated for 3 h with different concentrations of taxol, and stained with an antibody recognizing MARK when phosphorylated at its activation site (pT208). (G1) 25 nM taxol results in increased immunofluorescence throughout the cell. (G2) Quantification of several concentrations of taxol reveals increase in MARK phosphorylation over a broad range of concentrations. (H) Cells were transfected with an FRET-based MARK activity reporter for 4 days, and treated with taxol (100 nM) or nocodazole (10 μM). (H1) Ratiometric imaging of the MARK activity reporter shows increased FRET 2 h after taxol addition (left panel) indicating increased MARK activity in spines (arrowhead) and the dendritic shaft (arrow). Two hours after nocodazole addition (right panels), MARK activity is decreased in spines (arrowhead) and the dendritic shaft (arrow). (H2) Quantification of time-lapse imaging.
Figure 6
Figure 6
Tau deficiency does not protect against Aβ association to dendrites and transient spine loss, but protects against loss of MTs, neurofilament invasion, and loss of mitochondria. Primary wild-type (wt) and TauKO hippocampal neurons aged 19–20DIV. (A1) Three hours after exposure to Aβ, Aβ staining shows solid association with dendrites of both wt and TauKO cells (middle panels). Dendritic spine number (upper panels) is reduced in both cases, arrowheads indicate remaining spines in the case of TauKO neurons (right panels). (A2) Left panels: treatment of wt cells results in strong somatodendritic missorting of neurofilaments and increase in Ca++ and MAP2 (arrows). Right panels: treatment of TauKO cells with Aβ does not result in missorting of neurofilaments. MAP2 and Ca++ are only slightly elevated. (B) Quantifications of (A1) and (A2). Upper left panel: quantification of (A1) reveals a trend to more stable spines in the case of TauKO cells. Upper right panel: only wt cells show neurofilament invasion. Lower panels: wt cells show a dose-dependent increase in dendritic MAP2 and Ca++ levels, while there is only a slight increase in TauKO cells. (C) Electron microscopy of thin cross-sections of wt and TauKO hippocampal dendrites of cells treated with AβO or Ca++ as indicated. Stars indicate mitochondria. (C1) Control dendrites show a dense packing of MTs (arrows) and no neurofilaments. (C2, C4) Wt dendrites show loss of MTs in the dendrites (indicated by arrows), but not in axons (red arrows, c2), and neurofilament invasion (arrowheads). (C3, C5) TauKO neurons do not show MT loss after exposure to Aβ or Ca++ and no neurofilament invasion. (D) Cells were treated with Aβ for 3 h and stained for mitochondria. (D1) After exposure to Aβ, in wt cells (upper panel) mitochondria are cluster in the cell body (circle) and are lost in the dendrite (box), while in TauKO cells (lower panel) mitochondria density is similar in the cell body (circle) and the dendrite (box). (D2) Quantification of the ratio of mitochondria staining in the soma versus dendrite reveals clustering of mitochondria in the cell body in the case of wt neurons, whereas in TauKO neurons mitochondria are reduced in the soma and elevated in the dendrite.
Figure 7
Figure 7
Tau deficiency prevents AβO-induced polyglutamylation, spastin recruitment, and TTLL6 transport into dendrites. Transfection of human Tau causes TTLL6 transport into dendrites and re-establishes AβO toxicity in TauKO cells. (AC) Primary wt and TauKO hippocampal neurons aged 19–20DIV were treated with Aβ (1 μM, 3 h) and stained as indicated. (A1) In wt cells (left panels), Aβ treatment results in increased dendritic polyglutamylation (arrows). In TauKO cells (right panels), polyglutamylation of MTs remains at baseline levels after Aβ exposure. (A2) Quantification of (A1). (B) After Aβ exposure, spastin is recruited to MTs in the case of wt cells (left panels, arrow), but not in TauKO cells (right panels). (C1) After Aβ exposure, TTLL6 is reduced in the soma (circle) in the case of wt cells (left panel) compared to TauKO neurons (right panel). (C2) Quantification of TTLL6 levels in the cell body shows reduction in TTLL6 of wt cells. (D) Transfection of CFP-hTau40 results in translocation of TTLL6 from the soma into the dendrite, but no spastin recruitment and no loss of MTs. (1) CFP signal indicates transfected cell, neigbouring cell (dotted line) is not transfected. (2) Transfection of Tau does not change MT density (boxes indicate dendritic segments; transfected cell: dotted box; untransfected cell: solid box). (3) Tau-transfected cell shows translocation of TTLL6 into the dendrite (boxed; arrow); also note the reduction in the cell body (circle), while in the untransfected cell (dotted line) TTLL6 remains in the cell body. (4) Staining of spastin; Tau transfection does not change spastin recruitment. (E) Presence of Tau and AβO insult are necessary for MT loss, Ca++ rise, and clustering of mitochondria. TauKO cells were transfected with CFP-hTau40 for 3 days and then treated with Aβ 1 μM for 3 h. (1) TauKO cell transfected with CFP-hTau40 shows the CFP signal, neighbouring untransfected cell is indicated by dotted line. (2) Tau-transfected cell (arrow) shows strong Ca++ increase compared to untransfected cell (arrowhead). (3) Tau-transfected cell shows MT loss (arrow), while neighbouring cell displays normal MT density (arrowhead). (4) Tau-transfected cells show mitochondria clustering in the cell body (arrow) compared to untransfected cell (arrowhead). (F1) Western blot analysis of primary neurons shows an increase in polyglutamylation of microtubules, and a decrease in acetylation of microtubules only in wild-type neurons after 1 h of Aβ treatment, but no change after 3 h and no change in TauKO neurons, and no change in spastin or tubulin levels. The same membranes were used for polyglutamylation and acetylation of microtubules. (F2) Quantification of (F1). (G) Coronal sections of the CA1 region of the hippocampus of wild-type mice (left panels) and transgenic mice expressing human Tau (right panels) were stained for Tau with an antibody that detect both mouse and human Tau, TTLL6 and acetylated tubulin as a marker for stable microtubules. (G1) Upper panels: compared to wild-type mice, transgenic mice express more Tau; Tau is also strongly missorted into the somatodendritic compartment. Middle panels: in wild-type mice, TTLL6 is present mainly in the cell body, in transgenic mice it is also sorted into the dendrites (arrows). Lower panels: transgenic mice show lower levels of acetylated microtubules. (G2) Quantification of (G1). (H) HEK293 cells were transfected with HA-tagged versions of the longest human Tau isoform (hTau40), or the N-terminal half lacking both inserts (K25), or the C-terminal half without the second repeat (K10), plus TTLL6-YFP or YFP alone. (H1) Immunoprecipitation with an antibody against YFP pulled down hTau40 and K25, but not K10 in the case of TTLL-YFP transfection, while YFP alone did not pull down hTau40. Western blotting was done with an antibody against HA-Tag. (H2) Constructs used for the IP reveal that the presence of the C-terminal half, including the repeat domain, and both inserts in the N-terminal half are not required for binding of TTLL6 to Tau.
Figure 8
Figure 8
Re-introduction of CFP-hTau40 into TauKO neurons re-establishes Aβ-dependent toxicity when Tau is phosphorylatable or pseudo-phosphorylated at the KXGS motifs. Primary hippocampal neurons from TauKO mice were transfected for 3 days with CFP-tagged human Tau (hTau40) mutated at the KXGS motifs, either to KXGE (mimicking phosphorylation), or to KXGA (preventing phosphorylation) and treated with AβO for 3 h. (A) KXGE-Tau re-establishes Aβ-induced polyglutamylation of MTs. (B) KXGA-Tau does not permit enhanced polyglutamylation after exposure to Aβ. (C) TauKO primary hippocampal neurons were transfected with KXGE-Tau or KXGA-Tau, stained with antibody DA9 for signal enhancement. (C1) KXGE-Tau in low expression levels is enriched at F-actin containing spines (arrowheads). (C2) In normal expression levels, KXGE-Tau leads to depletion of F-actin in spines resulting in filopodia-like spines (stars), remaining F-actin containing spines are highly enriched with KXGE-Tau (arrowhead). (C3) KXGA-Tau is not enriched in spines and does not disturb F-actin. (D) Cascade of events leading from Aβ-induced damage (loss of Tau polarity, MTs and spines) to regeneration. The boxes in the center indicate the cascade of events after exposure to A?Os, boxes on the left indicate activators operating at different stages, boxes on the right indicate inhibitors. The shaded boxes indicate steps that are bypassed in the absence of tau, implying that missorting of cytoskeletal elements (e.g. NF) or breakdown of microtubules are largely circumvented.

Comment in

Similar articles

Cited by

References

    1. Aronov S, Aranda G, Behar L, Ginzburg I (2001) Axonal tau mRNA localization coincides with tau protein in living neuronal cells and depends on axonal targeting signal. J Neurosci 21: 6577–6587 - PMC - PubMed
    1. Augustinack JC, Schneider A, Mandelkow EM, Hyman BT (2002) Specific tau phosphorylation sites correlate with severity of neuronal cytopathology in Alzheimer’s disease. Acta Neuropath 103: 26–35 - PubMed
    1. Baas PW, Karabay A, Qiang L (2005) Microtubules cut and run. Trends Cell Biol 15: 518–524 - PubMed
    1. Bamburg JR, Bloom GS (2009) Cytoskeletal pathologies of Alzheimer disease. Cell Motil Cytoskeleton 66: 635–649 - PMC - PubMed
    1. Bano D, Nicotera P (2007) Ca2+ signals and neuronal death in brain ischemia. Stroke 38: 674–676 - PubMed

Publication types