. 2013 Nov;27(11):1897-917.
doi: 10.1210/me.2013-1205. Epub 2013 Sep 24.

Transgenic muscle-specific Nor-1 expression regulates multiple pathways that effect adiposity, metabolism, and endurance

Affiliations

Transgenic muscle-specific Nor-1 expression regulates multiple pathways that effect adiposity, metabolism, and endurance

Michael A Pearen et al. Mol Endocrinol. 2013 Nov.

Abstract

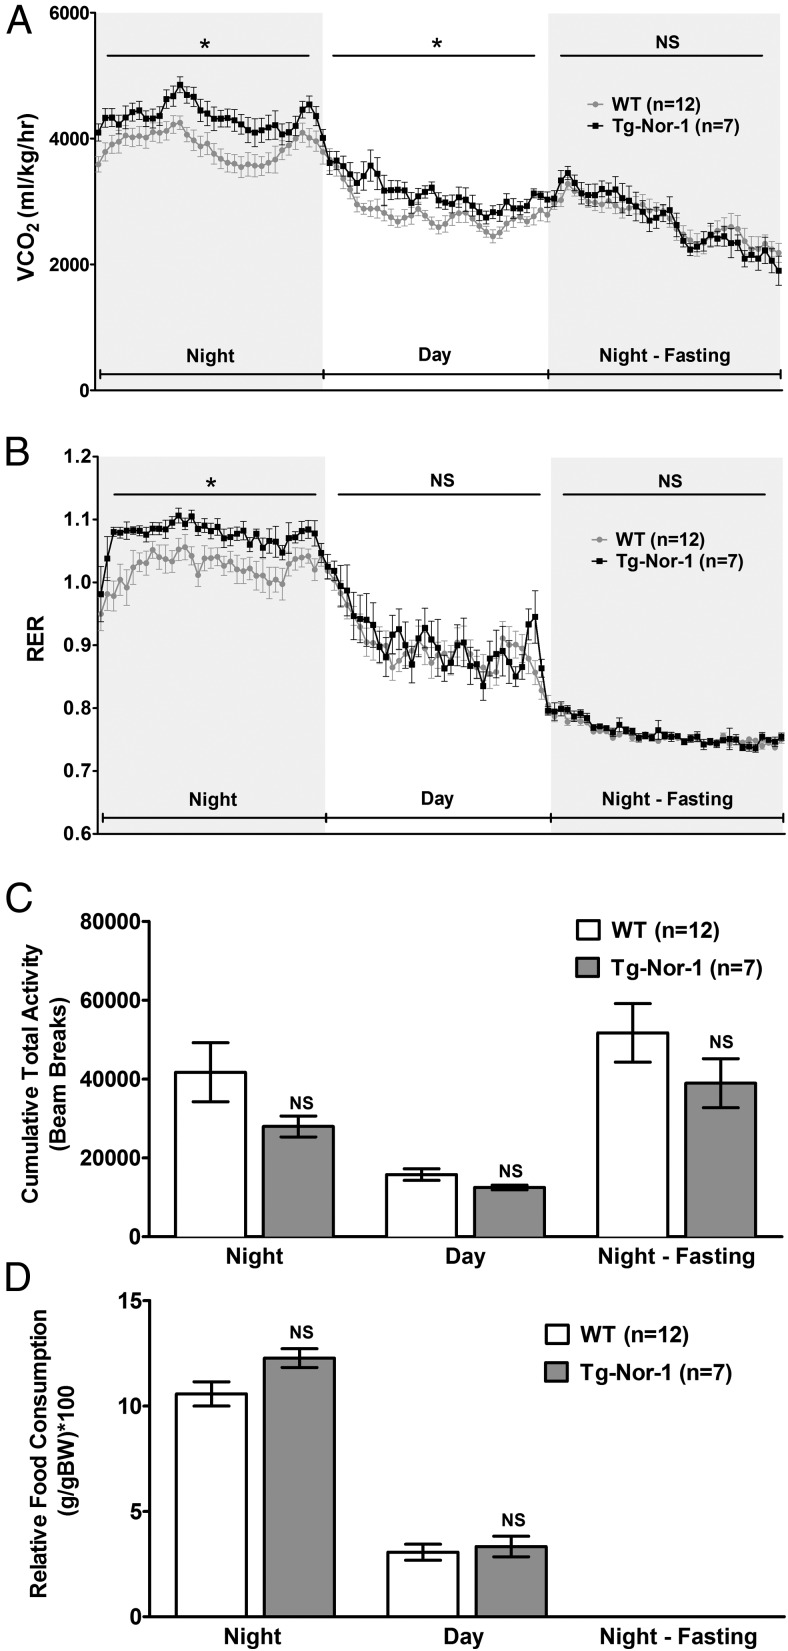
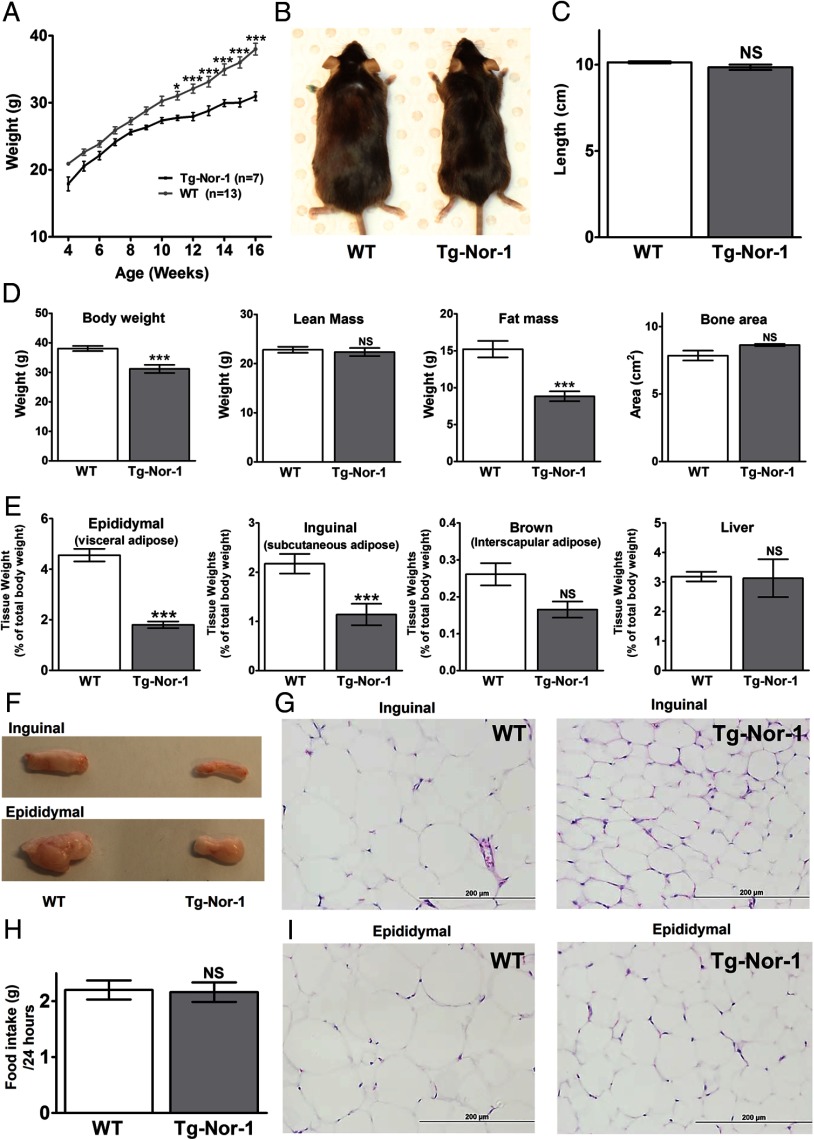
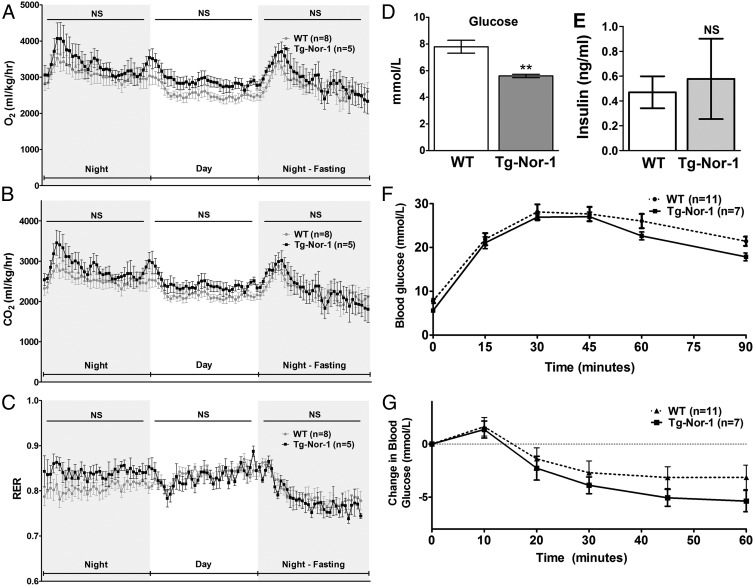
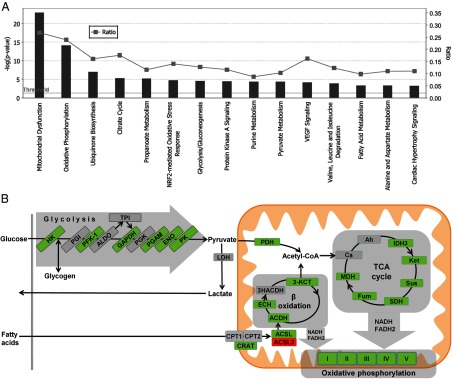
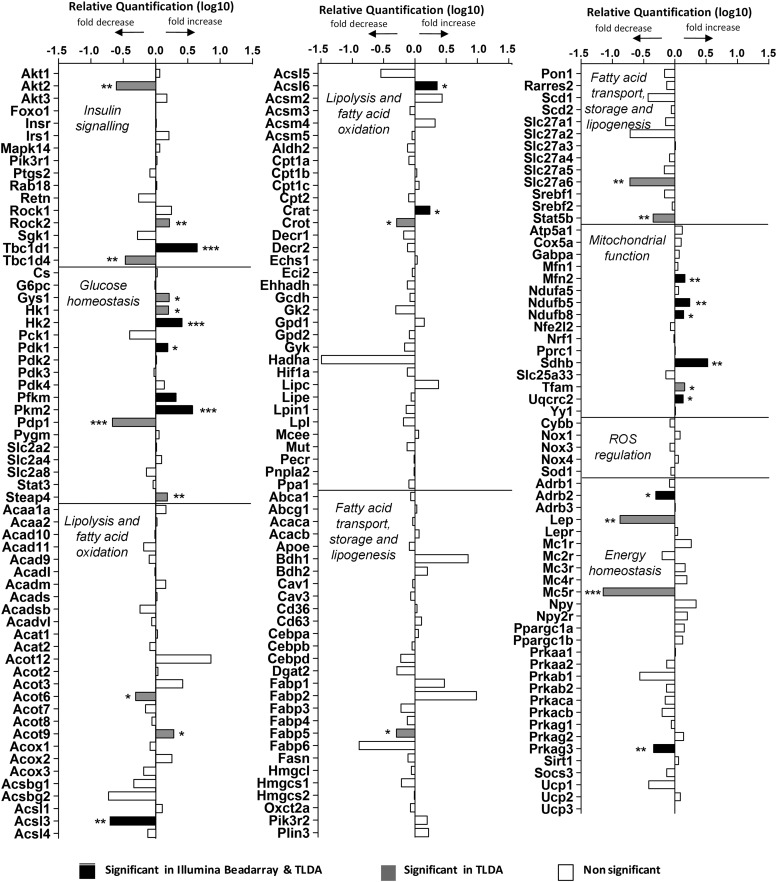
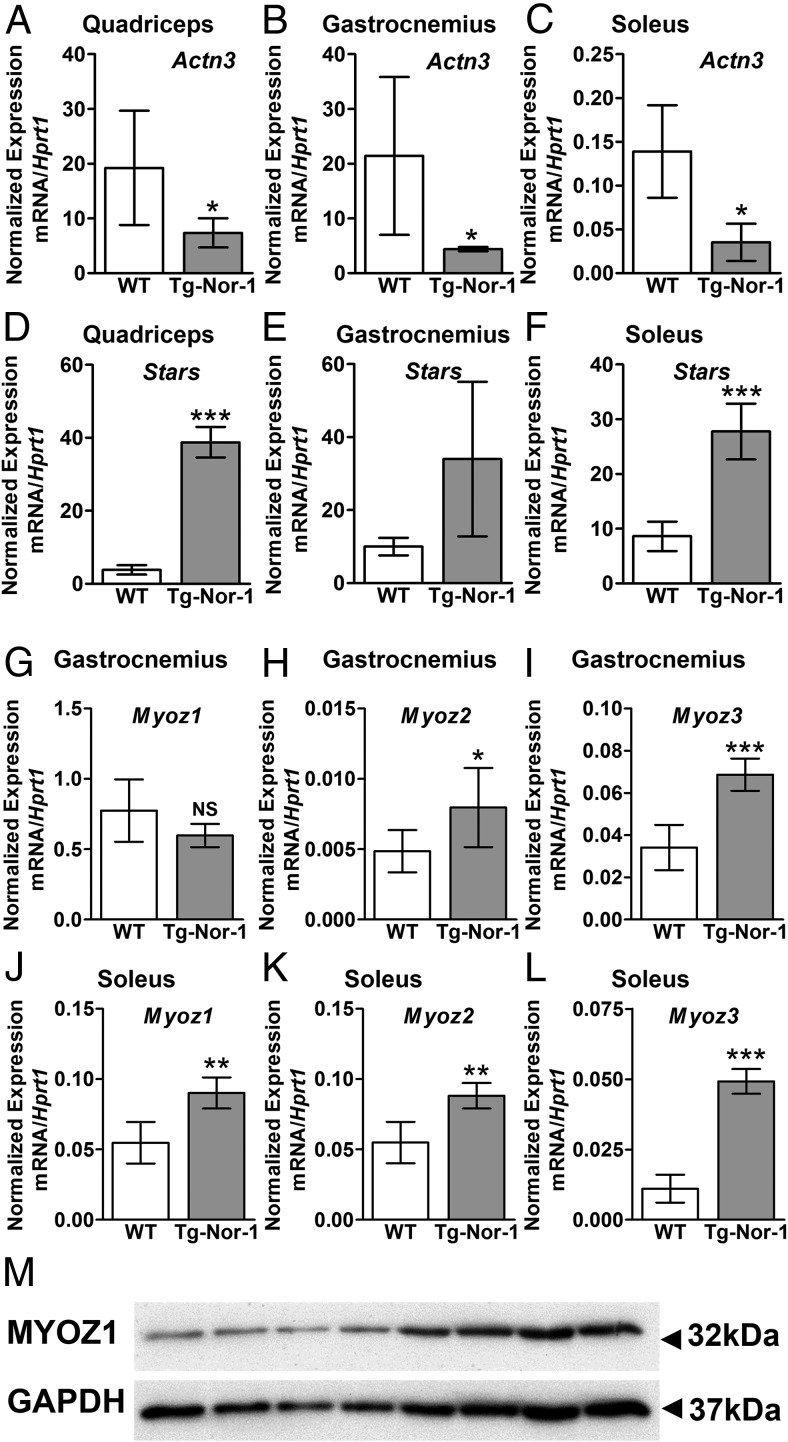
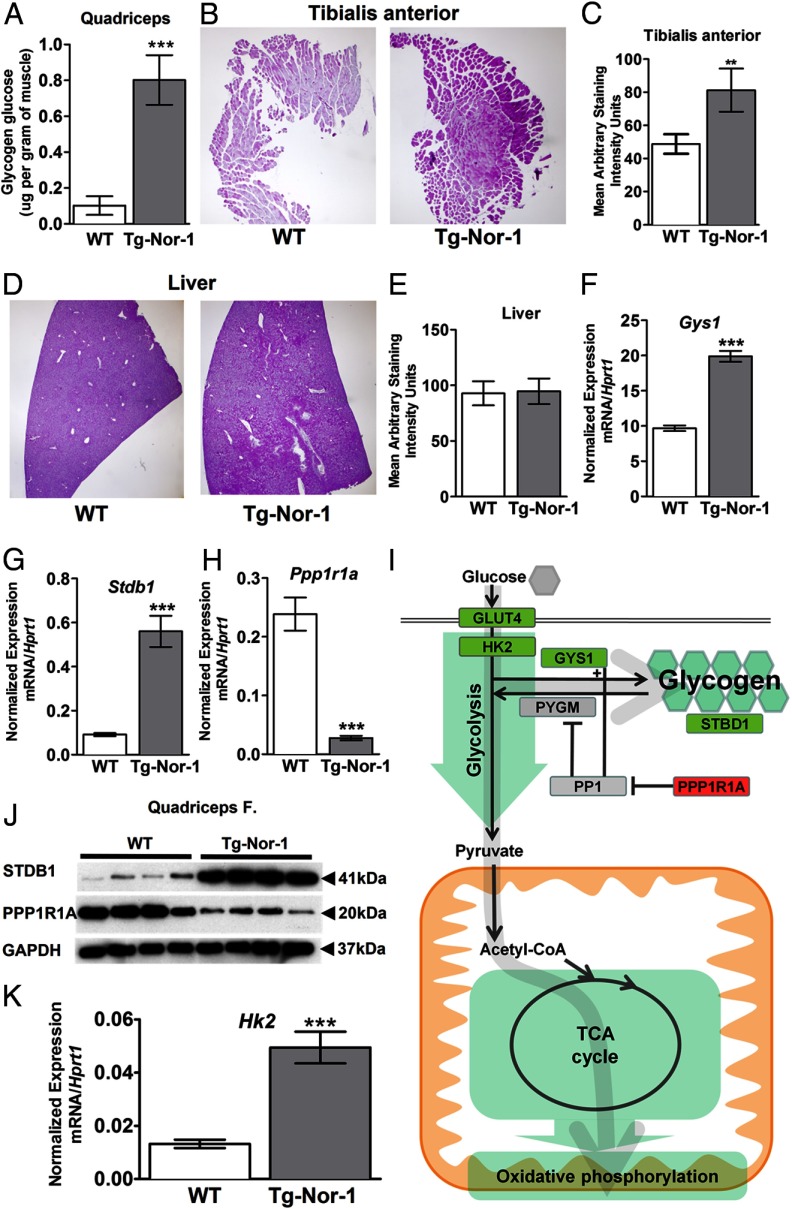
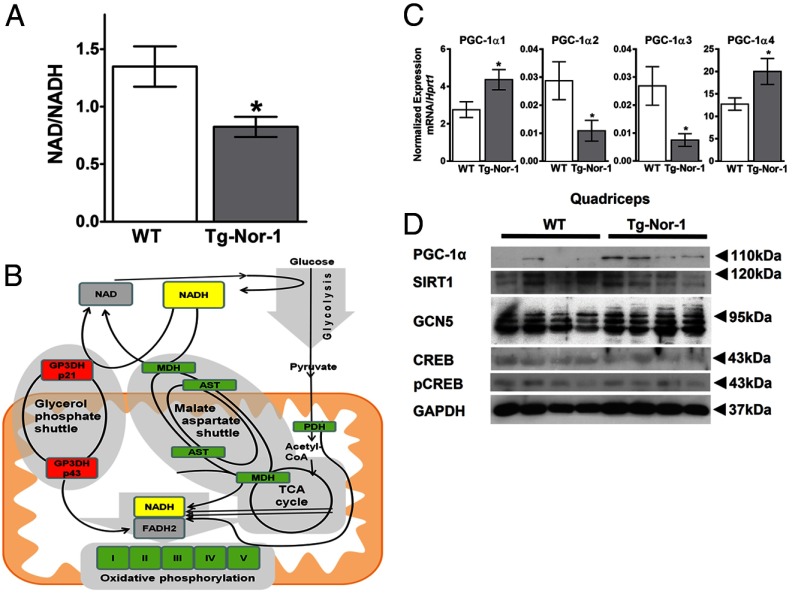
The mRNA encoding Nor-1/NR4A3 is rapidly and strikingly induced by β2-adrenergic signaling in glycolytic and oxidative skeletal muscle. In skeletal muscle cells, Nor-1 expression is important for the regulation of oxidative metabolism. Transgenic skeletal muscle-specific expression of activated Nor-1 resulted in the acquisition of an endurance phenotype, an increase in type IIA/X oxidative muscle fibers, and increased numbers of mitochondria. In the current study, we used dual-energy x-ray absorptiometry and magnetic resonance imaging analysis to demonstrate decreased adiposity in transgenic (Tg) Nor-1 mice relative to that in wild-type littermates. Furthermore, the Tg-Nor-1 mice were resistant to diet-induced weight gain and maintained fasting glucose at normoglycemic levels. Expression profiling and RT-quantitative PCR analysis revealed significant increases in genes involved in glycolysis, the tricarboxylic acid cycle, oxidative phosphorylation, fatty acid oxidation, and glycogen synthesis, in concordance with the lean phenotype. Moreover, expression profiling identified several Z-disc and sarcomeric binding proteins that modulate fiber type phenotype and endurance, eg, α-actinin-3. In addition, we demonstrated that the Tg-Nor-1 mouse line has significantly higher glycogen content in skeletal muscle relative to that in wild-type littermates. Finally, we identified a decreased NAD(+)/NADH ratio with a concordant increase in peroxisome proliferator-activated receptor γ coactivator-1α1 protein/mRNA expression. Increased NADH was associated with an induction of the genes involved in the malate-aspartate shuttle and a decrease in the glycerol 3-phosphate shuttle, which maximizes aerobic ATP production. In conclusion, skeletal muscle-specific Nor-1 expression regulates genes and pathways that regulate adiposity, muscle fiber type metabolic capacity, and endurance.


Figures

Figure 1.
Figure 1.
Transgenic skeletal muscle-specific Nor-1 expression leads to decreased adiposity. A, Tissue weights (as a percentage of total body weight) were determined for epididymal adipose tissue, inguinal adipose tissue, brown adipose tissue, and liver for WT and Tg-Nor-1 mice (n = 8–11). B, Photographs of representative WT and Tg-Nor-1 mice displaying decreased adiposity. C, Samples of isolated adipose tissue (B. brown; I, inguinal; E, epididymal) from WT and Tg-Nor-1 mice. D, DXA body composition analysis showing body weight, lean mass, fat mass, and bone area (n = 4). E, MRI scans displaying a transverse section at the base of the kidney with (F) percentage of the total area of the slice occupied by adipose (n = 4). G, Representative hematoxylin and eosin–stained epididymal adipose tissue sections. H, plasma leptin concentration (n = 8–11). Statistical calculation was performed using a Student t test, and P values are indicated on graphs as follows: *, P < .05; **, P < .01; ***, P < .001.
Figure 2.
Figure 2.
Metabolic profiling of Tg-Nor-1 mice. A and B, CO2 production (corrected for body weight) (A) and RER in WT and Tg-Nor-1 mice (n = 7–12) (B). Data were analyzed using repeated-measures two-way ANOVA. C, Cumulative total activity of the mice measured by horizontal beam breaks. D, Relative food consumption (corrected for body weight) analyzed by one-way ANOVA with column selected Bonferroni post hoc analysis. *, P < .05.
Figure 3.
Figure 3.
Skeletal muscle–specific Tg-Nor-1 mice are protected against high-fat diet–induced weight gain. A, Growth curve measured over 12 weeks with the high-fat diet (n = 7–13) analyzed by one-way ANOVA with column selected Bonferroni post hoc analysis. B, Representative image of 17-week-old WT and Tg-Nor-1 mice. C, Length of mice measured at 17 weeks (n = 6–8). D, DXA body composition analysis showing body weight, lean mass, fat mass, and bone area. E, Tissue weights (corrected for total body weight) were determined for epididymal adipose tissue, inguinal adipose tissue, brown adipose tissue, and liver for WT and Tg-Nor-1 mice (n = 6–8). F, Photographs showing representative samples of inguinal and epididymal adipose tissue. Hematoxylin and eosin stained inguinal (G) and epididymal (I) adipose tissue sections. H, Total high-fat diet consumption over a 24-hour period (n = 5–8). Statistical calculation was performed using a Student t test, and P values are indicated on graphs as follows: *, P < .05; **, P < .01; ***, P < .001; NS, not significant.
Figure 4.
Figure 4.
Gas exchange and glucose tolerance with the high-fat diet. A and B, Oxygen consumption (A) and CO2 production (B) relative to body weight. C, RER for WT and Tg-Nor-1 mice fed the high-fat diet (n = 5–8). Data were analyzed using repeated-measures two-way ANOVA. D and E, Blood glucose levels (D) and plasma insulin levels (E) after a 12-hour fast. Statistical calculation was performed using a Student t test. **, P < .01; NS, not significant. F and G, Intraperitoneal glucose tolerance test (F) and intraperitoneal insulin tolerance test (G) performed on high-fat diet–fed WT and Tg-Nor-1 mice. Data were analyzed as nonsignificant by one-way ANOVA with column selected Bonferroni post hoc analysis.
Figure 5.
Figure 5.
Ingenuity pathway analysis. A, Differentially expressed genes from the Illumina BeadArray analysis comparing WT and Tg-Nor-1 quadriceps femoris muscle were analyzed via Ingenuity pathway analysis to reveal the top 15 canonical pathways associated with differentially expressed genes. B, Schematic summary diagram of significant metabolic pathways identified by ingenuity pathway analysis as being significantly regulated. Green denotes that 1 or more subunits within a protein are significantly increased in Tg-Nor-1 quadriceps femoris muscle compared to WT. Conversely, red denotes significant repression.
Figure 6.
Figure 6.
Categorized gene expression from custom TLDA analysis of quadriceps femoris muscle. Significance from Illumina BeadArray expression of quadriceps femoris muscle was also included. *, P < .05; **, P < .01; ***, P < .001.
Figure 7.
Figure 7.
Expression of sarcomeric genes by Tg-Nor-1 mice. A–C, Expression of Actn3 in quadriceps femoris (A), gastrocnemius (B), and soleus (C) via RT-qPCR (n = 4). D–F, Expression of Stars in quadriceps femoris (F), gastrocnemius (E), and soleus (F) via RT-qPCR (n = 4). G–I, Expression of Myoz1 (G), Myoz2 (H), and Myoz3 (I) in gastrocnemius via RT-qPCR (n = 4–8). J–L, Expression of Myoz1 (J), Myoz2 (K), and Myoz3 (L) in soleus via RT-qPCR (n = 4–8). Statistical calculation was performed using a Student t test, and P values are indicated on graphs as follows: *, P < .05; **, P < .01; ***, P < .001. M, Western blot analysis of MyOZ1 on quadriceps femoris muscle (n = 4).
Figure 8.
Figure 8.
Tg-Nor-1 mice display increased glycogen content and expression of glycogenic genes. A, Glycogen content in quadriceps femoris muscle samples from nonfasted WT and Tg-Nor-1 mice (n = 8). B, PAS staining of tibialis anterior muscle sections to visualize glycogen stores (representative photographs, n = 5 mice/group), C, Quantification of the area of tibialis anterior muscle sections positively stained with Schiff reagent. D, PAS staining of liver sections (n = 5 mice/group). E, Quantification of the area of liver sections positively stained with Schiff reagent. F–H, RT-qPCR examining quadriceps femoris mRNA expression of Gys1 (F), Stbd1 (G), and Ppp1r1a (H) (n = 8). I, Diagram illustrating significant gene changes in glycolysis, glycogen, the TCA cycle, and the oxidative phosphorylation pathway. J, Western blot analysis of STBD1 and PPP1R1A on quadriceps femoris muscle (n = 4). K, RT-qPCR examining quadriceps femoris mRNA expression of Hk2 (n = 8). Statistical calculation was performed using a Student t test, and P values are indicated on graphs as follows: *, P < .05; ***, P < .001.
Figure 9.
Figure 9.
NAD+/NADH and PGC-1α splice variants are modulated by Nor-1 expression. A, NAD+/NADH ratio assay performed on gastrocnemius muscle tissue. B, Diagram illustrating glycolysis, NAD+, NADH, and the malate-aspartate shuttle, highlighting the significant hits from Illumina mRNA expression profiling. C, RT-qPCR analysis of quadriceps femoris muscle examining the PGC-1α splice variants of WT and Tg-Nor-1 mice fed thea normal chow diet (n = 4). D and E, High-fat diet-fed quadriceps femoris PGC-1α (D) and Western blot analysis on quadriceps femoris muscle (E) (n = 4). Statistical calculation was performed using a Student t test, and P values are indicated on graphs as follows: *, P < .05.

Similar articles

Cited by

References

    1. Owen OE, Reichard GA Jr, Boden G, Patel MS, Trapp VE. Interrelationships among key tissues in the utilization of metabolic substrate. In Katzen HE, Mahler RJ, eds. Advances in Modern Nutrition. New York, NY: John Wiley & Sons; 1978:517–550.
    1. Zurlo F, Larson K, Bogardus C, Ravussin E. Skeletal muscle metabolism is a major determinant of resting energy expenditure. J Clin Invest. 1990;86:1423–1427. - PMC - PubMed
    1. Pearen MA, Eriksson NA, Fitzsimmons RL, et al. . The nuclear receptor, Nor-1, markedly increases type II oxidative muscle fibers and resistance to fatigue. Mol Endocrinol. 2012;26:372–384. - PMC - PubMed
    1. Chao LC, Wroblewski K, Zhang Z, et al. . Insulin resistance and altered systemic glucose metabolism in mice lacking Nur77. Diabetes. 2009;58:2788–2796. - PMC - PubMed
    1. Chao LC, Wroblewski K, Ilkayeva OR, et al. . Skeletal muscle Nur77 expression enhances oxidative metabolism and substrate utilization. J Lipid Res. 2012;53:2610–2619. - PMC - PubMed

Publication types

MeSH terms