. 2013 Oct 1;27(19):2109-24.
doi: 10.1101/gad.222174.113. Epub 2013 Sep 24.

H3.3 actively marks enhancers and primes gene transcription via opening higher-ordered chromatin

Affiliations

H3.3 actively marks enhancers and primes gene transcription via opening higher-ordered chromatin

Ping Chen et al. Genes Dev. .

Erratum in

Abstract

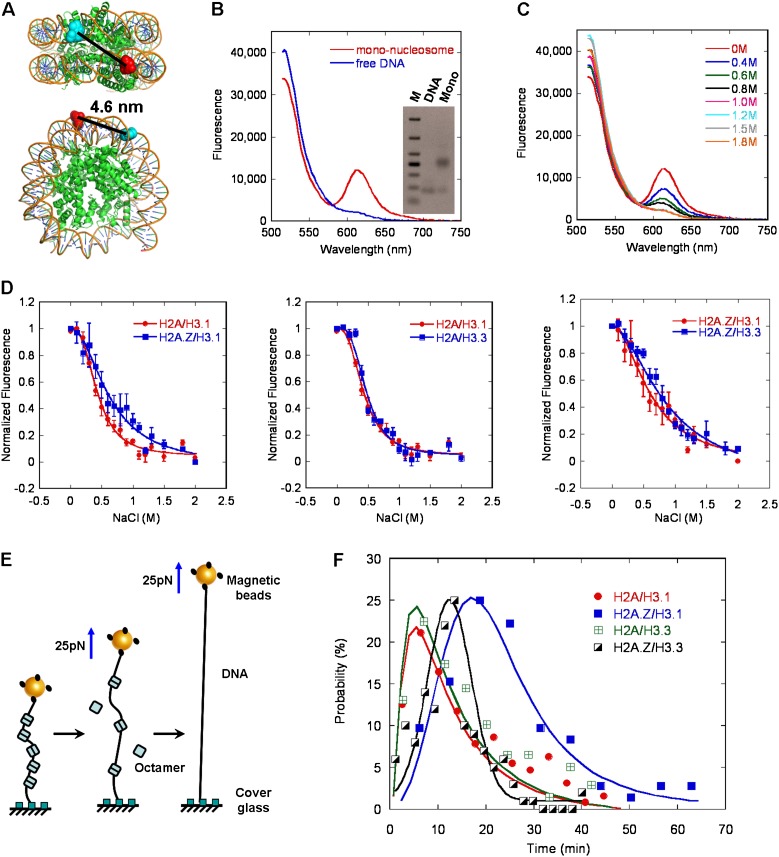
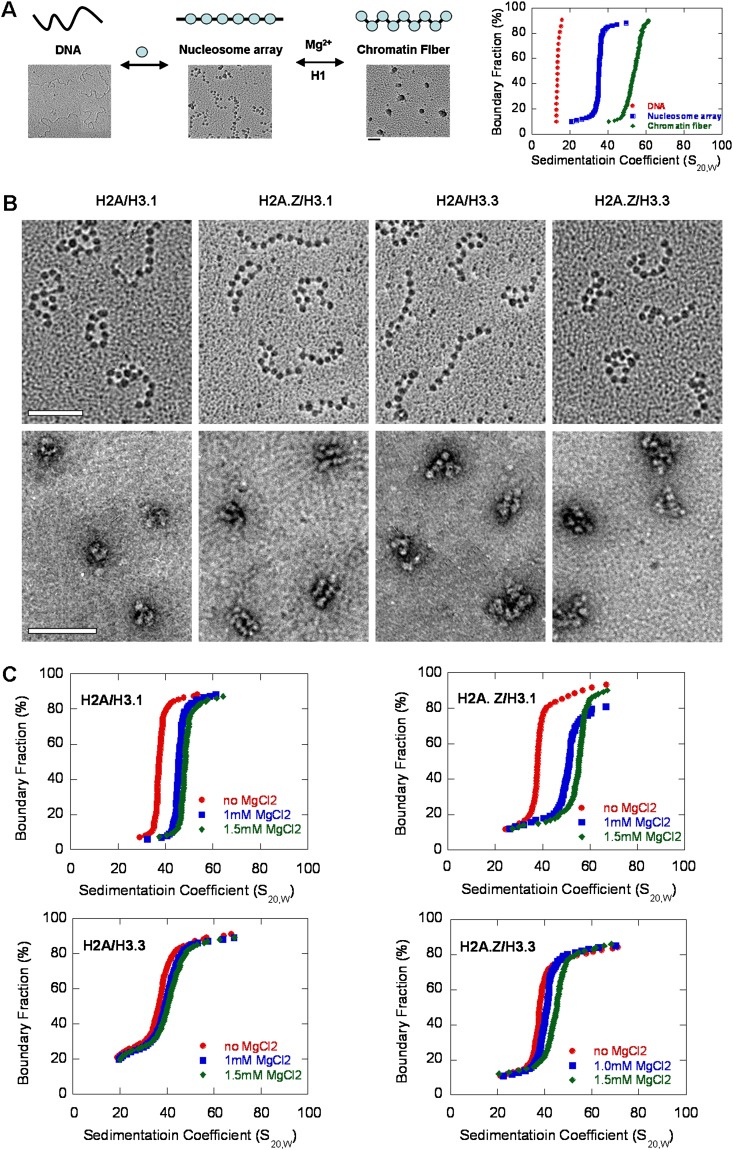
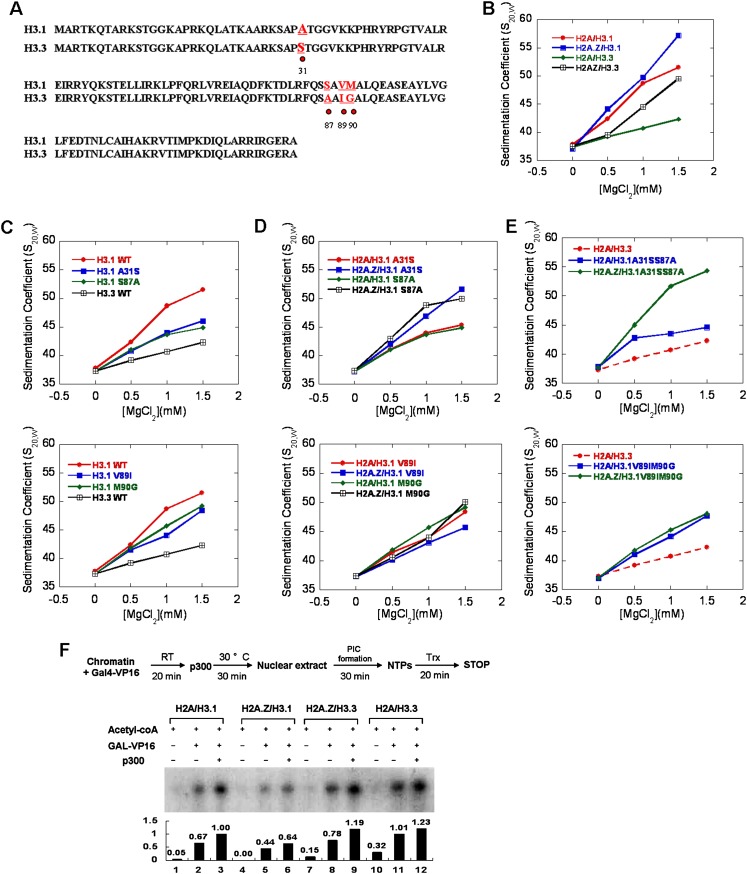
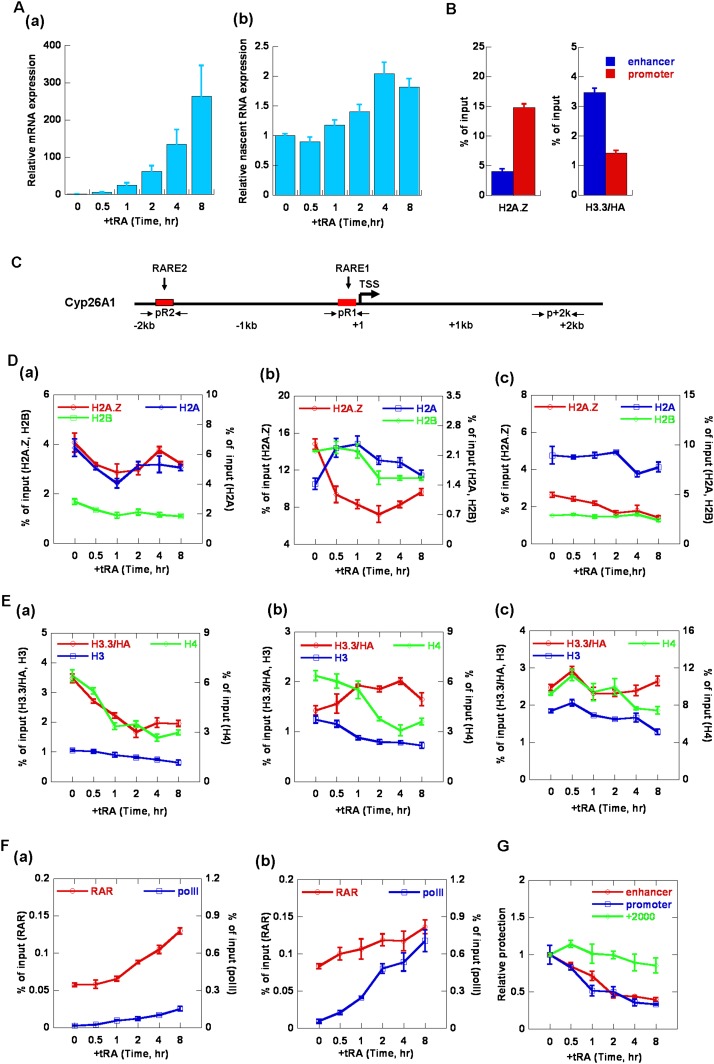
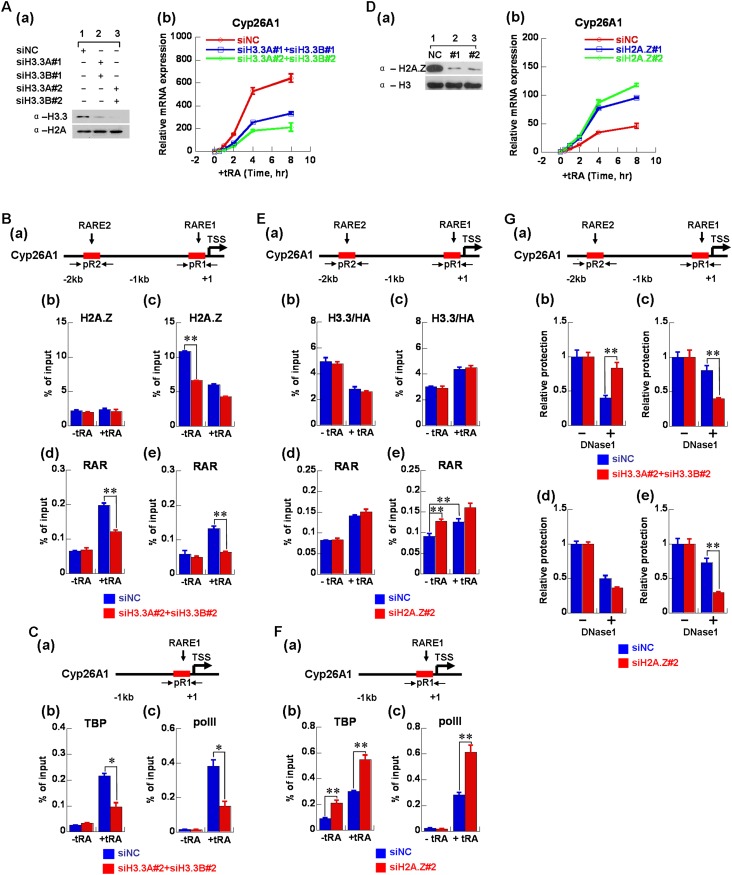
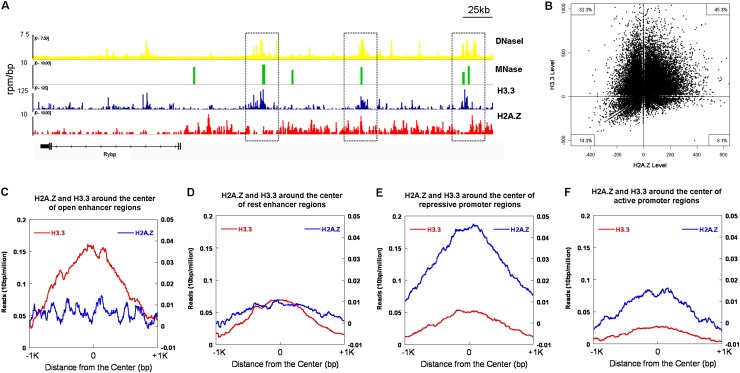
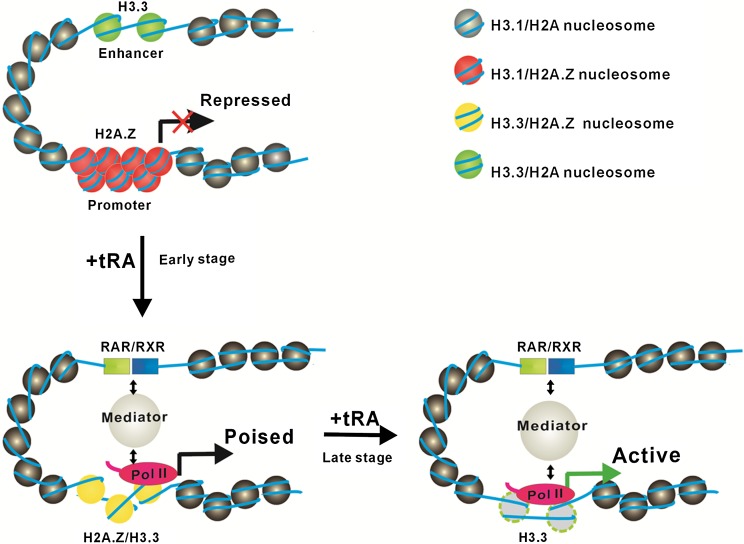
The histone variants H3.3 and H2A.Z have recently emerged as two of the most important features in transcriptional regulation, the molecular mechanism of which still remains poorly understood. In this study, we investigated the regulation of H3.3 and H2A.Z on chromatin dynamics during transcriptional activation. Our in vitro biophysical and biochemical investigation showed that H2A.Z promoted chromatin compaction and repressed transcriptional activity. Surprisingly, with only four to five amino acid differences from the canonical H3, H3.3 greatly impaired higher-ordered chromatin folding and promoted gene activation, although it has no significant effect on the stability of mononucleosomes. We further demonstrated that H3.3 actively marks enhancers and determines the transcriptional potential of retinoid acid (RA)-regulated genes via creating an open chromatin signature that enables the binding of RAR/RXR. Additionally, the H3.3-dependent recruitment of H2A.Z on promoter regions resulted in compaction of chromatin to poise transcription, while RA induction results in the incorporation of H3.3 on promoter regions to activate transcription via counteracting H2A.Z-mediated chromatin compaction. Our results provide key insights into the mechanism of how histone variants H3.3 and H2A.Z function together to regulate gene transcription via the modulation of chromatin dynamics over the enhancer and promoter regions.

Keywords: H2A.Z; H3.3; chromatin dynamics; gene transcription; higher-ordered chromatin structure; histone variants.


Figures

Figure 1.
Figure 1.
The effects of H2A.Z and H3.3 on the stability of mononucleosomes using FRET and magnetic tweezer analyses. (A) The top and side view of the mononucleosome, with the position of the donor (Alexa 488) and acceptor (Alexa 594) indicated. (B) The fluorescence emission spectra of the free-labeled DNA and the well-reconstituted mononucleosomes upon donor excitation at 495 nm the native gel analysis of the same samples is shown in the inset. (C) FRET analysis of NaCl-dependent dissociation of mononucleosomes. (D) The normalized equilibrium dissociation curves for the different variant-containing mononucleosomes, obtained by monitoring the fluorescence difference between the donor and acceptor emissions upon donor excitation at 492 nm. Error bars represent SD (n = 3). (E) Diagram for the force-dependent displacement of octamers from a single nucleosomal array using magnetic tweezers. (F) Probability analysis of the dwell time for the displacement of five nucleosomes containing canonical or variant histones using magnetic tweezers at 25 pN. The solid lines are log-normal fits to the data point with a peak at 5.5 min for the canonical nucleosome, 5.7 min for the nucleosome containing H3.3, 25.2 min for the nucleosome containing H2A.Z, and 12.6 min for the nucleosome containing H2A.Z and H3.3.
Figure 2.
Figure 2.
The effects of H2A.Z and H3.3 on the folding of the chromatin arrays. (A) A schematic diagram with related EM images to show the reconstitution and folding of well-defined nucleosomal arrays on a 12-repeat 177-bp “widom 601 nucleosome positioning” DNA sequence accompanied by their related sedimentation coefficient distribution plots analyzed by the sedimentation velocity in an XL-I analytical ultracentrifuge. (B) EM images of the canonical and H2A.Z-, H3.3-, and double variant H2A.Z/H3.3-containing nucleosomal arrays (by the metal-shadowing method) and their related compact states in 1.0 mM MgCl2 (by negatively stained methods). Bar, 100 nm. (C) Sedimentation coefficient distribution plots for the canonical and H2A.Z-, H3.3-, and double variant H2A.Z/H3.3-containing nucleosomal arrays at 0, 1.0, and 1.5 mM MgCl2.
Figure 3.
Figure 3.
Specific functions of the four unique residues in H3.3 on chromatin folding properties and in vitro transcriptional assays. (A) Sequence alignment of canonical H3.1 (Xenopus) and histone variant H3.3. The amino acid residues that differed between H3.1 and H3.3 are colored red and labeled with dots. (B) The S20,w values of the canonical and variant-containing nucleosomal arrays are shown as a function of MgCl2. (C) The S20,w values of the arrays with point mutations of H3.1 to H3.3 at residue 31 and 87 (top) and at residue 89 and 90 (bottom) compared with wild-type H3.1- and H3.3-containing nucleosomal arrays are shown as a function of MgCl2 concentrations. (D) The S20,w values of the H2A.Z-containing arrays with point mutations of H3.1 to H3.3 at residue 31 and 87 (top) and at residue 89 and 90 (bottom) compared with the wild-type H3.1 and H3.3 are shown as a function of MgCl2 concentrations. (E) The S20,w values of the double-mutant-containing arrays H3.1A31SS87A (top) and H3.1V89IM90G (bottom) in the presence or absence of H2A.Z compared with the H3.3 are shown as a function of MgCl2 concentrations. (F) The effects of H2A.Z, H3.3, and the double variant H2A.Z/H3.3 on the transcriptional activity of chromatin templates. A schematic diagram of the in vitro transcription protocol is shown at the top. The relative transcription levels were quantitated by photoimager and normalized to that for canonical chromatins with all acetyl-CoA, Gal4-VP16, and p300 added. The transcription assays were carried out independently three times.
Figure 4.
Figure 4.
Dynamic regulation of H2A.Z and H3.3 on chromatin structures during Cyp26A1 gene activation by tRA in mES cells R1. (A) The relative levels of Cyp26A1 mRNA (panel a) and nascent RNA (panel b) at different time points during tRA induction as measured using real-time RT–PCR. The levels were normalized as n-fold changes relative to the values prior to tRA induction. (B) ChIP analysis of the deposition of H3.3 and H2A.Z on the enhancer and promoter regions of Cyp26A1 in mES cells (R1). The positions of the primer pairs used in ChIP are indicated in the schematic diagram in C. (C) A schematic diagram of the positions of the primers used in ChIP assay on the Cyp26A1 gene. The primer pair of pR2 amplified the enhancer region of Cyp26A1 where RARE2 is located. pR1 amplified the promoter region where RARE1 is located near the transcription start site (TSS). p+2k amplified the gene body region around Cyp26A1+2000. (DF) ChIP analysis of the level of H2A.Z, H2A, and H2B (D); H3.3, H3, and H4 (E); and RARα and Pol II (F) on the enhancer (panel a), promoter (panel b), and gene body regions (panel c) of Cyp26A1 during tRA induction. The primer pairs used in real-time PCR are shown in the schematic diagram in C. (G) EpiQ analysis of the accessibility of chromatin on the enhancer, promoter, and gene body regions of the Cyp26A1 gene during tRA induction. The cells were treated with DNase I, and the protection was quantified using real-time PCR. The results were normalized to the reference Rho gene. All of the data shown are expressed as the mean ± SD (standard deviation) of three independent biological replicates.
Figure 5.
Figure 5.
The incorporation of H3.3 is important for Cyp26A1 activation by tRA in mES cells R1. (A, panel a) The level of H3.3 protein was clearly reduced by siRNA-mediated interference. (Panel b) The effect of H3.3 knockdown on the relative levels of Cyp26A1 mRNA at different time points during tRA induction in mES cells (R1). (B, panel a) A schematic diagram of the primer pairs in the enhancer (RARE2) and promoter (RARE1) regions on the Cyp26A1 gene. The effect of H3.3 knockdown on the enrichment of H2A.Z (panels b,c) and RARα (panels d,e) on the enhancer and promoter regions of the Cyp26A1 gene during tRA induction in mES cells (R1) using ChIP assays. (C, panel a) A schematic diagram of the primer pair in the promoter (RARE1) region on the Cyp26A1 gene. The effect of H3.3 knockdown on the recruitment of TBP (panel b) and Pol II (panel c) on the promoter region of the Cyp26A1 gene during tRA induction in mES cells (R1) using ChIP assays. (D, panel a) The level of H2A.Z protein was clearly reduced by siRNA-mediated interference. (Panel b) The effect of H2A.Z knockdown on the Cyp26A1 mRNA at different time points during tRA induction in mES cells (R1). (E, panel a) A schematic diagram of the primer pairs in the enhancer (RARE2) and promoter (RARE1) regions on the Cyp26A1 gene. The effect of H2A.Z knockdown on the enrichment of H3.3 (panels b,c) and RARα (panels d,e) on the enhancer and promoter regions of the Cyp26A1 gene during tRA induction in mES cells (R1) using ChIP assays. (F, panel a) A schematic diagram of the primer pairs in the promoter (RARE1) region on the Cyp26A1 gene. The effect of H2A.Z knockdown on the recruitment of TBP (panel b) and Pol II (panel c) on the promoter region of the Cyp26A1 gene during tRA induction in mES cells (R1) using ChIP assays. (G, panel a) A schematic diagram of the primer pairs in the enhancer (RARE2) and promoter (RARE1) regions on the Cyp26A1 gene. EpiQ analysis of the accessibility of chromatin on the enhancer (panels b,d) and promoter (panels c,e) regions of the Cyp26A1 gene before tRA induction in H3.3 (panels b,c) and H2A.Z (panels d,e) knockdown mES cells (R1). The results were normalized to the reference Rho gene. Statistical analysis in the experiment was performed using two-tailed Student's t-test; (*) P < 0.05; (**) P < 0.01. All of the data shown are expressed as the mean ± SD of three independent biological replicates.
Figure 6.
Figure 6.
Genome-wide distributions of H2A.Z and H3.3 and their correlation with chromatin structures. (A,B) Correlation of the enrichment of H3.3 and/or H2A.Z with open chromatin regions (MNase-sensitive sites). (A) Genome browser tracks show the correlation of open chromatin regions (DNaseI- and MNase-sensitive sites) with the histone variant H3.3 and H2A.Z occupancy (Goldberg et al. 2010; Xiao et al. 2012). (B) Quantitative analysis of the genome-wide correlation of H3.3 (Y-axis) or H2A.Z (X-axis) with MNase-sensitive regions (total number 34,142). (C,D) The distribution of H2A.Z and H3.3 at the open and rest enhancer regions across the entire genome. H3.3 was highly enriched in the open enhancer regions with very low levels of H2A.Z (C), while there were relatively low levels of H3.3 and H2A.Z localized at the rest enhancer regions (D). (E,F) The distribution of H2A.Z and H3.3 at the repressive and active promoter regions across the entire genome. H2A.Z was highly enriched in the repressive promoter regions with very low levels of H3.3 (E), while both relatively low levels of H2A.Z and H3.3 were observed at the active promoter regions (F).
Figure 7.
Figure 7.
A model for the dynamic regulation of H2A.Z and H3.3 on gene activation. When a gene is ready to activate, H3.3 is highly enriched on the enhancer region to maintain a relatively open chromatin structure that is accessible for the binding of transcription factors (RAR/RXR); meanwhile, at the promoter region, the H3.3-dependent enrichment of H2A.Z compacts chromatin to poise gene transcription. When the gene is activated by the addition of tRA, the H3.3-containing nucleosomes at the enhancer region are immediately evicted for RAR/RXR binding; at the same time, H2A.Z is selectively replaced by canonical H2A accompanied by the deposition of H3.3 to open the chromatin structure for bindings of transcription factors and transcriptional machinery at the promoter region (the early stage of gene activation by tRA). Subsequently, the nucleosomes at the promoter region are also evicted for the full gene activation (the late stage of gene activation by tRA).

References

    1. Ahmad K, Henikoff S 2002. The histone variant H3.3 marks active chromatin by replication-independent nucleosome assembly. Mol Cell 9: 1191–1200 - PubMed
    1. Barski A, Cuddapah S, Cui K, Roh TY, Schones DE, Wang Z, Wei G, Chepelev I, Zhao K 2007. High-resolution profiling of histone methylations in the human genome. Cell 129: 823–837 - PubMed
    1. Dalvai M, Bellucci L, Fleury L, Lavigne AC, Moutahir F, Bystricky K 2012. H2A.Z-dependent crosstalk between enhancer and promoter regulates Cyclin D1 expression. Oncogene 32: 4243–4251 - PubMed
    1. Dyer PN, Edayathumangalam RS, White CL, Bao Y, Chakravarthy S, Muthurajan UM, Luger K 2004. Reconstitution of nucleosome core particles from recombinant histones and DNA. Methods Enzymol 375: 23–44 - PubMed
    1. Elsasser SJ, Huang H, Lewis PW, Chin JW, Allis CD, Patel DJ 2012. DAXX envelops a histone H3.3-H4 dimer for H3.3-specific recognition. Nature 491: 560–565 - PMC - PubMed

Publication types

MeSH terms