. 2013 Sep 15;27(18):1974-85.
doi: 10.1101/gad.226613.113.

Cancer-associated IDH2 mutants drive an acute myeloid leukemia that is susceptible to Brd4 inhibition

Affiliations

Cancer-associated IDH2 mutants drive an acute myeloid leukemia that is susceptible to Brd4 inhibition

Chong Chen et al. Genes Dev. .

Abstract

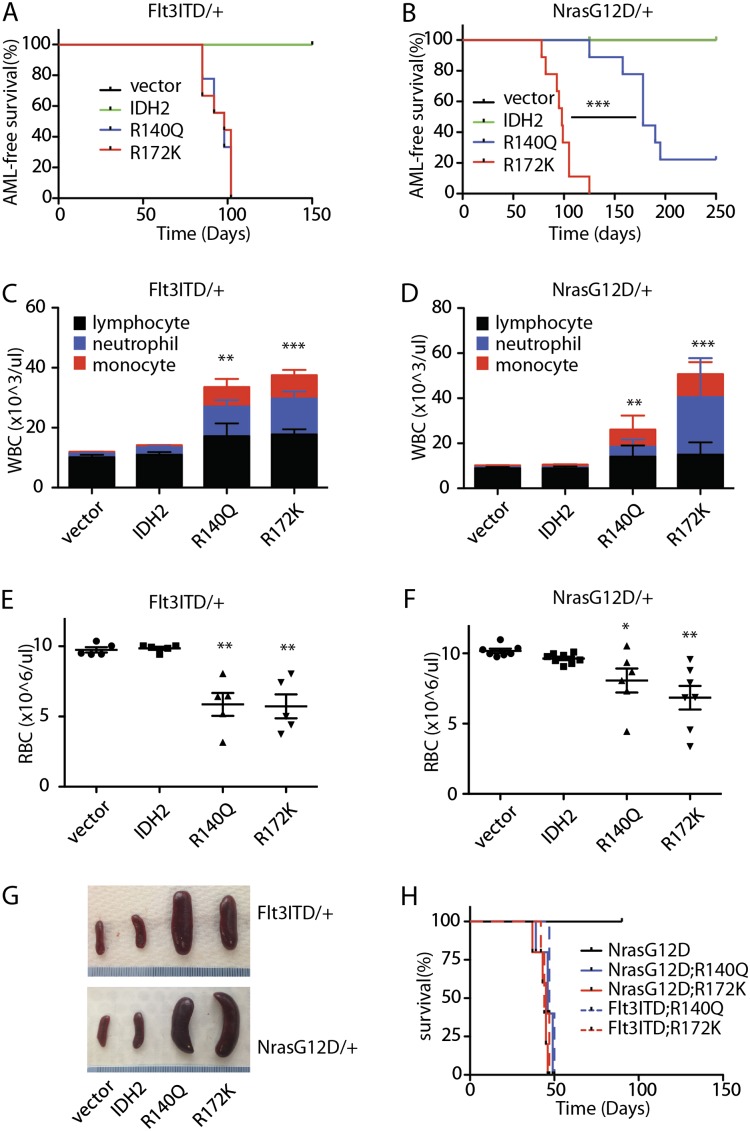
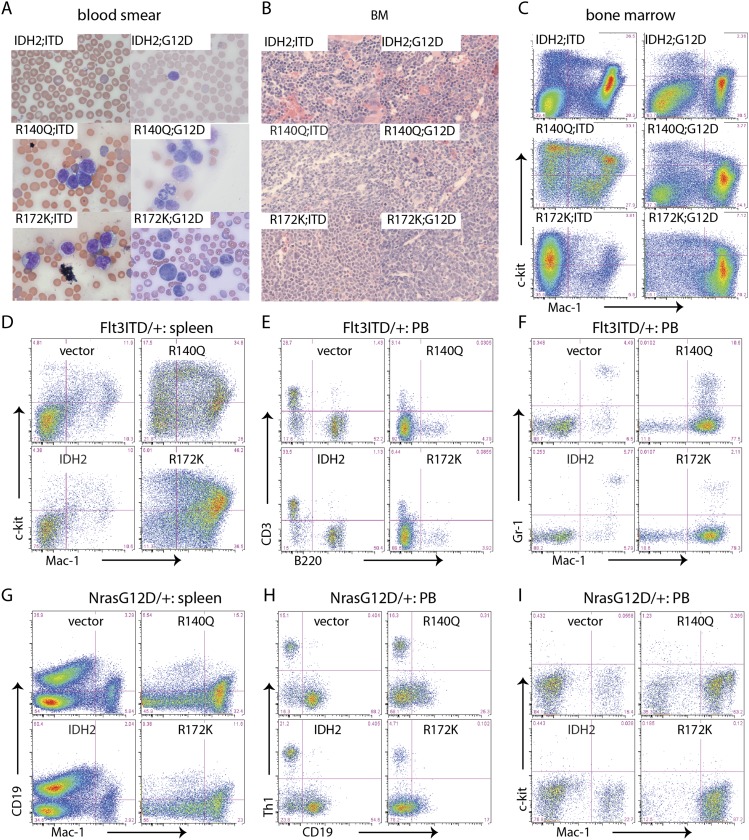
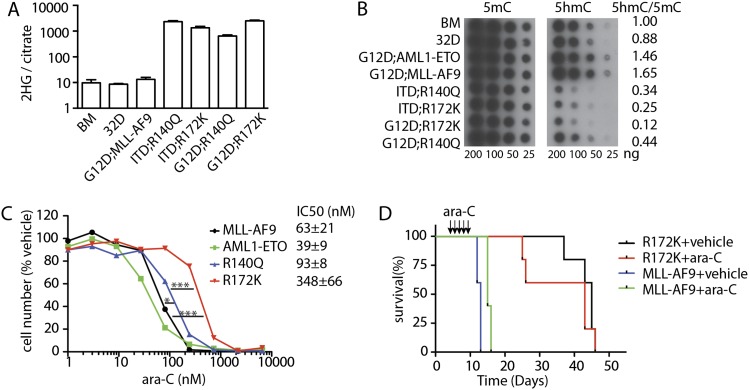
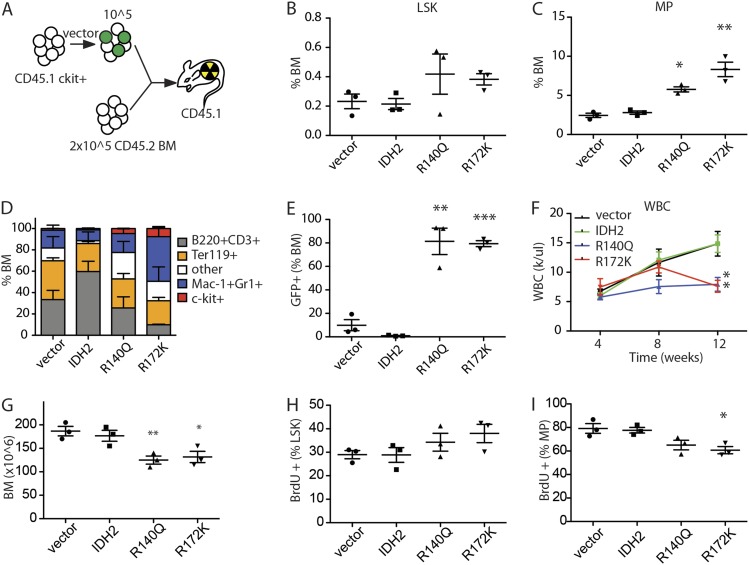
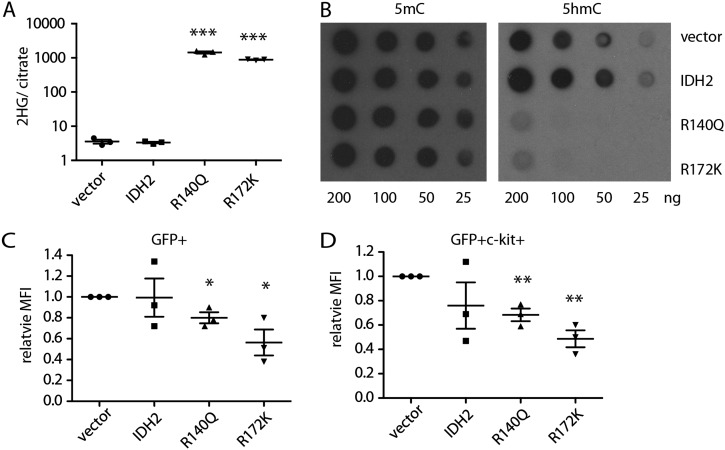
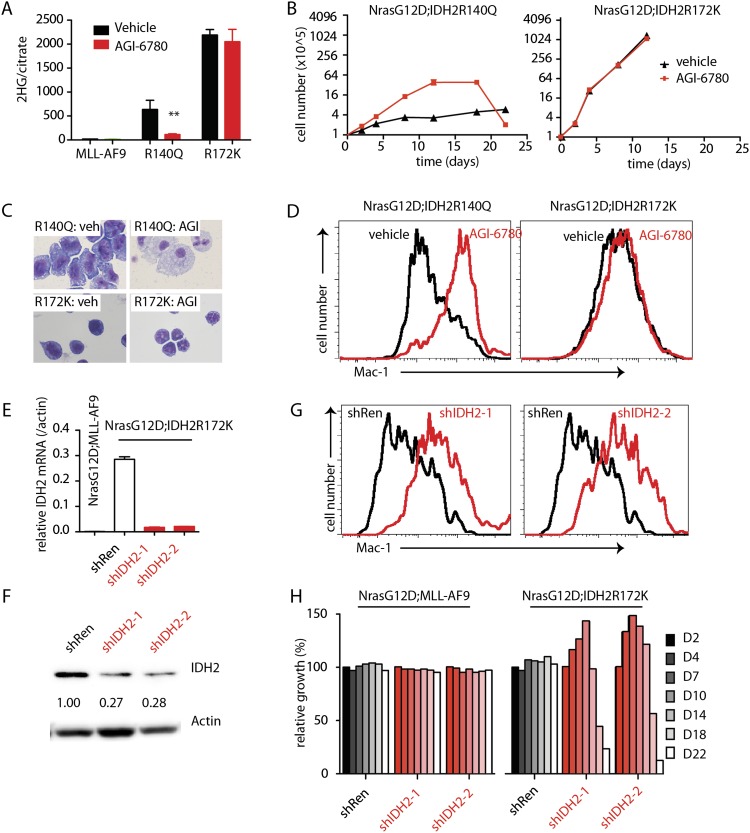
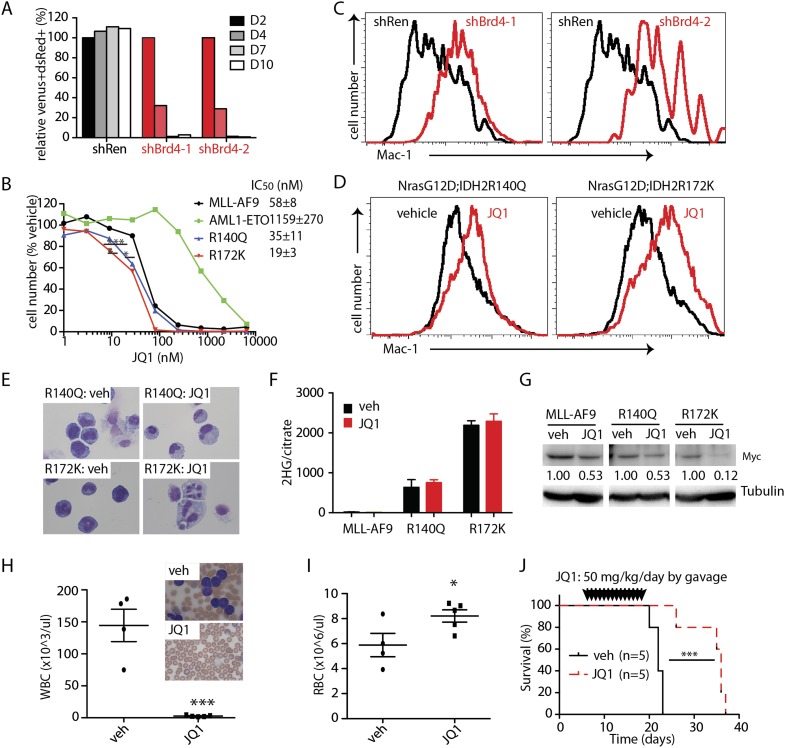
Somatic mutations in the isocitrate dehydrogenase (IDH) genes IDH1 and IDH2 occur frequently in acute myeloid leukemia (AML) and other cancers. These genes encode neomorphic proteins that produce the presumed oncometabolite 2-hydroxyglutarate (2-HG). Despite the prospect of treating AML and other cancers by targeting IDH mutant proteins, it remains unclear how these mutants affect tumor development and maintenance in vivo, and no cancer models exist to study the action of IDH2 mutants in vivo. We show that IDH2 mutants can cooperate with oncogenic Flt3 or Nras alleles to drive leukemia in mice by impairing the differentiation of cells of the myeloid lineage. Pharmacologic or genetic inhibition of IDH2 triggers the differentiation and death of AML cells, albeit only with prolonged IDH2 inhibition. In contrast, inhibition of the bromodomain-containing protein Brd4 triggers rapid differentiation and death of IDH2 mutant AML. Our results establish a critical role for mutant IDH2 in leukemogenesis and tumor maintenance and identify an IDH-independent strategy to target these cancers therapeutically.

Keywords: AML; Brd4 inhibition; IDH mutants; targeted therapy; tumor maintenance.


Figures

Figure 1.
Figure 1.
IDH2 mutants cooperate with class I mutations to promote leukemia. (A) Kaplan-Meier survival curve of mice transplanted with Flt3-ITD HSPCs transduced with empty MSCV-IRES-GFP vector (pMIG), IDH2 wild type (WT), or mutants (IDH2R140Q and IDH2R172K). n = 9. (B) Kaplan-Meier survival curve of mice transplanted with NrasG12D HSPCs transduced with empty vector (pMIG), IDH2 wild type, or mutants (IDH2R140Q and IDH2R172K). n = 9. (C) White blood cell (WBC) counts of mice transplanted with Flt3-ITD HSPCs transduced with empty vector (pMIG), IDH2 wild type, or mutants (IDH2R140Q and IDH2R172K) at 12 wk after transplantation. n = 5. (D) WBC counts of mice transplanted with NrasG12D HSPCs transduced with empty vector (pMIG), IDH2 wild type, or mutants (IDH2R140Q and IDH2R172K) at 12 wk after transplantation. n = 5. (E) Red blood cell (RBC) counts of mice transplanted with Flt3-ITD HSPCs transduced with empty vector (pMIG), IDH2 wild type, or mutants (IDH2R140Q and IDH2R172K) at 12 wk after transplantation. n = 5. (F) RBC counts of mice transplanted with NrasG12D HSPCs transduced with empty vector (pMIG), IDH2 wild type, or mutants (IDH2R140Q and IDH2R172K) at 12 wk after transplantation. n = 5. (G) Representative pictures of the spleens of recipient mice transplanted with Flt3-ITD or NrasG12D HSPCs transduced with empty vector (pMIG), IDH2 wild type, or mutants (IDH2R140Q and IDH2R172K). (H) Kaplan-Meier survival curve of the secondary recipient mice transplanted with Flt3-ITD or NrasG12D HSPCs transduced with IDH2 wild type or mutants (IDH2R140Q and IDH2R172K). n = 5. (*) P < 0.05; (**) P < 0.01; (***) P < 0.001.
Figure 2.
Figure 2.
IDH2 mutations result in AML. (A) Blood smear of recipient mice transplanted with Flt3-ITD or NrasG12D HSPCs transduced with IDH2 wild type (WT) or mutants (IDH2R140Q and IDH2R172K). (B) H&E staining of BM sections (400×) of recipient mice transplanted with IDH2 wild-type- or mutant-expressing cells. (C) Representative flow plots of BM cells from recipient mice transplanted with Flt3-ITD or NrasG12D HSPCs transduced with IDH2 wild type, or mutants (IDH2R140Q and IDH2R172K). (D) Representative flow plots of splenocytes stained with Mac-1 and c-kit of recipients transplanted with Flt3-ITD cells transduced with empty vector, IDH2 wild type, or mutants (IDH2R140Q and IDH2R172K). (E) Representative flow plots of peripheral blood stained with B220 and CD3 of recipients transplanted with Flt3-ITD cells transduced with empty vector, IDH2 wild type, or mutants (IDH2R140Q and IDH2R172K). (F) Representative flow plots of peripheral blood stained with Mac-1 and Gr-1 of recipients transplanted with Flt3-ITD cells transduced with empty vector, IDH2 wild type, or mutants (IDH2R140Q and IDH2R172K). (G) Representative flow plots of splenocytes stained with Mac-1 and CD19 of recipients transplanted with NrasG12D cells transduced with empty vector, IDH2 wild type, or mutants (IDH2R140Q and IDH2R172K). (H) Representative flow plots of peripheral blood stained with CD19 and Thy1 of recipients transplanted with NrasG12D cells transduced with empty vector, IDH2 wild type, or mutants (IDH2R140Q and IDH2R172K). (I) Representative flow plots of peripheral blood stained with Mac-1 and c-kit of recipients transplanted with NrasG12D cells transduced with empty vector, IDH2 wild type, or mutants (IDH2R140Q and IDH2R172K).
Figure 3.
Figure 3.
IDH2 mutant-induced AMLs display high 2-HG levels and altered DNA methylation and are chemoresistant. (A) 2-HG levels in BM, 32D, and MLL-AF9 or IDH2 mutant-induced AMLs. n = 3–5. (B) Representative dot blotting with antibodies against 5mC and 5hmC displaying DNA methylation of nonleukemic (BM and 32D) and leukemic cells. (C) Dose response of NrasG12D;MLL-AF9, NrasG12D;AML1-ETO, NrasG12D;IDH2R140Q, and NrasG12D;IDH2R172K leukemic cells to ara-C. Leukemic cells were treated with vehicle or 1–6000 nM ara-C for 3 d. n = 4. (D) Kaplan-Meier survival curve of mice transplanted with NrasG12D;MLL-AF9 or NrasG12D;IDH2R172K leukemic cells treated with ara-C or vehicle. n = 5.
Figure 4.
Figure 4.
IDH2 mutations are sufficient to block differentiation of HSPCs and alter DNA methylation. (A) Schematic diagram of competitive transplant assay. Vector refers to transduction of cells with empty MSCV-IRES-GFP vector or one coexpressing wild-type IDH2 or an IDH2 mutant. CD45.1 c-kit+ HSPCs (105) transduced with vectors were mixed with 2 × 10⁵ CD45.2 BM and transplanted into lethally irradiated CD45.1 recipient mice. (B) Percentage of linSca-1+c-kit+ (LSK) cells in the whole BM of recipient mice 12 wk after transplantation. n = 3. (C) Percentage of linSca-1c-kit+ (MP) cells in the whole BM of recipient mice 12 wk after transplantation. n = 3. (D) Percentage of c-kit+, Mac-1+ or Gr-1+, B220+ or CD3+, and Ter119+ cells in the whole BM of recipient mice 12 wk after transplantation. n = 3. (E) Percentage of GFP+ cells in the whole BM of recipient mice 12 wk after transplantation. n = 3. (F) WBC counts of recipient mice with IDH2 wild-type- or mutant-expressing cells. n = 4–5. (G) BM cellularities of recipient mice with IDH2 wild-type- or mutant-expressing cells at 12 wk after transplantation. n = 3. (H) BrdU incorporation rate of LSK cells after 1 d of labeling. n = 3. (I) BrdU incorporation rate of MP cells after 1 d of labeling. n = 3. Of note, in B–G, vector, IDH2, or IDH2 mutants refers to mice transplanted with HSPCs transduced with the indicated vector but does not necessarily indicate that all of the cells analyzed expressed the constructs. Specifically, while BM from mice transplanted with IDH2 mutant cells almost completely consisted of GFP+ IDH mutant-expressing cells (shown in E), empty vector and wild-type IDH produced a competitive disadvantage, and BM consisted entirely of GFP normal competitors at this time point.
Figure 5.
Figure 5.
IDH2 mutants lead to abnormal DNA methylation in hematopoietic cells. (A) 2-HG levels in the whole BM cells of recipient mice. n = 3. (B) Representative dot blots showing 5mC and 5hmC levels of whole BM genomic DNA. (C) Relative mean fluorescence intensity (MFI) of 5hmC in GFP+ BM cells. n = 3. (D) Relative MFI of 5mC in GFP+ c-kit+ BM cells. n = 3.
Figure 6.
Figure 6.
Inhibition of IDH2 mutants leads to loss of 2-HG and delayed differentiation. (A) 2-HG levels of leukemic cells treated with 5 μM AGI-6780 for 2 d. n = 3. (B) Growth of leukemic cells treated with 5 μM AGI-6780 or vehicle. n = 4. (C) Representative H&E staining of cytospin of NrasG12D;IDH2R140Q and NrasG12D;IDH2R172K leukemic cells treated with vehicle or 5 μM AGI-6780 at day 22. (D) Expression levels of Mac-1 by NrasG12D;IDH2R140Q and NrasG12D;IDH2R172K leukemic cells treated with vehicle or 5 μM AGI-6780 at day 22. (E) Transcript levels of hIDH2 in NrasG12D;IDH2R172K cells expressing shRen or shIDH2, normalized to actin mRNA. n = 4. (F) Western blot demonstrating hIDH2 knockdown in NrasG12D;IDH2R172K leukemic cells by shRNAs against mutant IDH2. (G) Relative growth of NrasG12D;MLL-AF9 and NrasG12D;IDH2R172K leukemic cells with shRen or shIDH2. n = 3. (H) Expression levels of Mac-1 by NrasG12D;IDH2R140Q and NrasG12D;IDH2R172K leukemic cells treated with shRen or shIDH2.
Figure 7.
Figure 7.
IDH mutant leukemias rapidly differentiate in response to Brd4 inhibition. (A) Relative growth of NrasG12D;IDH2R172K leukemic cells with Brd4 knockdown. n = 3. (B) Dose response of NrasG12D;MLL-AF9, NrasG12D;AML1-ETO, NrasG12D;IDH2R140Q, and NrasG12D;IDH2R172K to JQ1. Leukemic cells were treated with vehicle or 1–6000 nM JQ1 for 3 d. n = 4. (C) Representative flow plots showing Mac-1 expression levels in NrasG12D;IDH2R172K leukemic cells with shRen or shBrd4 3 d after doxycycline induction. (D) Representative flow plots showing Mac-1 expression levels in NrasG12D;IDH2R140Q and NrasG12D;IDH2R172K leukemic cells treated with vehicle or 50 nM JQ1 for 2 d. (E) Representative cytospin staining of NrasG12D;IDH2R140Q and NrasG12D;IDH2R172K leukemic cells treated with vehicle or 50 nM JQ1 for 2 d. (F) 2-HG levels of NrasG12D;MLL-AF9, NrasG12D;IDH2R140Q, and NrasG12D;IDH2R172K leukemic cells treated with vehicle or 50 nM JQ1 for 2 d. n = 3. (G) Western blotting of Myc levels in NrasG12D;MLL-AF9, NrasG12D;IDH2R140Q, and NrasG12D;IDH2R172K leukemic cells treated with vehicle or 50 nM JQ1 for 2 d. The numbers indicate normalized Myc levels by densitometry. (H) WBC counts of NrasG12D;IDH2R172K recipient mice treated with vehicle or JQ1 at day 20 after transplant. Inserts show the representative blood smear of vehicle- or JQ1-treated mice. Vehicle, n = 4; JQ1, n = 5. (I) RBC counts of NrasG12D;IDH2R172K recipient mice treated with vehicle or JQ1 20 d after transplant. Vehicle, n = 4; JQ1, n = 5. (J) Kaplan-Meier survival curve of NrasG12D;IDH2R172K recipient mice treated with vehicle or JQ1. The mice were treated with vehicle or 50 mg/kg per day JQ1 by gavage from day 5 to day 18 after transplant. n = 5.

Comment in

References

    1. Amary MF, Bacsi K, Maggiani F, Damato S, Halai D, Berisha F, Pollock R, O'Donnell P, Grigoriadis A, Diss T, et al. 2011. IDH1 and IDH2 mutations are frequent events in central chondrosarcoma and central and periosteal chondromas but not in other mesenchymal tumours. J Pathol 224: 334–343 - PubMed
    1. Bernt KM, Zhu N, Sinha AU, Vempati S, Faber J, Krivtsov AV, Feng Z, Punt N, Daigle A, Bullinger L, et al. 2011. MLL-rearranged leukemia is dependent on aberrant H3K79 methylation by DOT1L. Cancer Cell 20: 66–78 - PMC - PubMed
    1. The Cancer Genome Atlas Research Network 2013. Genomic and epigenomic landscapes of adult de novo acute myeloid leukemia. N Engl J Med 368: 2059–2074 - PMC - PubMed
    1. Chen C, Liu Y, Liu R, Ikenoue T, Guan KL, Zheng P 2008. TSC-mTOR maintains quiescence and function of hematopoietic stem cells by repressing mitochondrial biogenesis and reactive oxygen species. J Exp Med 205: 2397–2408 - PMC - PubMed
    1. Chu SH, Heiser D, Li L, Kaplan I, Collector M, Huso D, Sharkis SJ, Civin C, Small D 2012. FLT3-ITD knockin impairs hematopoietic stem cell quiescence/homeostasis, leading to myeloproliferative neoplasm. Cell Stem Cell 11: 346–358 - PMC - PubMed

MeSH terms