. 2013 Sep 15;27(18):1986-98.
doi: 10.1101/gad.226753.113.

Induction of sarcomas by mutant IDH2

Affiliations

Induction of sarcomas by mutant IDH2

Chao Lu et al. Genes Dev. .

Abstract

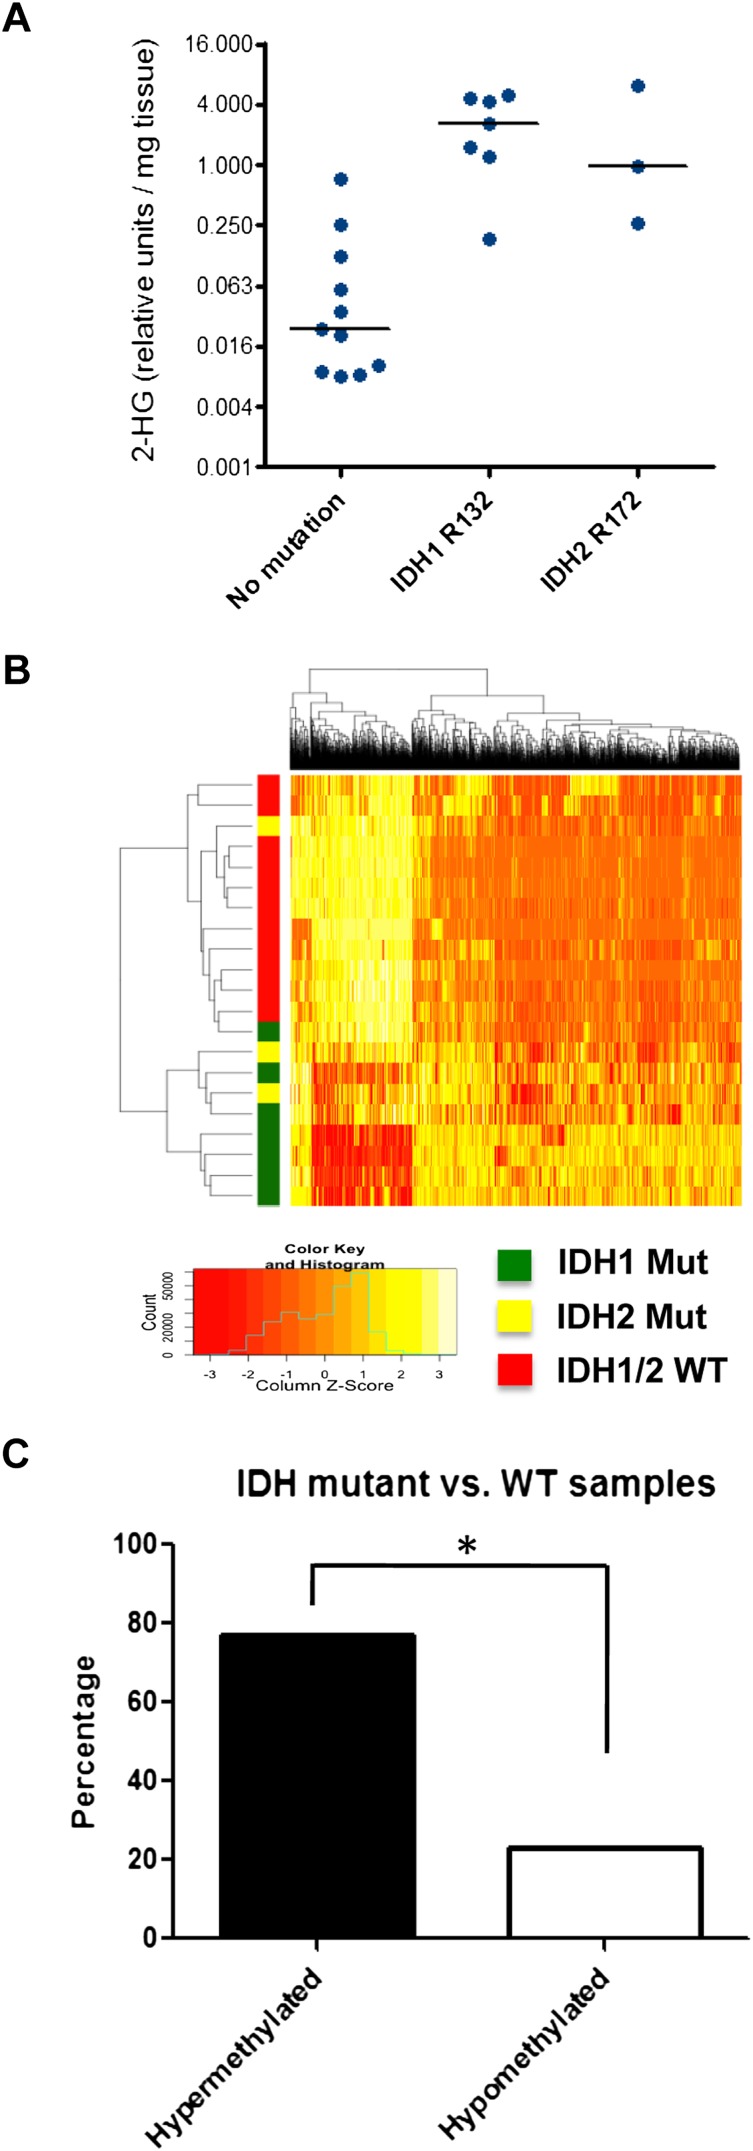
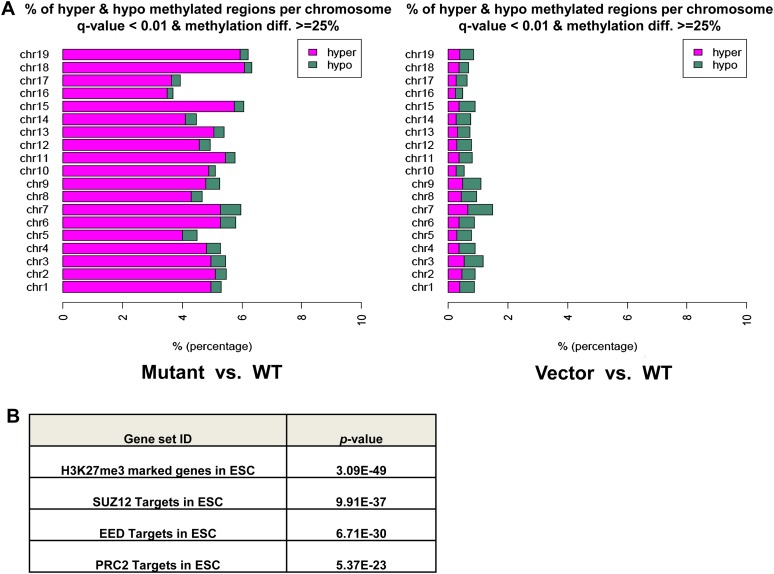
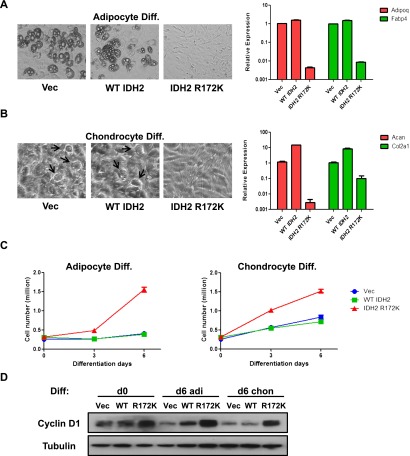
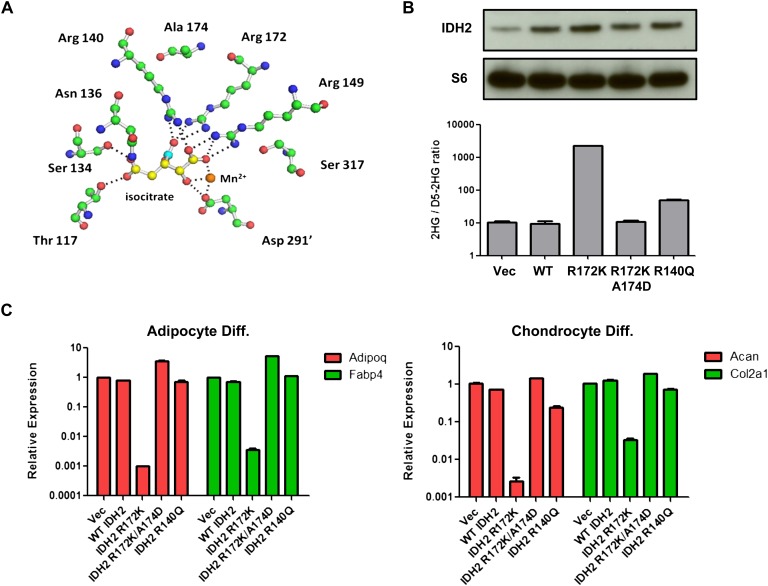
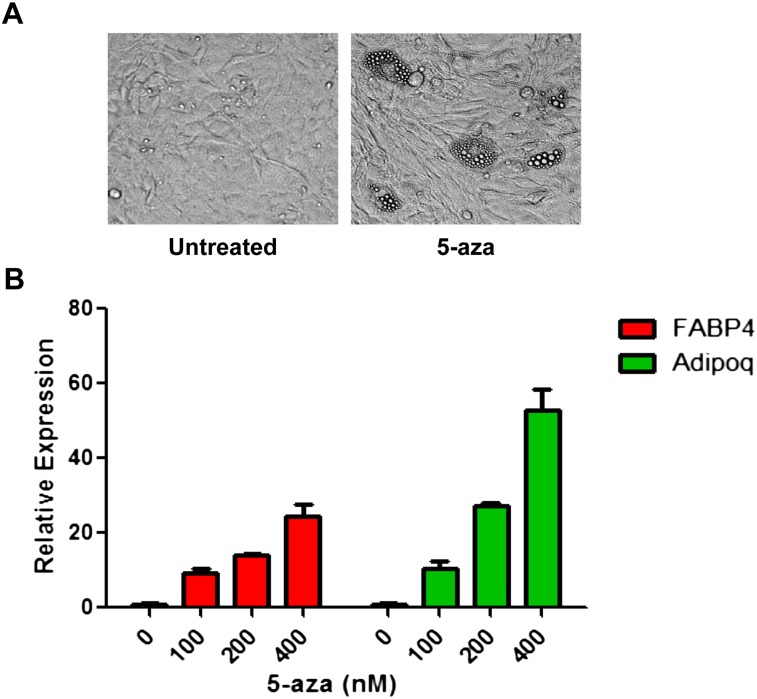
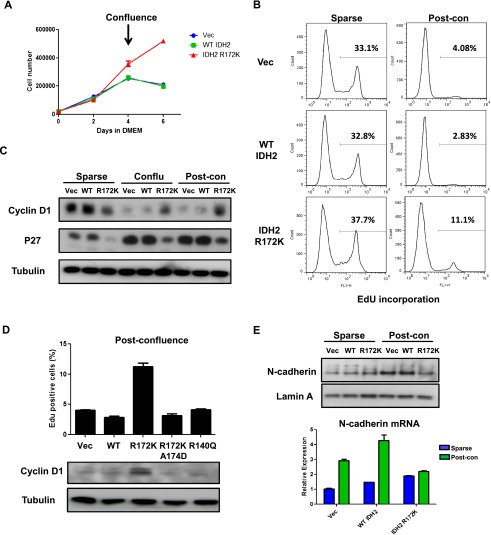
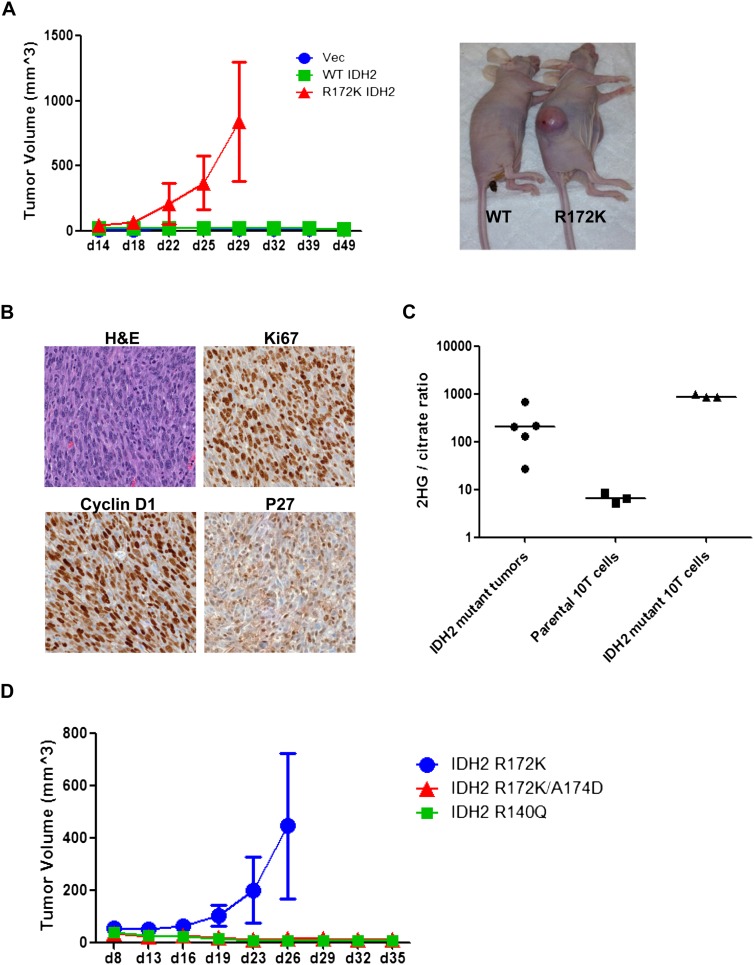
More than 50% of patients with chondrosarcomas exhibit gain-of-function mutations in either isocitrate dehydrogenase 1 (IDH1) or IDH2. In this study, we performed genome-wide CpG methylation sequencing of chondrosarcoma biopsies and found that IDH mutations were associated with DNA hypermethylation at CpG islands but not other genomic regions. Regions of CpG island hypermethylation were enriched for genes implicated in stem cell maintenance/differentiation and lineage specification. In murine 10T1/2 mesenchymal progenitor cells, expression of mutant IDH2 led to DNA hypermethylation and an impairment in differentiation that could be reversed by treatment with DNA-hypomethylating agents. Introduction of mutant IDH2 also induced loss of contact inhibition and generated undifferentiated sarcomas in vivo. The oncogenic potential of mutant IDH2 correlated with the ability to produce 2-hydroxyglutarate. Together, these data demonstrate that neomorphic IDH2 mutations can be oncogenic in mesenchymal cells.

Keywords: 2-hydroxyglutarate; DNA methylation; chondrosarcoma; contact inhibition; differentiation; isocitrate dehydrogenase mutation; tumorigenesis.


Figures

Figure 1.
Figure 1.
ERRBS analysis of chondrosarcoma patient samples. (A) Twenty-one blinded chondrosarcoma samples were analyzed for 2HG levels by gas chromatography-mass spectrometry (GC-MS). Subsequently, samples were decoded and grouped according to IDH1/2 mutational status. (B) ERRBS was performed on genomic DNA extracted from chondrosarcoma patient samples to generate genome-wide base-pair resolution CpG methylation information. A heat map representing the hierarchical clustering of samples with wild-type (WT) or mutant IDH1/2 is shown, based on a supervised analysis for differentially methylated CpGs at CpG islands. Each row represents a sample, and each column represents a CpG. The level of methylation is represented using a color scale, as shown in the legend. (C) Bar graph showing the percentage of hypermethylated and hypomethylated CpGs comparing IDH1/2 mutant with wild-type chondrosarcoma samples. (*) P < 0.0001 by χ2 test.
Figure 2.
Figure 2.
Mutant IDH2 induces CpG island hypermethylation phenotype. (A) Stacking bar graph showing percentage of hypermethylated and hypomethylated CpGs of all CpGs located in CpG islands for each chromosome, comparing IDH2 R172K mutant with wild-type (WT) cells (left) or vector with IDH2 wild-type cells (right). Green represents proportion of hypomethylated cytosines, and magenta represents hypermethylated ones. Only CpGs with a Q-value <0.01 and a methylation difference of at least 25% are shown. (B) GSEA was performed on genes that were promoter DNA-hypermethylated in IDH2 R172K mutant cells. The table shows the top four most significantly enriched gene sets from the Broad Institute database and their P-values.
Figure 3.
Figure 3.
IDH2 mutation inhibits mesenchymal differentiation. (A) Vector (Vec), wild-type (WT), or R172K mutant IDH2 cells were treated with adipocyte differentiation cocktail. After 7 d of differentiation induction, representative microscopic images of cell morphology were recorded, and mRNA expression of Adipoq and Fabp4 was measured by quantitative real-time PCR (qRT-PCR). (B) Vector, wild-type, or R172K mutant IDH2 cells were treated with chondrocyte differentiation cocktail. After 10 d of differentiation induction, representative microscopic images of cell morphology were recorded (arrowheads point to mature chondrocyte-resembling cells), and mRNA expression of Acan and Col2a1 was measured by qRT-PCR. (C) 10T vector, wild-type, or R172K mutant IDH2 cells were treated with adipocyte or chondrocyte differentiation cocktails. Cell numbers were counted at days 0, 3, and 6 after differentiation induction. (D) Six days after adipocyte or chondrocyte differentiation induction, 10T vector, wild-type, or R172K mutant IDH2 cells were lysed, and protein levels of cyclin D1 were measured by Western blot. Tubulin was used as loading control. For all experiments, the average ± SD from three biological replicates are shown.
Figure 4.
Figure 4.
Differentiation impairment by mutant IDH2 correlates with 2HG production. (A) Structural modeling of IDH2 catalytic site showing Arg 172 and Ala 174. Isocitrate carbons are in yellow except carbon 6 containing the β-carboxyl, which is highlighted in cyan. Carbon atoms of amino acids (green), amines (blue), and oxygens (red) are also depicted. Hydrogen atoms are omitted for clarity. Dashed lines show <3.1 Å interactions corresponding to hydrogen and ionic bonds. The prime (′) denotes that the residue comes from the other monomer of the IDH dimer. (B) 10T cells expressing vector (Vec), wild-type (WT), R172K, R172K/A174D, or R140Q mutant IDH2 were lysed, and IDH2 expression was measured by Western blot. 2HG levels were measured by GC-MS and normalized to internal standard (D5-2HG) and cell number. (C) 10T cells expressing wild-type or various mutant IDH2 were treated with adipocyte or chondrocyte differentiation cocktails. mRNA expression of Adipoq, Fabp4, Acan, and Col2a1 was measured by qRT-PCR after 8 d of differentiation induction. For all experiments, the average ± SD from three biological replicates are shown.
Figure 5.
Figure 5.
DNA-hypomethylating agent reverses the differentiation defect in mutant IDH2 cells. (A) After 8 d of adipocyte differentiation induction, microscopic images of cell morphology were recorded in IDH2 R172K mutant cells with or without transient 5-aza treatment. (B) After 8 d of adipocyte differentiation induction, mRNA expression of Adipoq and Fabp4 in IDH2 R172K mutant cells with or without transient 5-aza treatment was measured by qRT-PCR. The average ± SD from three biological replicates are shown.
Figure 6.
Figure 6.
IDH2 mutant cells show loss of contact inhibition. (A) 10T vector (Vec), wild-type (WT), or R172K mutant IDH2 cells were cultured in Dulbecco's modified Eagle's medium (DMEM), and cell numbers were counted at days 0, 2, 4, and 6. Cells reached confluence between days 2 and 4. (B) Vector, wild-type, or R172K mutant IDH2 cells at sparse or post-confluence day 2 were incubated with EdU for 4 h. Percentage of EdU-positive cells was measured by flow cytometry. Histograms from a representative experiment from a total of two experiments are shown. (C) Vector, wild-type, or R172K mutant IDH2 cells were lysed at sparse, confluence, or 2 d post-confluence. Protein levels of cyclin D1 and p27 were measured by Western blot. Tubulin was used as loading control. (D) 10T cells expressing wild-type or various mutant IDH2s at post-confluence day 2 were incubated with EdU for 4 h. Percentage of EdU-positive cells was measured using flow cytometry. Cells were also lysed, and cyclin D1 levels were measured by Western blot. Tubulin was used as loading control. (E) Vector, wild-type, or R172K mutant IDH2 cells were lysed at sparse or 2 d post-confluence. Levels of N-cadherin protein expression were measured by Western blot, and mRNA expression was measured by qRT-PCR. For all experiments, the average ± SD from three biological replicates are shown.
Figure 7.
Figure 7.
IDH2 mutant cells generate mesenchymal tumors in vivo. (A) We injected 1 × 10⁷ 10T vector (Vec), wild-type (WT), or R172K mutant IDH2 cells subcutaneously into nude mice. Tumor growth was monitored and measured. The insert image is shown for mice implanted with wild-type cells (left) or mutant cells (right) at the time of sacrifice. (B) Immunohistochemical staining was performed on R172K mutant IDH2 tumors using specific antibodies, and representative images are shown for sections stained with hematoxylin and eosin (H&E), Ki67, cyclin D1, and p27. (C) 2HG levels in R172K mutant IDH2 tumors and parental or R172K mutant IDH2 10T cells cultured in vitro were measured by GC-MS. The ratio of 2HG to citrate is shown. (D) We injected 1 × 10⁷ 10T R172K, R172K/A174D, or R140Q mutant IDH2 cells subcutaneously into nude mice. Tumor growth was monitored and measured. For all experiments, the average tumor volumes ± SD of five mice per group are shown.

Comment in

References

    1. Akalin A, Garrett-Bakelman FE, Kormaksson M, Busuttil J, Zhang L, Khrebtukova I, Milne TA, Huang Y, Biswas D, Hess JL, et al. 2012a. Base-pair resolution DNA methylation sequencing reveals profoundly divergent epigenetic landscapes in acute myeloid leukemia. PLoS Genet 8: e1002781. - PMC - PubMed
    1. Akalin A, Kormaksson M, Li S, Garrett-Bakelman FE, Figueroa ME, Melnick A, Mason CE 2012b. methylKit: A comprehensive R package for the analysis of genome-wide DNA methylation profiles. Genome Biol 13: R87. - PMC - PubMed
    1. Amary MF, Bacsi K, Maggiani F, Damato S, Halai D, Berisha F, Pollock R, O'Donnell P, Grigoriadis A, Diss T, et al. 2011a. IDH1 and IDH2 mutations are frequent events in central chondrosarcoma and central and periosteal chondromas but not in other mesenchymal tumours. J Pathol 224: 334–343 - PubMed
    1. Amary MF, Damato S, Halai D, Eskandarpour M, Berisha F, Bonar F, McCarthy S, Fantin VR, Straley KS, Lobo S, et al. 2011b. Ollier disease and Maffucci syndrome are caused by somatic mosaic mutations of IDH1 and IDH2. Nat Genet 43: 1262–1265 - PubMed
    1. Arai M, Nobusawa S, Ikota H, Takemura S, Nakazato Y 2012. Frequent IDH1/2 mutations in intracranial chondrosarcoma: A possible diagnostic clue for its differentiation from chordoma. Brain Tumor Pathol 29: 201–206 - PubMed

Publication types

MeSH terms