. 2013 Sep 18:6:28.
doi: 10.3389/fnmol.2013.00028. eCollection 2013.

Temporal dynamics of a homeostatic pathway controlling neural network activity

Affiliations

Temporal dynamics of a homeostatic pathway controlling neural network activity

Helen S Bateup et al. Front Mol Neurosci. .

Abstract

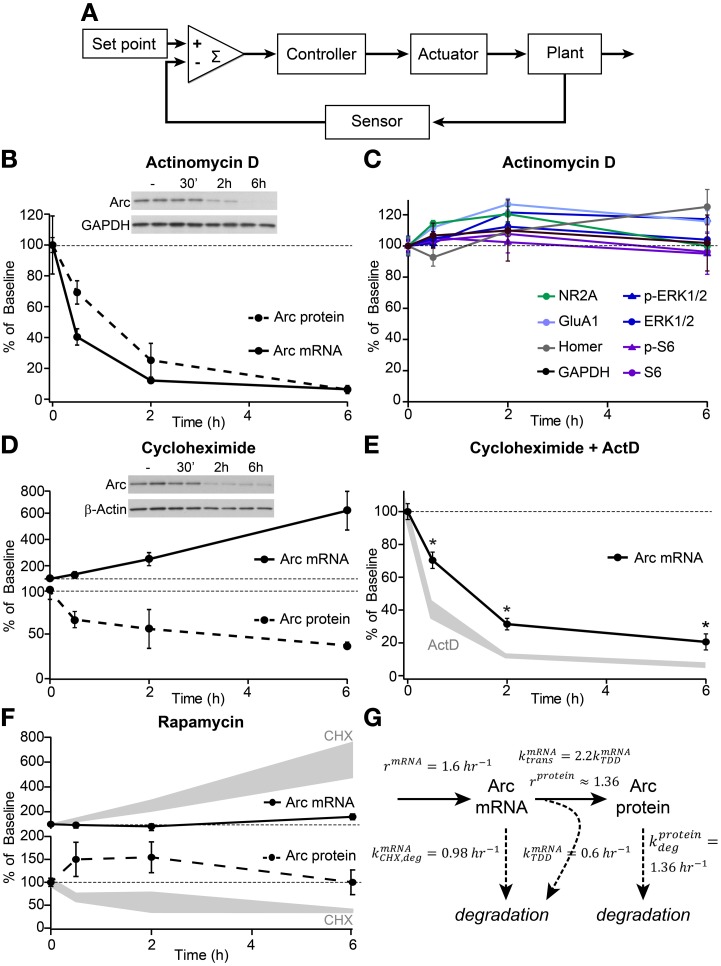
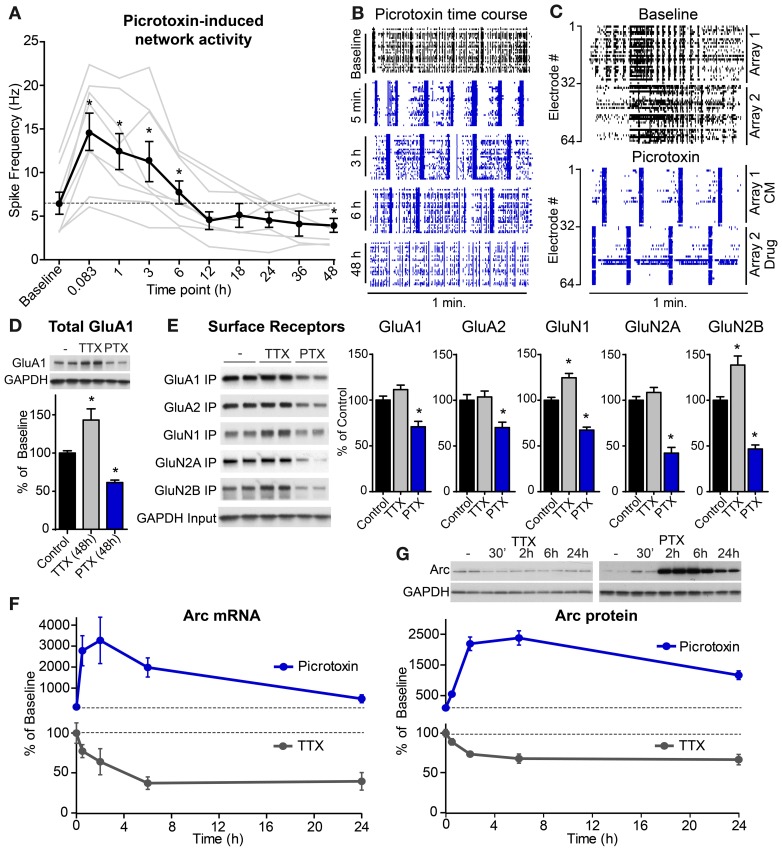
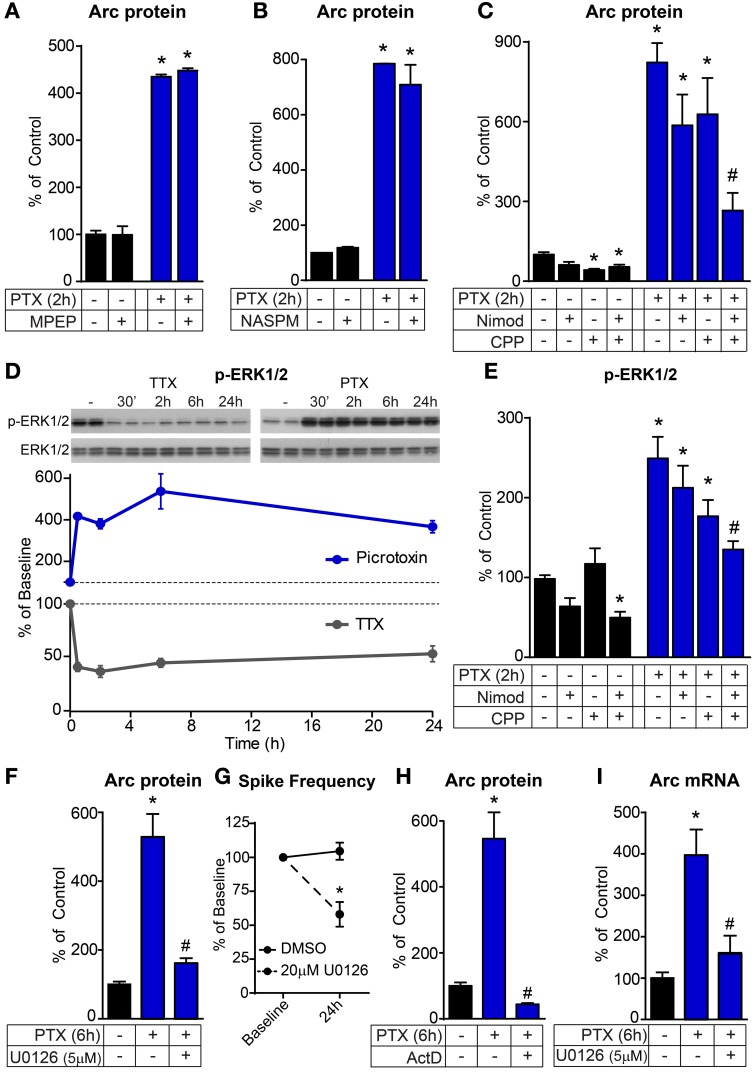
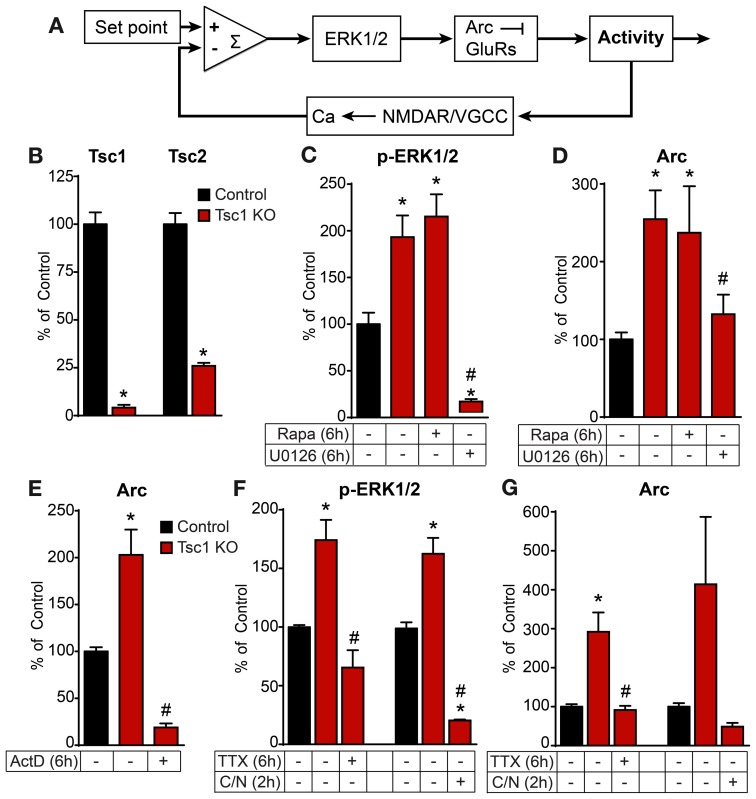
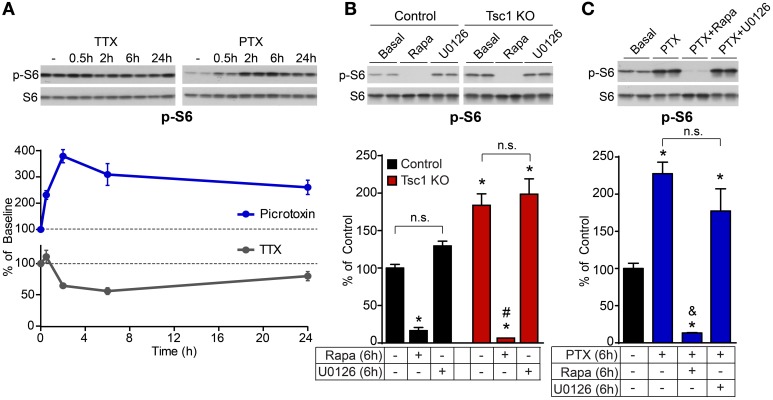
Neurons use a variety of mechanisms to homeostatically regulate neural network activity in order to maintain firing in a bounded range. One such process involves the bi-directional modulation of excitatory synaptic drive in response to chronic changes in network activity. Down-scaling of excitatory synapses in response to high activity requires Arc-dependent endocytosis of glutamate receptors. However, the temporal dynamics and signaling pathways regulating Arc during homeostatic plasticity are not well understood. Here we determine the relative contribution of transcriptional and translational control in the regulation of Arc, the signaling pathways responsible for the activity-dependent production of Arc, and the time course of these signaling events as they relate to the homeostatic adjustment of network activity in hippocampal neurons. We find that an ERK1/2-dependent transcriptional pathway active within 1-2 h of up-regulated network activity induces Arc leading to a restoration of network spiking rates within 12 h. Under basal and low activity conditions, specialized mechanisms are in place to rapidly degrade Arc mRNA and protein such that they have half-lives of less than 1 h. In addition, we find that while mTOR signaling is regulated by network activity on a similar time scale, mTOR-dependent translational control is not a major regulator of Arc production or degradation suggesting that the signaling pathways underlying homeostatic plasticity are distinct from those mediating synapse-specific forms of synaptic depression.

Keywords: Arc; ERK signaling; TSC/mTOR; activity-dependent gene regulation; hippocampus; homeostatic plasticity; multi-electrode array; network activity.


Figures

Figure 1
Figure 1
Arc mRNA and protein exhibit high basal turnover rates and translation-dependent mRNA decay. (A) Schematic depicting the elements of a homeostatic negative feedback system. (B) Decay curves of Arc mRNA (measured by quantitative RT-PCR, solid line) and protein (determined by western blotting, dashed line) from dissociated hippocampal cultures following treatment with 8 μM actinomycin D (ActD) for the indicated times in hours. (C) Western blotting of the synaptic and signaling proteins indicated in the legend revealed no effects of 6 h treatment with actinomycin D on total protein levels or phosphorylation state. (D) Time courses of Arc mRNA accumulation (solid line) and protein degradation (dashed line) following treatment with 10 μM cycloheximide (CHX). (E) Decay curves of Arc mRNA levels following combined treatment with 8 μM ActD and 10 μM CHX (black line) versus ActD alone (shaded gray, replotted from B). *Indicates significant difference (p < 0.05) from ActD alone. (F) Treatment with 50 nM rapamycin had no significant effect on Arc mRNA (top panel, solid line) or Arc protein (bottom panel, dashed line) levels. For comparison, Arc mRNA and protein levels following CHX treatment are replotted from (D) in shaded gray. (G) Diagram detailing experimentally-derived time constants for the production and degradation of Arc mRNA and protein. See methods for the derivation of these values. All data are from 2–3 independent experiments and are represented as mean ± SEM. Dotted lines at 100% indicate baseline levels.
Figure 2
Figure 2
High levels of network activity induce Arc mRNA and protein, down-scaling of glutamate receptors, and homeostatic plasticity of network spiking rates. (A) Average spike rate per electrode (n = 8 experiments, plotted individually in gray) from hippocampal neurons plated onto multi-electrode arrays and treated with 0.5 μM picrotoxin for the indicated durations in hours. (B) Raster plots of multi-unit activity recorded at different times following picrotoxin treatment. Each line represents a single spike detected in a given channel during a one minute recording. (C) Neurons were plated onto two sides of a split-chamber MEA and baseline activity was recorded from both cultures at DIV 14 (top panel). The neurons on electrodes #1–32 (Array 1) were then treated with conditioned media (CM) from another culture previously incubated with 1 μM picrotoxin for six hours. The neurons on electrodes #33–64 (Array 2) were treated with 1 μM freshly prepared picrotoxin (Drug). Spiking responses were recorded five minutes later (bottom panel). (D) Total levels of GluA1 protein normalized to GAPDH loading control following 48 h treatment with TTX or picrotoxin (PTX). (E) Left: western blots from a biotin surface-protein labeling experiment from cultures treated for 48 h with TTX or PTX. Surface proteins were labeled with biotin and immunoprecipitated (“IP”). “Input” panel shows equivalent GAPDH in total cell lysates from each condition. Right: quantification of surface levels of glutamate receptor subunits following 48 h treatment with TTX or PTX (n = 6 samples). *Indicates significant difference (p < 0.05) from baseline. (F) Time courses of Arc mRNA levels following treatment with 50 μM picrotoxin (blue line) or 1 μM TTX (gray line) for the indicated times in hours. (G) Top: representative western blots of Arc protein levels following treatment with TTX (left) or picrotoxin (PTX, right). Arc values were normalized to GAPDH loading control for each sample. Bottom: average Arc protein levels for neurons treated with picrotoxin (blue) or TTX (gray). All data are represented as mean ± SEM. Dotted lines at 100% indicate baseline levels.
Figure 3
Figure 3
The activity-dependent induction of Arc requires ERK1/2-dependent transcription. (A–C) Bar graphs displaying western blot data of Arc protein normalized to GAPDH loading control. Hippocampal cultures were treated for 2 h with 50 μM picrotoxin (PTX) and pre-incubated for 30 min with either 4 μM MPEP (A), 10 μM NASPM (B), 5 μM nimodipine (Nimod) and/or 10 μM CPP (C). (D) Top: representative western blots of phosphorylated ERK1/2 (p-ERK1/2, Thr202/Tyr204) normalized to total ERK1/2 protein following treatment with TTX (left) or picrotoxin (PTX, right) for the indicated times in hours. Bottom: average p-ERK1/2 levels in neurons treated with picrotoxin (blue) or TTX (gray) for the indicated times. Dotted lines at 100% indicate baseline levels. (E) Western blot data of p-ERK1/2 normalized to total ERK1/2 following 2 hour treatment with nimodipine, CPP, and/or picrotoxin as indicated. (F,H) Western blot data of Arc protein normalized to GAPDH following six hour treatment with picrotoxin with and without 5 μM U0126 (F) or 8 μM actinomycin D (ActD, H). (G) Spike frequency expressed as a percentage of baseline determined by multi-electrode array recordings of pairs of cultures treated with DMSO or 20 μM U0126 for 24 h. (I) Quantitative RT-PCR data of Arc mRNA levels following six hour treatment with picrotoxin with and without 5μM U0126. All data are from 2–3 independent experiments and are represented as mean ± SEM. *Indicates significant difference (p < 0.05) from control baseline level. # Indicates significant difference (p < 0.05) from picrotoxin treated.
Figure 4
Figure 4
The ERK1/2-Arc negative feedback pathway is tonically active in Tsc1 KO neurons and is independent of mTOR. (A) Schematic depicting the ERK1/2-Arc negative feedback pathway regulating hippocampal network activity. (B) Bar graphs show western blot data of Tsc1 and Tsc2 protein levels normalized to GAPDH or β-Actin loading control on DIV 14 from control (black) and Tsc1 KO (red) cultures. (C,D) Western blot data of p-ERK1/2 normalized to total ERK1/2 (C) and Arc protein normalized to β-Actin loading control (D) in control and Tsc1 KO cultures following six hour treatment with 50 nM rapamycin (Rapa) or 5 μM U0126. (E) Western blot data of Arc protein normalized to β-Actin loading control in control and Tsc1 KO cultures treated for six hours with 8 μM actinomycin D (ActD). (F,G) Western blot data of p-ERK1/2 (F) and Arc (G) in control and Tsc1 KO neurons with and without 1 μM TTX (six hours) or 10 μM CPP plus 5 μM Nimodipine (C/N, two hours). All data are from 2–3 independent experiments and are represented as mean ± SEM. *Indicates significant difference (p < 0.05) from control. #Indicates significant difference (p < 0.05) from untreated Tsc1 KO.
Figure 5
Figure 5
ERK1/2 blockade does not impact basal or activity-regulated phosphorylation of the mTOR pathway target S6. (A) Western blot data of average phosphorylated S6 (p-S6, Ser240/244) levels normalized to total S6 in control neurons treated with picrotoxin (PTX, blue) or TTX (gray) for the indicated times. Dotted lines at 100% indicate baseline levels. (B) Western blot data of phosphorylated S6 in control (black) and Tsc1 KO neurons (red) following six hour treatment with 50 nM rapamycin (Rapa) or 5 μM U0126. (C) Western blot data of phosphorylated S6 in control neurons following six hour treatment with 50 μM picrotoxin (PTX), with or without 50 nM rapamycin or 5 μM U0126. All data are from 2–3 independent experiments and are represented as mean ± SEM. *Indicates significant difference (p < 0.05) from untreated control. #Indicates significant difference (p < 0.05) from untreated Tsc1 KO. &Indicates significant difference (p < 0.05) from picrotoxin treated control. n.s. indicates no significant difference between groups.

References

    1. Antion M. D., Hou L., Wong H., Hoeffer C. A., Klann E. (2008). mGluR-dependent long-term depression is associated with increased phosphorylation of S6 and synthesis of elongation factor 1A but remains expressed in S6K-deficient mice. Mol. Cell. Biol. 28, 2996–3007 10.1128/MCB.00201-08 - DOI - PMC - PubMed
    1. Banko J. L., Hou L., Poulin F., Sonenberg N., Klann E. (2006). Regulation of eukaryotic initiation factor 4E by converging signaling pathways during metabotropic glutamate receptor-dependent long-term depression. J. Neurosci. 26, 2167–2173 10.1523/JNEUROSCI.5196-05.2006 - DOI - PMC - PubMed
    1. Bateup H. S., Johnson C. A., Denefrio C. L., Saulnier J. L., Kornacker K., Sabatini B. L. (2013). Excitatory/inhibitory synaptic imbalance leads to hippocampal hyperexcitability in mouse models of tuberous sclerosis. Neuron 78, 510–522 10.1016/j.neuron.2013.03.017 - DOI - PMC - PubMed
    1. Bateup H. S., Takasaki K. T., Saulnier J. L., Denefrio C. L., Sabatini B. L. (2011). Loss of Tsc1 in vivo impairs hippocampal mGluR-LTD and increases excitatory synaptic function. J. Neurosci. 31, 8862–8869 10.1523/JNEUROSCI.1617-11.2011 - DOI - PMC - PubMed
    1. Beique J. C., Na Y., Kuhl D., Worley P. F., Huganir R. L. (2011). Arc-dependent synapse-specific homeostatic plasticity. Proc. Natl. Acad. Sci. U.S.A. 108, 816–821 10.1073/pnas.1017914108 - DOI - PMC - PubMed