. 2013 Sep 20:7:148.
doi: 10.3389/fncir.2013.00148. eCollection 2013.

The basal forebrain modulates spontaneous activity of principal cells in the main olfactory bulb of anesthetized mice

Affiliations

The basal forebrain modulates spontaneous activity of principal cells in the main olfactory bulb of anesthetized mice

Xiping Zhan et al. Front Neural Circuits. .

Abstract

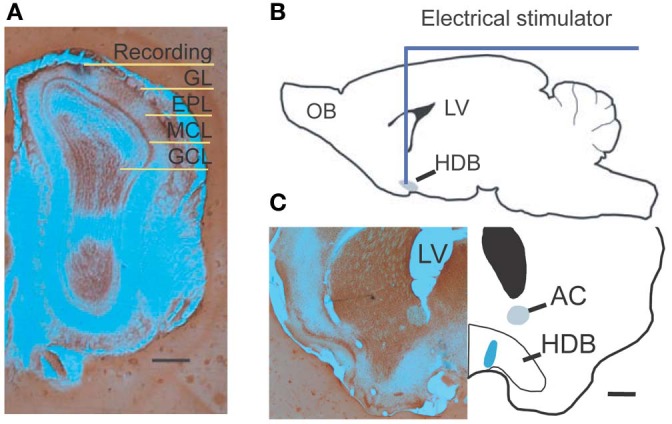
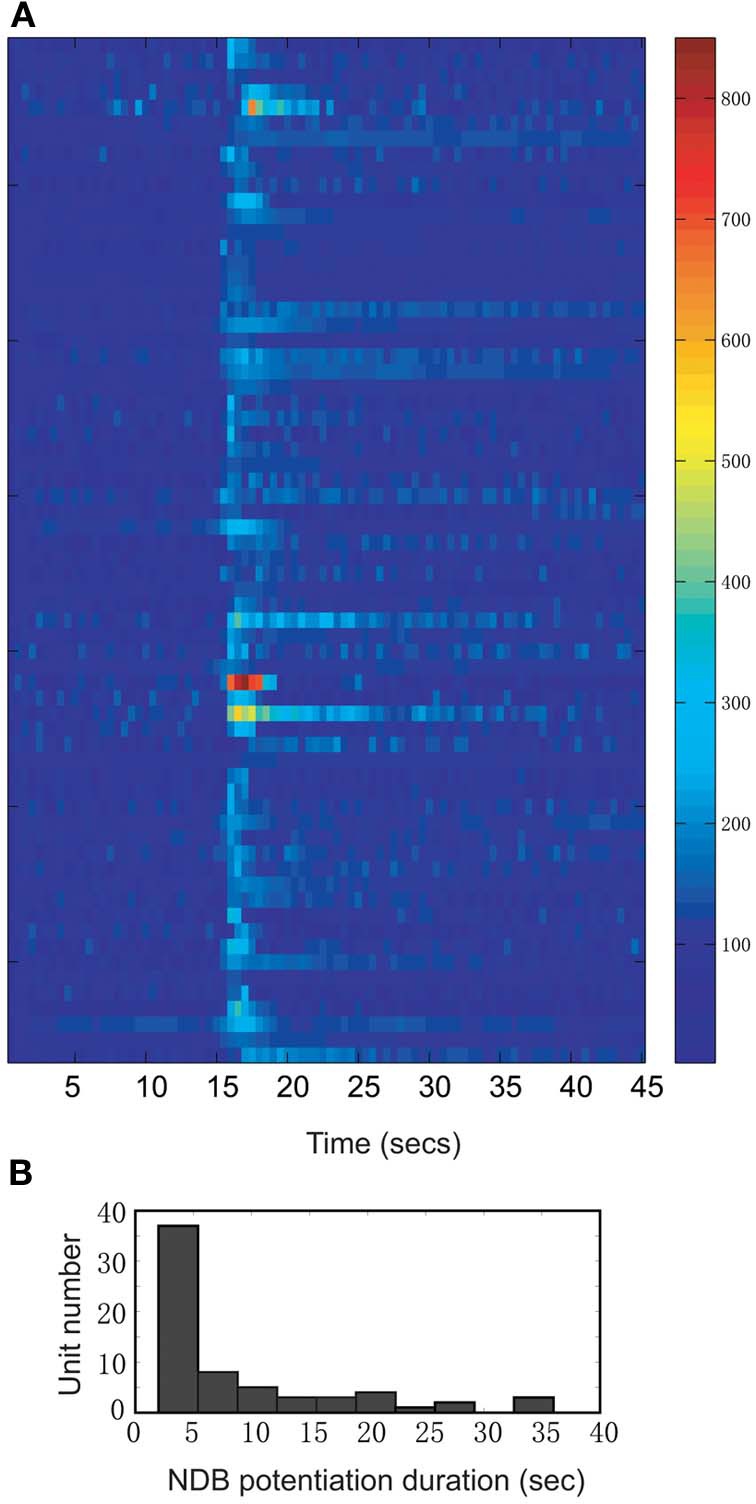
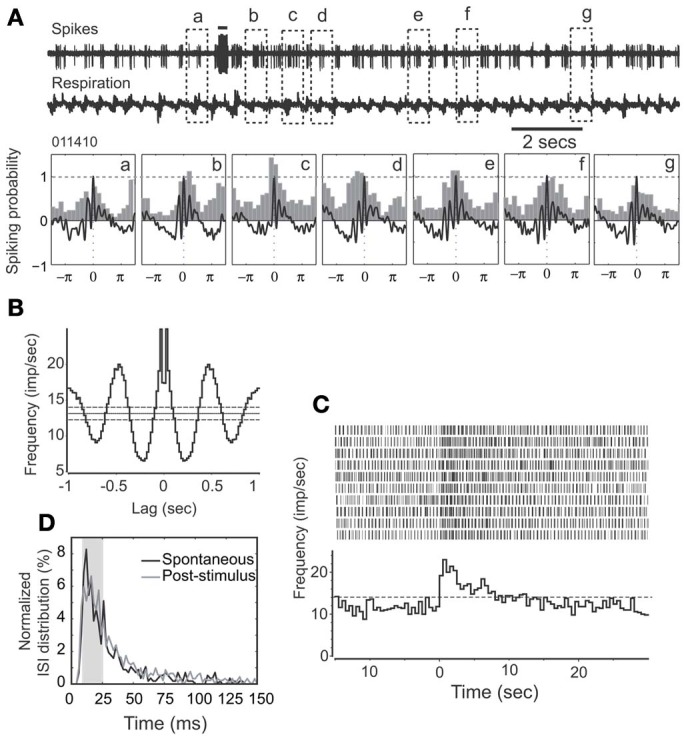
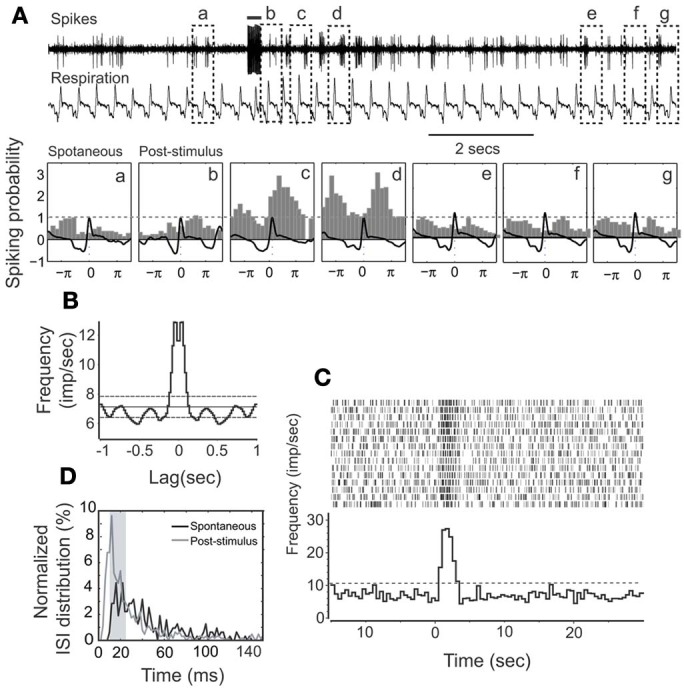
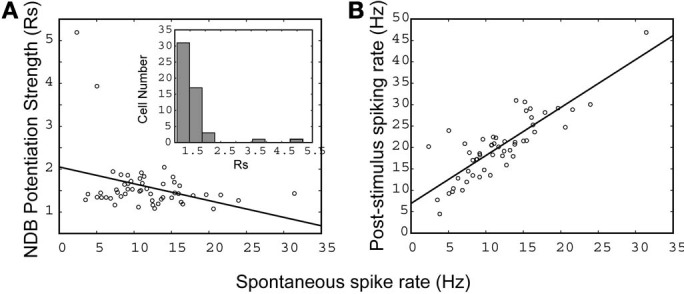
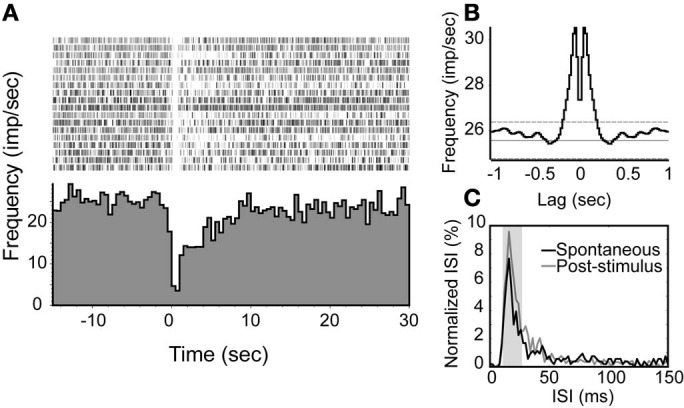
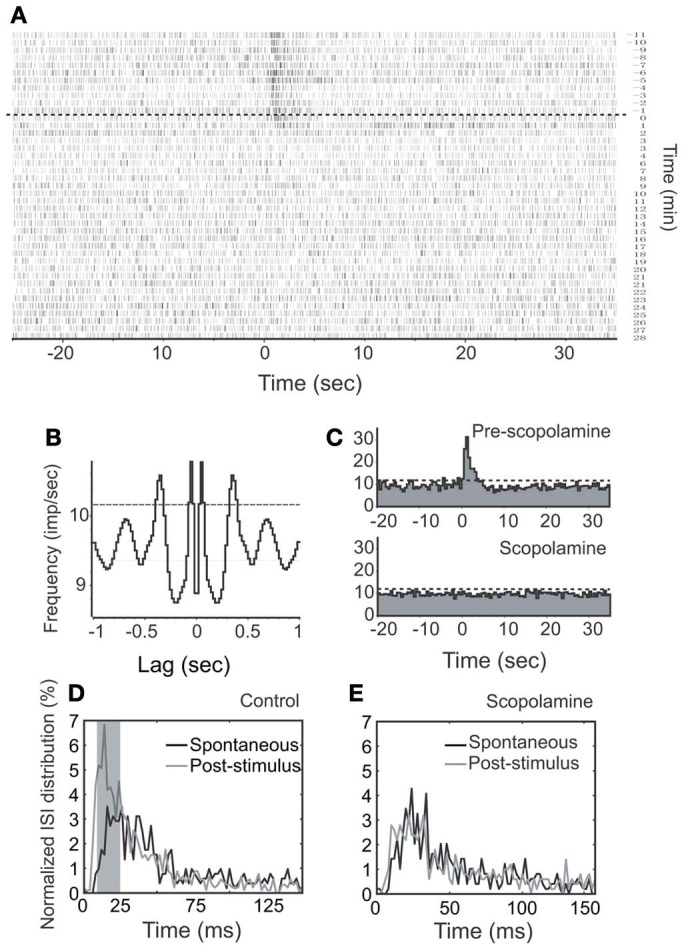
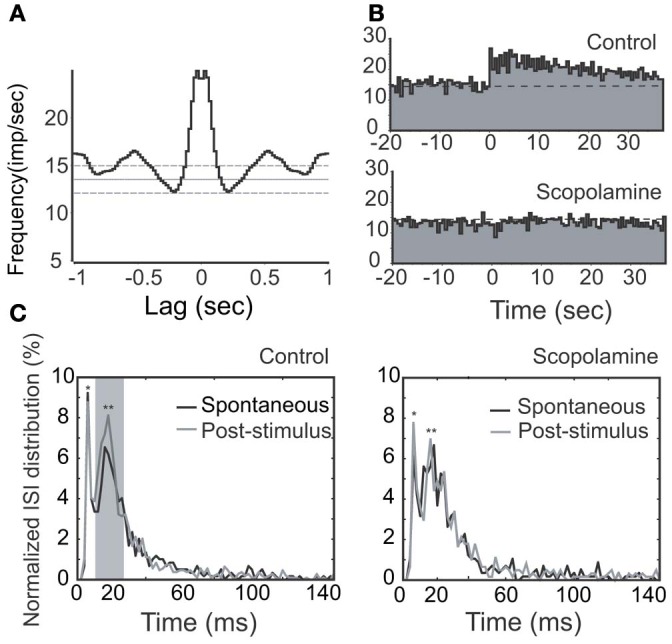
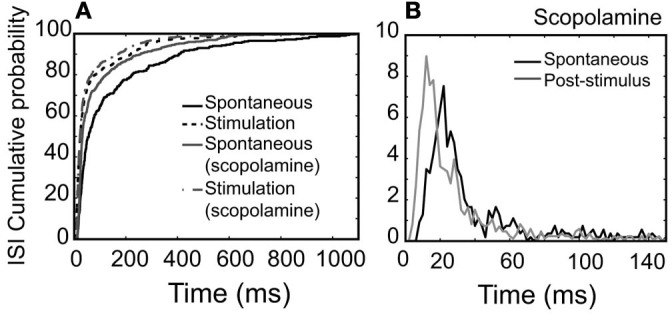
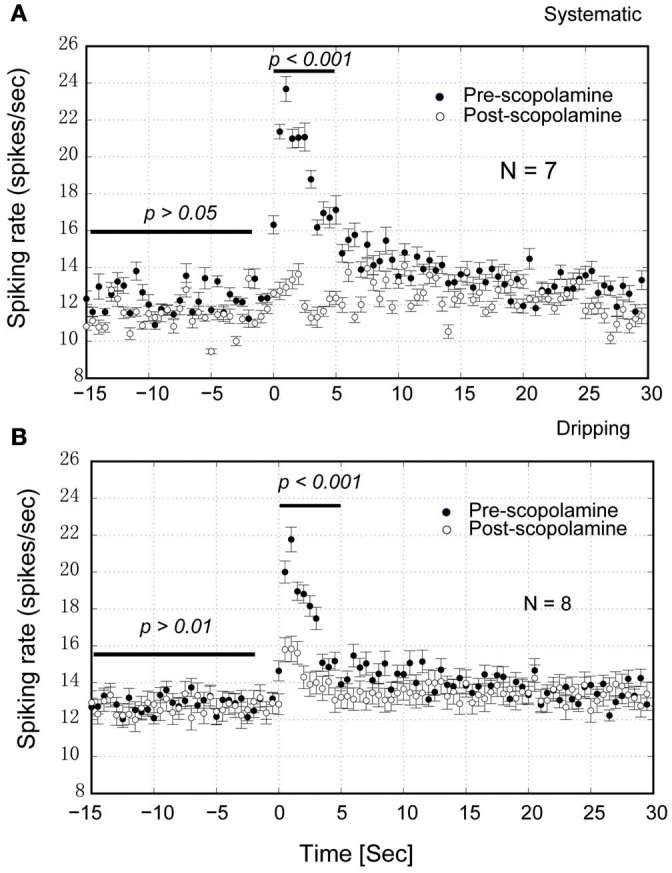
Spontaneous activity is an important characteristic of the principal cells in the main olfactory bulb (MOB) for encoding odor information, which is modulated by the basal forebrain. Cholinergic activation has been reported to inhibit all major neuron types in the MOB. In this study, the effect of diagonal band (NDB) stimulation on mitral/tufted (M/T) cell spontaneous activity was examined in anesthetized mice. NDB stimulation increased spontaneous activity in 66 MOB neurons which lasted for 2-35 s before returning to the baseline level. The majority of the effected units showed a decrease of interspike intervals (ISI) at a range of 8-25 ms. Fifty-two percent of NDB stimulation responsive units showed intrinsic rhythmical bursting, which was enhanced temporarily by NDB stimulation, whereas the remaining non-rhythmic units were capable of synchronized bursting. The effect was attenuated by scopolamine in 21 of 27 units tested. Only four NDB units were inhibited by NDB stimulation, an inhibition that lasted less than 10 s. The NDB stimulation responsive neurons appeared to be M/T cells. Our findings demonstrate an NDB excitation effect on M/T neurons that mostly requires muscarinic receptor activation, and is likely due to non-selectivity of electrical stimulation. This suggests that cholinergic and a diverse group of non-cholinergic neurons in the basal forebrain co-ordinately modulate the dynamics of M/T cell spontaneous activity, which is fundamental for odor representation and attentional perception.

Keywords: diagonal band; mitral cell; olfactory bulb; scopolamine; synchronization; tufted cell.


Figures

Figure 1
Figure 1
Experimental diagram. (A) Photograph shows a recording location with pontamine sky blue located in the superficial external plexiform layer. (B) A drawing shows the location of NDB stimulation; the HDB is highlighted. (C) An examplar stimulating location shows blue ion deposits from stimulating electrode visualized by potassium ferrocyanide. Scale bar = 250 μm.
Figure 2
Figure 2
A summary of all units showing increased firing rate following electrical stimulation (n = 66; Bin = 0.5 s). (A) The time course records are normalized to the baseline period 12–15 s. The color bar on the right indicates the normalized spike rates (%). (B) Distribution of NDB potentiation shows the range of duration from 2 to 35 s.
Figure 3
Figure 3
HDB stimulation does not affect synchronization pattern of a rhythmically spiking unit. (A) Raw traces show spikes and respiration recorded simultaneously. Note that the unit remains synchronized with respiration following HDB stimulation. This unit has a long-lasting discharge activity. Lower panel: The respiration triggered spike histograms are shown before (a) or after stimulation (b–g). Respiration traces are averaged and 0 stands for the transition point between inhalation and exhalation. The top bar: electrical stimulation (100 μs, 400 μA, 100 Hz, 25 pulses). (B) An autocorrelation analysis indicates the unit has a rhythmicity of 3 Hz at a confidence limit of 99% (bin = 20 ms). (C) Histogram and raster plot showing stimulation effects on mean spike rates. Note t = 0 indicates the beginning of NDB stimulation, and this applies to the rest of Figures. (D) Plot showing ISI distributions before or after stimulation, respectively. Note that ISIs following NDB stimulation are decreased (p < 0.001).
Figure 4
Figure 4
HDB stimulation on a non-synchronized, rhythmically spiking unit. (A) Raw traces show the simultaneous recording of spikes and respiration. This unit has a short-lasting discharging activity. The bar on the top shows the electrical stimulation (100 μ s, 500 μ A, 100 Hz, 25 pulses). The respiration triggered spike histograms are shown before (a) or after stimulation (b–g) as described in Figure 3. (B) An autocorrelation analysis indicates the unit rhythmicity (Bin = 20 ms). (C) Histogram and raster plot showing potentiation of spike rates. (D) Plot showing ISI distributions before or after stimulation, respectively. Note that ISIs following NDB stimulation are decreased (p < 0.001).
Figure 5
Figure 5
The relationship between spontaneous activity and NDB potentiation strength (A), and post-stimulus activity (B). A linear fit is applied and the correlation coefficient is indicated separately: (A) r = −0.38, (B) r = 0.89 (n = 57). (A, inset), a histogram shows the distribution of cells with NDB stimulation-induced response strength (Rs).
Figure 6
Figure 6
An examplar unit with an inhibition response in which the spiking activity is decreased transiently following NDB stimulation. (A) Peri-stimulus histogram and raster plot show the decreased spiking with an average of spontaneous spike rate at 26 spikes/s. (B) Autocorrelation of spontaneous spikes. Bin = 20 ms. (C) The ISIs of this unit are elevated at 10–25 ms.
Figure 7
Figure 7
Effects of stimulation and scopolamine on a respiration-synchronized rhythmic unit. (A) A time course spiking recording shows the effects of NDB stimulation (100 μ s, 400 μ A, 100 Hz, 25 pulses) and scopolamine (IP, 5 mg/kg). Note this unit does not show recovery during the course of recording. The dashed line indicates the start time of scopolamine. (B) An autocorrelation analysis reveals the unit rhythmicity at 3 Hz (Bin = 20 ms). (C) Histogram of NDB-induced spike rates before and after scopolamine. (D,E) ISI distributions show effects before or after scopolamine treatments, respectively.
Figure 8
Figure 8
Effects of stimulation (100 μs, 500 μA, 100 Hz, 25 pulses) and scopolamine on a rhythmic unit with long-lasting NDB potentiation. (A) Autocorrelation of spontaneous spikes; Bin = 20 ms. (B) Histogram of NDB-induced spike rates before and after scopolamine administration (IP, 7.5 mg/kg). (C) ISI distributions are shown before (left) or after (right) scopolamine treatment, respectively. Note that this unit has a typical ISI range of 12–25 ms (**). It also has a faster characteristic spiking with an ISI range of 3–12 ms (*). Note that ISIs following NDB stimulation are decreased (p < 0.005), which is not changed significantly with scopolamine (p > 0.5).
Figure 9
Figure 9
NDB potentiation is not affected by scopolamine in a non-synchronized, rhythmically spiking unit (Figure 4). For this unit, scopolamine was dripped at 600 μM. (A) Cumulative probability of ISI distributions in spontaneous or post-stimulus activity and the effect of scopolamine. (B) Plots showing ISI distributions after scopolamine treatments. Note that ISIs following NDB stimulation are decreased significantly (p < 0.001), which is not affected by scopolamine (p < 0.001).
Figure 10
Figure 10
Group statistics of the neurons show that scopolamine attenuates the NDB potentiation in the MOB. (A) IP injection of scopolamine blocked the NDB potentiation completely (p < 0.001) but not the spontaneous activity (p > 0.05). (B) Dripping scopolamine on the top of MOB attenuated the NDB potentiation significantly (p < 0.001) without effect on the spontaneous activity (p > 0.01). Horizontal bar indicates the paired samples used for statistics.

Similar articles

Cited by

References

    1. Angelo K., Margrie T. W. (2011). Population diversity and function of hyperpolarization-activated current in olfactory bulb mitral cells. Sci. Rep. 1:50 10.1038/srep00050 - DOI - PMC - PubMed
    1. Bathellier B., Buhl D. L., Accolla R., Carleton A. (2008). Dynamic ensemble odor coding in the mammalian olfactory bulb: sensory information at different timescales. Neuron 57, 586–598 10.1016/j.neuron.2008.02.011 - DOI - PubMed
    1. Buonviso N., Amat C., Litaudon P. (2006). Respiratory modulation of olfactory neurons in the rodent brain. Chem. Senses 31, 145–154 10.1093/chemse/bjj010 - DOI - PubMed
    1. Buonviso N., Chaput M. A., Berthommier F. (1992). Temporal pattern analyses in pairs of neighboring mitral cells. J. Neurophysiol. 68, 417–424 - PubMed
    1. Carey R. M., Wachowiak M. (2011). Effect of sniffing on the temporal structure of mitral/tufted cell output from the olfactory bulb. J. Neurosci. 31, 10615–10626 10.1523/JNEUROSCI.1805-11.2011 - DOI - PMC - PubMed

Publication types

LinkOut - more resources