. 2013 Sep 16;8(9):e73193.
doi: 10.1371/journal.pone.0073193. eCollection 2013.

Iron deposition following chronic myocardial infarction as a substrate for cardiac electrical anomalies: initial findings in a canine model

Affiliations

Iron deposition following chronic myocardial infarction as a substrate for cardiac electrical anomalies: initial findings in a canine model

Ivan Cokic et al. PLoS One. .

Abstract

Purpose: Iron deposition has been shown to occur following myocardial infarction (MI). We investigated whether such focal iron deposition within chronic MI lead to electrical anomalies.

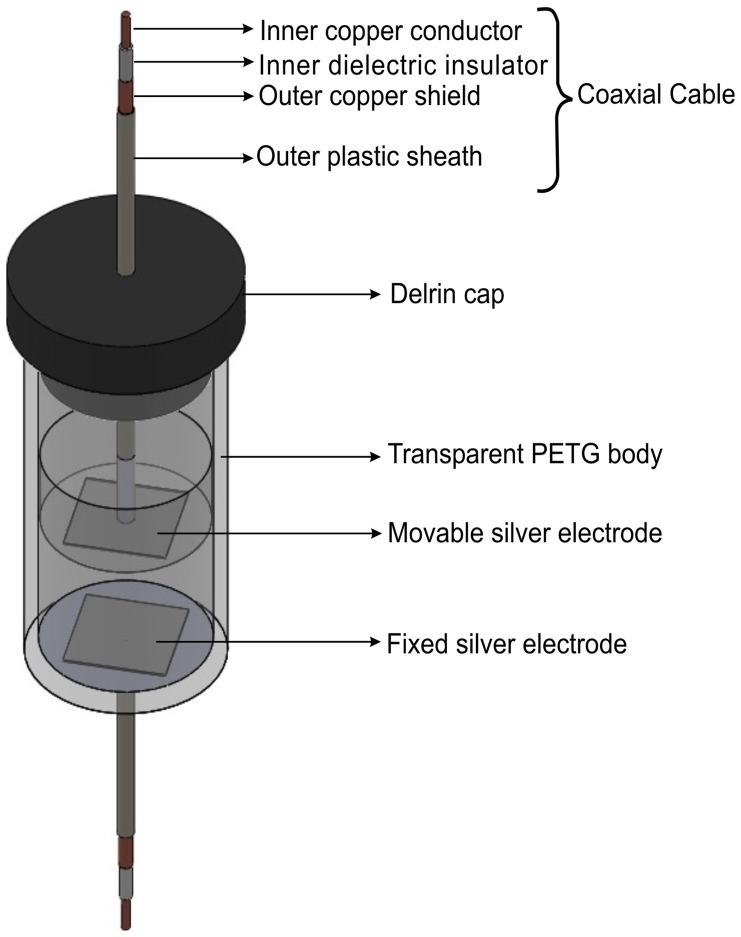
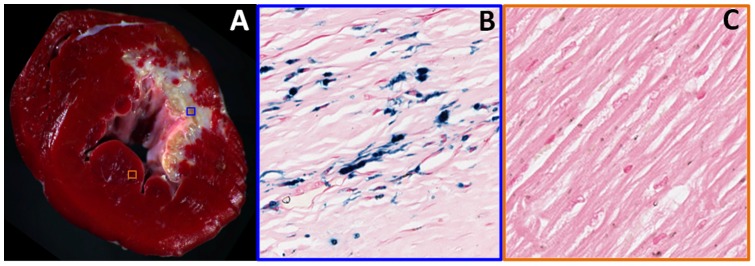
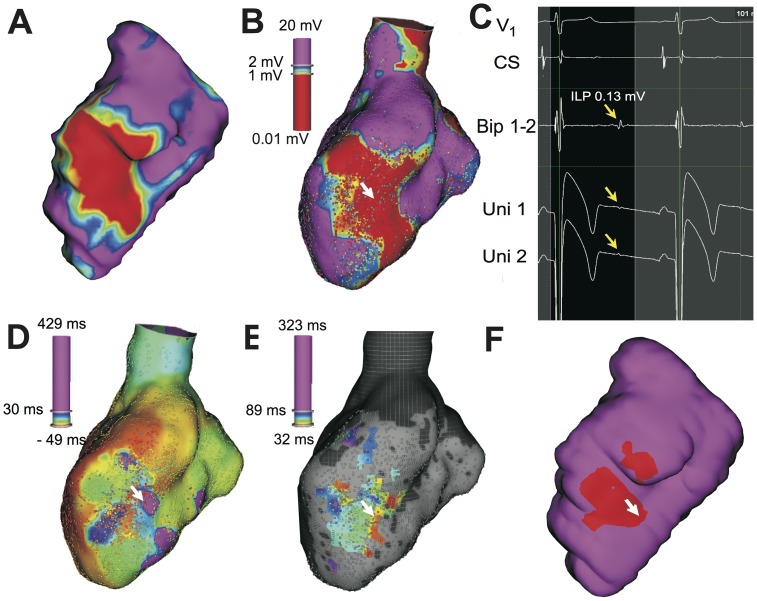
Methods: Two groups of dogs (ex-vivo (n = 12) and in-vivo (n = 10)) were studied at 16 weeks post MI. Hearts of animals from ex-vivo group were explanted and sectioned into infarcted and non-infarcted segments. Impedance spectroscopy was used to derive electrical permittivity ([Formula: see text]) and conductivity ([Formula: see text]). Mass spectrometry was used to classify and characterize tissue sections with (IRON+) and without (IRON-) iron. Animals from in-vivo group underwent cardiac magnetic resonance imaging (CMR) for estimation of scar volume (late-gadolinium enhancement, LGE) and iron deposition (T2*) relative to left-ventricular volume. 24-hour electrocardiogram recordings were obtained and used to examine Heart Rate (HR), QT interval (QT), QT corrected for HR (QTc) and QTc dispersion (QTcd). In a fraction of these animals (n = 5), ultra-high resolution electroanatomical mapping (EAM) was performed, co-registered with LGE and T2* CMR and were used to characterize the spatial locations of isolated late potentials (ILPs).

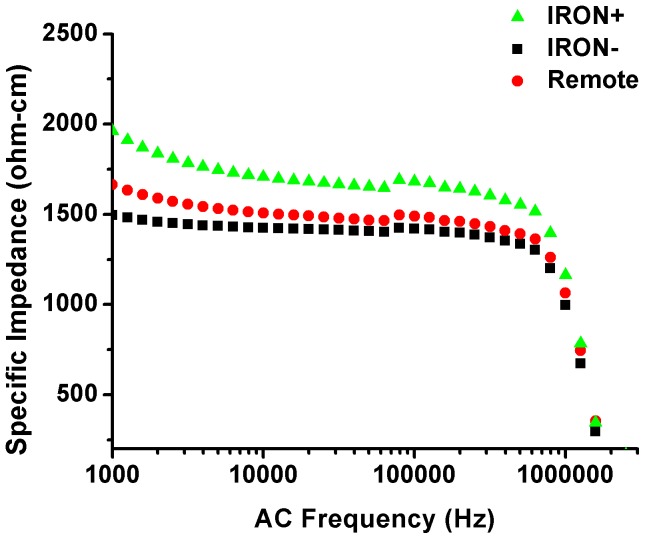
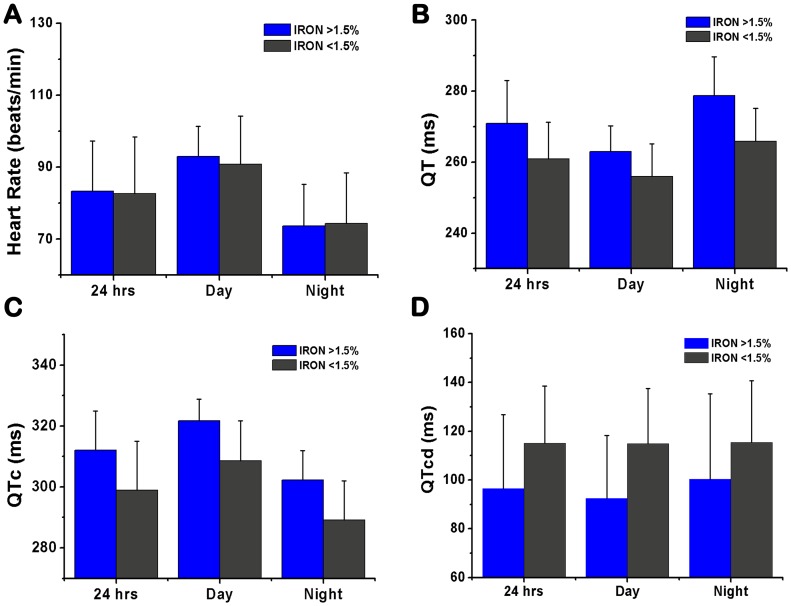
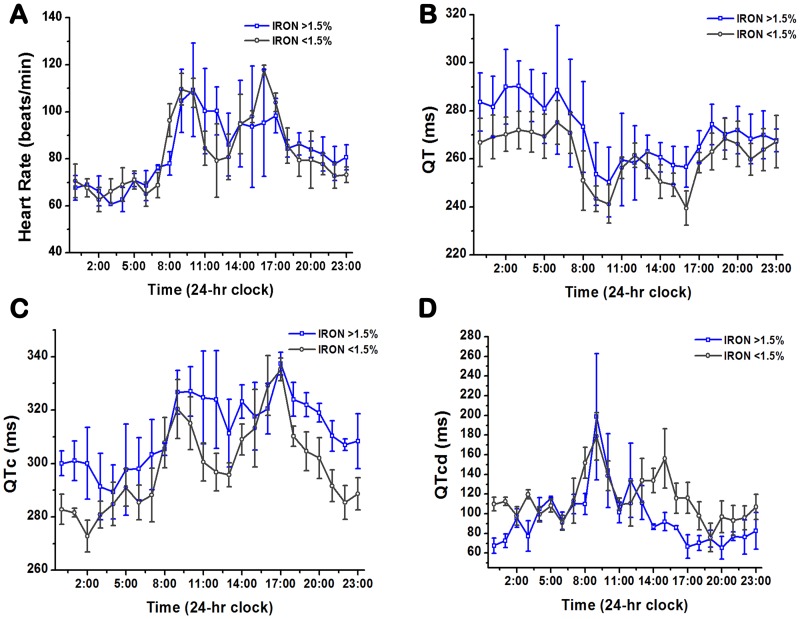
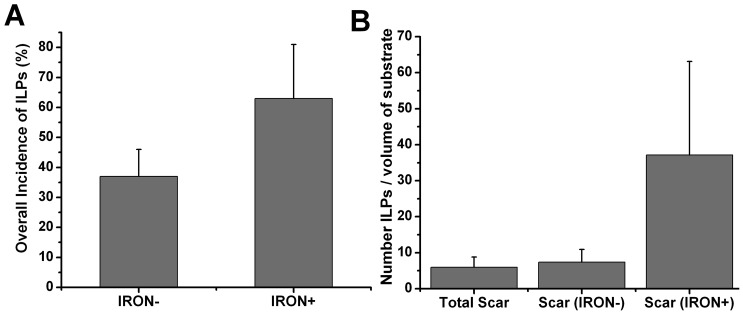
Results: Compared to IRON- sections, IRON+ sections had higher[Formula: see text], but no difference in[Formula: see text]. A linear relationship was found between iron content and [Formula: see text] (p<0.001), but not [Formula: see text] (p = 0.34). Among two groups of animals (Iron (<1.5%) and Iron (>1.5%)) with similar scar volumes (7.28% ± 1.02% (Iron (<1.5%)) vs 8.35% ± 2.98% (Iron (>1.5%)), p = 0.51) but markedly different iron volumes (1.12% ± 0.64% (Iron (<1.5%)) vs 2.47% ± 0.64% (Iron (>1.5%)), p = 0.02), QT and QTc were elevated and QTcd was decreased in the group with the higher iron volume during the day, night and 24-hour period (p<0.05). EAMs co-registered with CMR images showed a greater tendency for ILPs to emerge from scar regions with iron versus without iron.

Conclusion: The electrical behavior of infarcted hearts with iron appears to be different from those without iron. Iron within infarcted zones may evolve as an arrhythmogenic substrate in the post MI period.


Conflict of interest statement

Competing Interests: The authors would like to declare that Brian Stewart, Nathan Bennett and Doron Harlev are employees of Rhythmia Medical-Boston Scientific, Inc. and Dr. Warren M. Jackman is a consultant for Rhythmia Medical-Boston Scientific, Inc. The authors would like to declare that Cedars-Sinai Medical Center has filled a PCT application (PCT/US2012/042310) partly relating to the work presented in the manuscript. The authors have no other competing interests to declare. The authors would like to confirm that this does not alter the authors' adherence to all the PLOS ONE policies on sharing data and materials.

Figures

Figure 1
Figure 1. Schematic three-dimensional drawing of a custom-made capacitor cell used for measuring bulk electrical impedance of ex-vivo tissue.
The capacitor cell consisted of a transparent tubular glycol-modified polyethylene teraphthalate (PETG) body that is closed at one end and fitted with a removable Delrin cap at the other end. Two square silver electrodes, each of 1.5 cm2 surface area, were enclosed in the tubular body. One electrode was affixed to the closed end, while the other electrode was affixed to a PETG disk that can move through the tubular body. The electrodes were soldered to the inner conductors of copper coaxial cables, which in turn were connected to the impedance analyzer. The outer conductors were connected to electrical ground.
Figure 2
Figure 2. Representative specific impedance spectra from Remote, IRON-, and IRON+ myocardial samples.
Note that for a given AC frequency, the specific impedance of IRON+ samples is higher than that of the Remote and IRON− samples.
Figure 3
Figure 3. Electrical consequences of iron deposition in ex-vivo myocardium.
(A) Mean formula image 
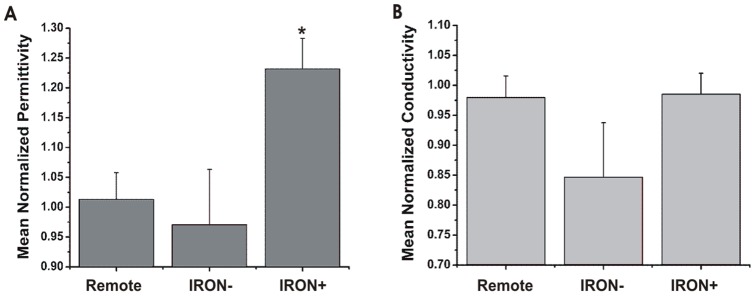
measured from Remote, IRON−, and IRON+ infarct sections showed significantly greater formula image (*, p<0.001) in IRON+ compared to Remote and IRON− sections; (B) however, mean formula image measured from Remote, IRON−, and IRON+ infarct sections did not show any statistical difference in formula image between the different sections.
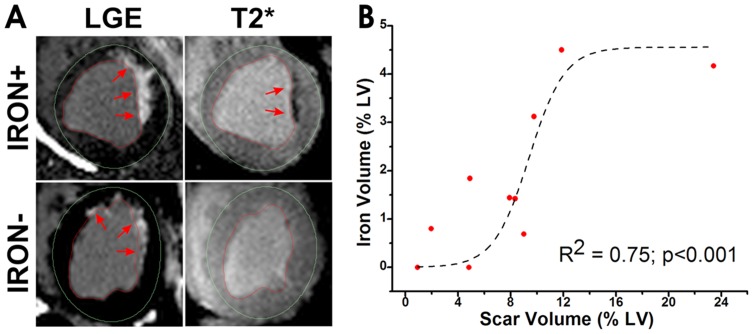
Figure 4
Figure 4. Relation between scar features and chronic iron deposition.
(A) Representative short-axis LGE and T2*-weighted (TE  = 6.5 ms) images from two canines subjected to MI from Group in vivo – one with chronic iron deposition within the scar territory (Iron (>1.5%)) and another without chronic iron deposition (Iron (<1.5%)) are shown. Red arrows point to the site of myocardial scar on the LGE images in both the cases and to chronic iron deposition on the T2*-weighted image. (B) A significant sigmoidal relation was found between scar volume and iron volume (both computed as a percentage of total LV myocardium; R2 = 0.75, p <0.001).
Figure 5
Figure 5. Histological Findings.
The presence of infarction apparent on TTC staining (A) and iron (B, blue Perl's stains; black arrows) within chronic MI and its absence (C, Perl's stain) in remote sections are shown. Note that the iron deposits are typically found in the interstitial/extracellular space. The blue and red boxes within the TTC images correspond to the histology sections from infarcted and remote (non-infarcted) regions.
Figure 6
Figure 6. Mean values of important surface ECG parameters over day, night and a 24-hour period from Iron (>1.5%) and Iron (<1.5%) dogs.
The mean values from dogs with and without iron over the period of interest for heart rate (A), QT (B), QTc (C) and QTcd (D) are shown.
Figure 7
Figure 7. 24-hour Holter ECG recordings from Iron (>1.5%) and Iron (<1.5%) dogs.
The mean 24-hour traces showing changes in heart rate (A), QT (B), QT corrected for heart rate (C), and QTc dispersion (D) are shown for the two different groups of dogs with and without iron deposition.
Figure 8
Figure 8. Representative co-registered CMR images and endocardial EAMs showing the association between ILPs and iron deposition following myocardial infarction.
Co-registered late-gadolinium enhancement images projected onto the segmented blood pool surface (A) with infarcted territory (color coded in red), border zone (yellow and blue shades) and remote territories (purple)) with the corresponding bipolar map (B, color-coded to indicate low voltage areas) are shown. For reference, an ILP deep within the scar tissue (white arrow) is shown. The voltage traces from V1 and at the coronary sinus (CS), along with bipolar and unipolar mapping traces are also shown. Note the presence of an isolated low-voltage sharp late potential in the bipolar and unipolar traces following the local ventricular activation (yellow arrow) in C. The activation map (D), a map of the ILPs (E), and iron containing regions (in red, F) are also shown for reference. Note that iron-containing regions have a greater incidence of ILPs and slow activation regions.
Figure 9
Figure 9. Dependence on the probability of observing ILPs based on substrate type and number of ILPS relative to substrate burden visualized on the basis of co-registered EAM and CMR images (LGE and T2*).
(A) Shows the overall incidence of ILPs (fraction of the total) that were coincident with regions containing iron (IRON+) and regions without iron (IRON−). (B) Shows the mean number of ILPs per volume of substrate, with the substrate being the total scar (i.e., scar with and without iron), scarred regions with iron (IRON+) and scarred regions without iron (IRON−).

References

    1. Issa ZF, Miller JM, Zipes DP (2012) Clinical arrhythmology and electrophysiology: a companion to Braunwald's heart disease. Philadelphia, Pa; London: Saunders.
    1. Shenasa M (2013) Cardiac mapping. ChichesterWest Sussex; HobokenNJ: Wiley-Blackwell. xx, 945 p.
    1. de Bakker JM, van Capelle FJ, Janse MJ, Wilde AA, Coronel R, et al. (1988) Reentry as a cause of ventricular tachycardia in patients with chronic ischemic heart disease: electrophysiologic and anatomic correlation. Circulation 77: 589–606. - PubMed
    1. de Bakker JM, Coronel R, Tasseron S, Wilde AA, Opthof T, et al. (1990) Ventricular tachycardia in the infarcted, Langendorff-perfused human heart: role of the arrangement of surviving cardiac fibers. J Am Coll Cardiol 15: 1594–1607. - PubMed
    1. Cinca J, Bardaji A, Carreno A, Mont L, Bosch R, et al. (1995) ST segment elevation at the surface of a healed transmural myocardial infarction in pigs. Conditions for passive transmission from the ischemic peri-infarction zone. Circulation 91: 1552–1559. - PubMed

Publication types