. 2013 Sep 16;8(9):e73937.
doi: 10.1371/journal.pone.0073937. eCollection 2013.

In silico modeling of Itk activation kinetics in thymocytes suggests competing positive and negative IP4 mediated feedbacks increase robustness

Affiliations

In silico modeling of Itk activation kinetics in thymocytes suggests competing positive and negative IP4 mediated feedbacks increase robustness

Sayak Mukherjee et al. PLoS One. .

Erratum in

  • PLoS One. 2014;9(1): 10.1371/annotation/285bb79f-ef1a-467e-9fd3-4e518d65acd3

Abstract

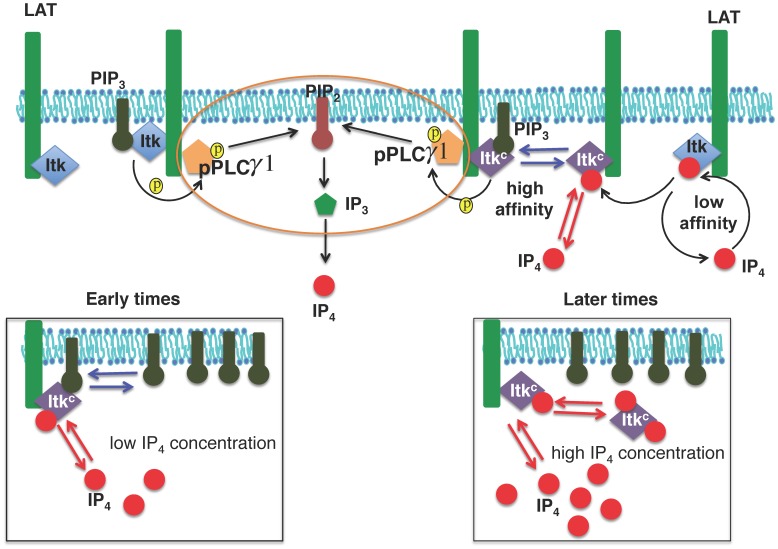
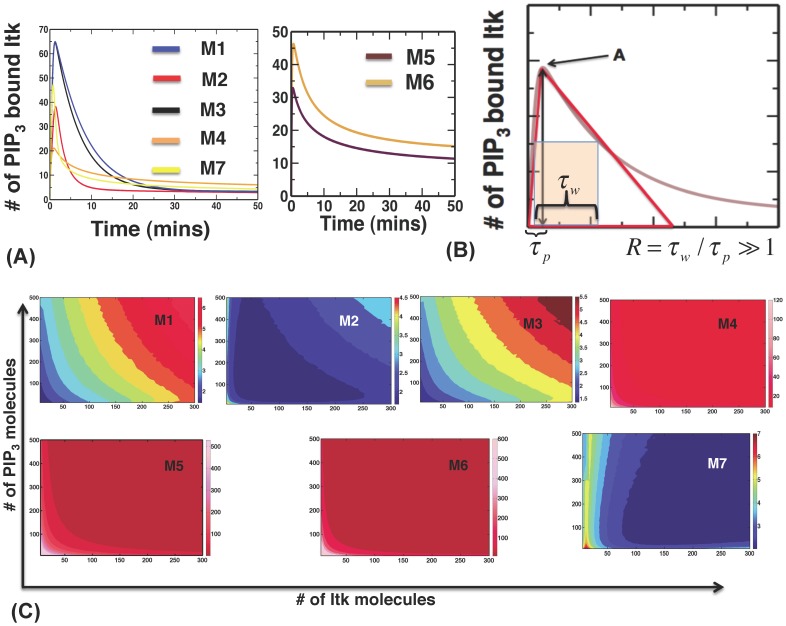
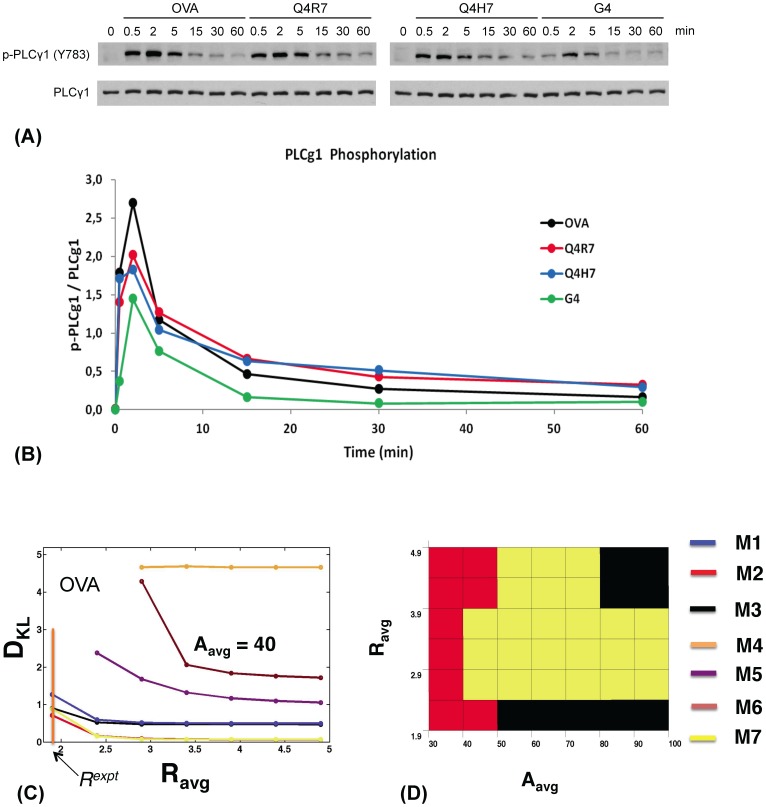
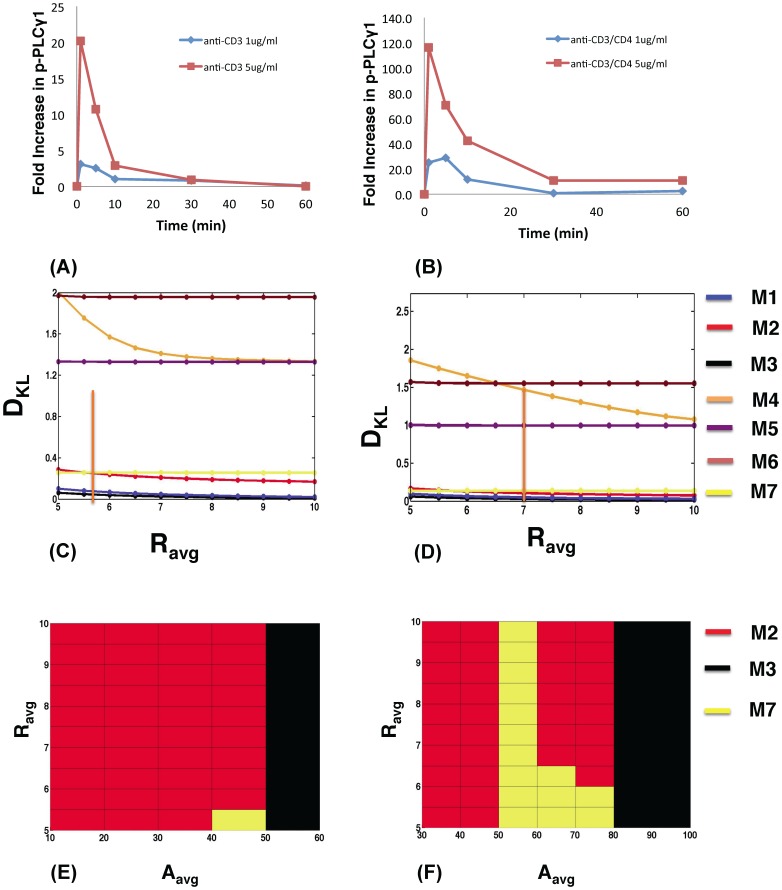
The inositol-phosphate messenger inositol(1,3,4,5)tetrakisphosphate (IP4) is essential for thymocyte positive selection by regulating plasma-membrane association of the protein tyrosine kinase Itk downstream of the T cell receptor (TCR). IP4 can act as a soluble analog of the phosphoinositide 3-kinase (PI3K) membrane lipid product phosphatidylinositol(3,4,5)trisphosphate (PIP3). PIP3 recruits signaling proteins such as Itk to cellular membranes by binding to PH and other domains. In thymocytes, low-dose IP4 binding to the Itk PH domain surprisingly promoted and high-dose IP4 inhibited PIP3 binding of Itk PH domains. However, the mechanisms that underlie the regulation of membrane recruitment of Itk by IP4 and PIP3 remain unclear. The distinct Itk PH domain ability to oligomerize is consistent with a cooperative-allosteric mode of IP4 action. However, other possibilities cannot be ruled out due to difficulties in quantitatively measuring the interactions between Itk, IP4 and PIP3, and in generating non-oligomerizing Itk PH domain mutants. This has hindered a full mechanistic understanding of how IP4 controls Itk function. By combining experimentally measured kinetics of PLCγ1 phosphorylation by Itk with in silico modeling of multiple Itk signaling circuits and a maximum entropy (MaxEnt) based computational approach, we show that those in silico models which are most robust against variations of protein and lipid expression levels and kinetic rates at the single cell level share a cooperative-allosteric mode of Itk regulation by IP4 involving oligomeric Itk PH domains at the plasma membrane. This identifies MaxEnt as an excellent tool for quantifying robustness for complex TCR signaling circuits and provides testable predictions to further elucidate a controversial mechanism of PIP3 signaling.


Conflict of interest statement

Competing Interests: The authors have declared that no competing interests exist.

Figures

Figure 1
Figure 1. Relevant basic interactions between Itk, PIP3 and IP4.
Following TCR-pMHC binding, Itk molecules are bound by the LAT signalosome via SLP-76 (not shown). Itk molecules (monomers or dimers, blue diamonds), bind the membrane lipid PIP3 with low affinity through their PH domains. PIP3 bound Itk phosphorylates and thereby activates LAT-bound PLCγ1. Activated PLCγ1 then hydrolyzes the membrane lipid PIP2 into the soluble second messenger IP3, a key mediator of Ca2+ mobilization. IP3 3-kinase B (ItpkB) converts IP3 into IP4 (red filled circle). For our in silico models, we simplified this series of reactions, encircled by the orange oval, into a single second order reaction where PIP3 bound Itk converts PIP2 into IP4. In models M1–M4 and M7, IP4 modifies the Itk PH domain (denoted as ItkC, purple diamonds) to promote PIP3 and IP4 binding to the Itk PH domain. At the onset of the signaling, when the concentration of IP4 is smaller than that of PIP3, IP4 helps ItkC to bind to PIP3 (left lower panel). However, as the concentration of IP4 is increased at later times, IP4 outcompetes PIP3 for binding to ItkC and sequesters ItkC to the cytosol (right lower panel). In models M5/M6, IP4 and PIP3 do not augment each other’s binding to Itk. However, IP4 still outcompetes PIP3 for Itk PH domain binding when the number of IP4 molecules becomes much larger than that of PIP3 molecules at later times.
Figure 2
Figure 2. Different molecular interactions in models M1–M7 produce different temporal profiles of PIP3 binding to Itk.
(A) Kinetics of PIP3 association of Itk for fixed initial PIP3 and Itk concentrations (100 and 370 molecules, respectively) in models with feedbacks (M1–M4, and M7, left panel) and no feedbacks (M5–M6, right panel). (B) The shapes of the temporal profiles can be characterized by the parameters peak time (τ p), peak width (τ w), and peak value or amplitude (A). The dimensionless asymmetry ratio R = τ w/τ p quantifies how symmetric the shape of the time profile is. A larger R value indicates larger asymmetry. (C) Variations in R in models M1–M7 for different initial concentrations of Itk and PIP3. Color scales for R values are shown on the right of each panel.
Figure 3
Figure 3. Experimentally measured PLCγ1activation kinetics in DP thymocytes stimulated with TCR ligands of different affinities and robustness of in silico models.
(A) Immunoblots showing Y783-phosphorylated (upper panels) and total (lower panels) PLCγ1 protein amounts in RAG2−/−MHC−/− OT1 TCR-transgenic DP thymocytes stimulated for the indicated times with MHCI tetramers presenting the indicated altered peptide ligands (APL). (B) Phospho-PLCγ1 levels normalized to total PLCγ1 protein amounts plotted over time for the indicated APLs. Their TCR affinity decreases in the order OVA (black)>Q4R7 (red)>Q4H7 (blue)>G4 (green). Band intensities were quantified via scanning and analysis with ImageJ software. Representative of several independent experiments. (C) Variation of the Kulback-Leibler distance DKL with R for models M1–M3 (blue, red and black, respectively), M7 (yellow), and M4–M6 (orange, purple, and maroon, respectively) at high initial Itk (Itk0 = 140 molecules) and PIP3 concentrations (PIP3 0 = 530 molecules), representing high-affinity OVA stimulation for τ p = 2 min and A (shown as A avg) = 40 molecules. Note we use A to represent the amplitude A expt in experiments measuring fold change in Itk phosphorylation (see the main text for further details). The vertical orange bar indicates Rexpt for OVA. Color legend in (D). (D) The color map shows which model is most robust (has the lowest DKL) as Rexpt and A (shown as A avg) are varied for the same parameters as in (C). The color legend is depicted on the right.
Figure 4
Figure 4. Models containing Itk dimers and dueling feedbacks also show higher robustness for polyclonal T cells stimulated by anti-CD3 antibodies.
PLCγ1 phosphorylation kinetics in MHC−/− T cells stimulated by antibodies against (A) CD3 or (B) CD3 and CD4 at 1 µg/ml versus 5 µg/ml. (C) Variation of DKL with R for the in silico models M1–M3 (blue, red and black, respectively), M7 (yellow), and M5–M6 (purple and maroon, respectively) at initial Itk (Itk0 = 100 molecules) and PIP3 concentrations (PIP3 0 = 370 molecules) at τ p = 1 min and A avg = 60 molecules, representing anti-CD3 stimulation at 5 µg/ml. The orange bar indicates Rexpt. Note we use A avg to represent the amplitude Aexpt in experiments measuring fold change in Itk phosphorylation (see the main text for further details). (D) Variation of DKL with R for anti-CD3/CD4 stimulation at 5 µg/ml at τ p = 1 min and A avg = 80 molecules. The initial Itk (Itk0 = 140 molecules) and PIP3 concentrations (PIP3 0 = 530 molecules) were used. The orange bar indicates Rexpt. (E) and (F) show maps of the most robust models (with the lowest DKL) as Rexpt and A (shown as A avg) are varied for the same parameters as in (C) and (D), respectively.

Similar articles

Cited by

References

    1. Irvine RF, Schell MJ (2001) Back in the water: the return of the inositol phosphates. Nature reviews Molecular cell biology 2: 327–338. - PubMed
    1. Huang YH, Grasis JA, Miller AT, Xu R, Soonthornvacharin S, et al. (2007) Positive regulation of Itk PH domain function by soluble IP4. Science 316: 886–889. - PubMed
    1. Sauer K, Cooke MP (2010) Regulation of immune cell development through soluble inositol-1,3,4,5-tetrakisphosphate. Nature reviews Immunology 10: 257–271. - PMC - PubMed
    1. Schell MJ (2010) Inositol trisphosphate 3-kinases: focus on immune and neuronal signaling. Cell Mol Life Sci 67: 1755–1778. - PMC - PubMed
    1. York JD (2006) Regulation of nuclear processes by inositol polyphosphates. Biochim Biophys Acta 1761: 552–559. - PubMed

Publication types

Substances

LinkOut - more resources