

Expression signature as a biomarker for prenatal diagnosis of trisomy 21
- PMID: 24066117
- PMCID: PMC3774664
- DOI: 10.1371/journal.pone.0074184
Expression signature as a biomarker for prenatal diagnosis of trisomy 21
Abstract
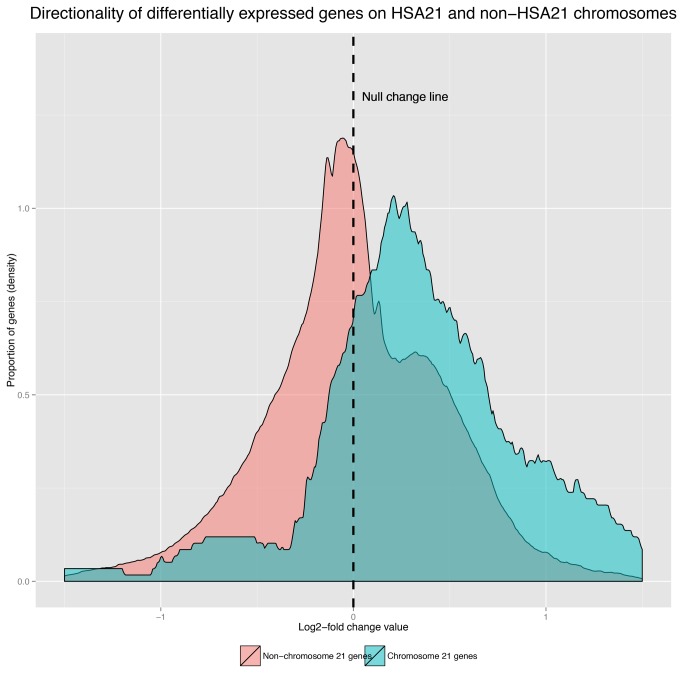
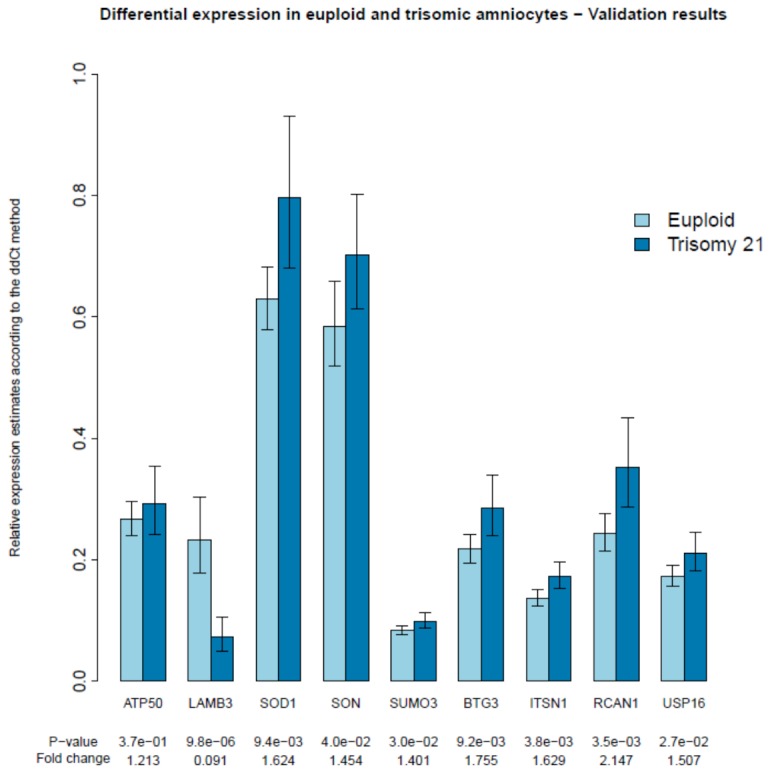
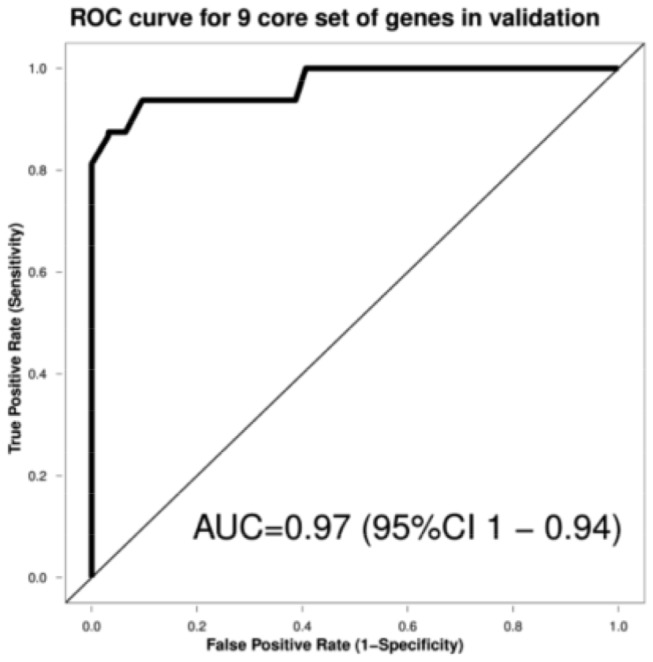
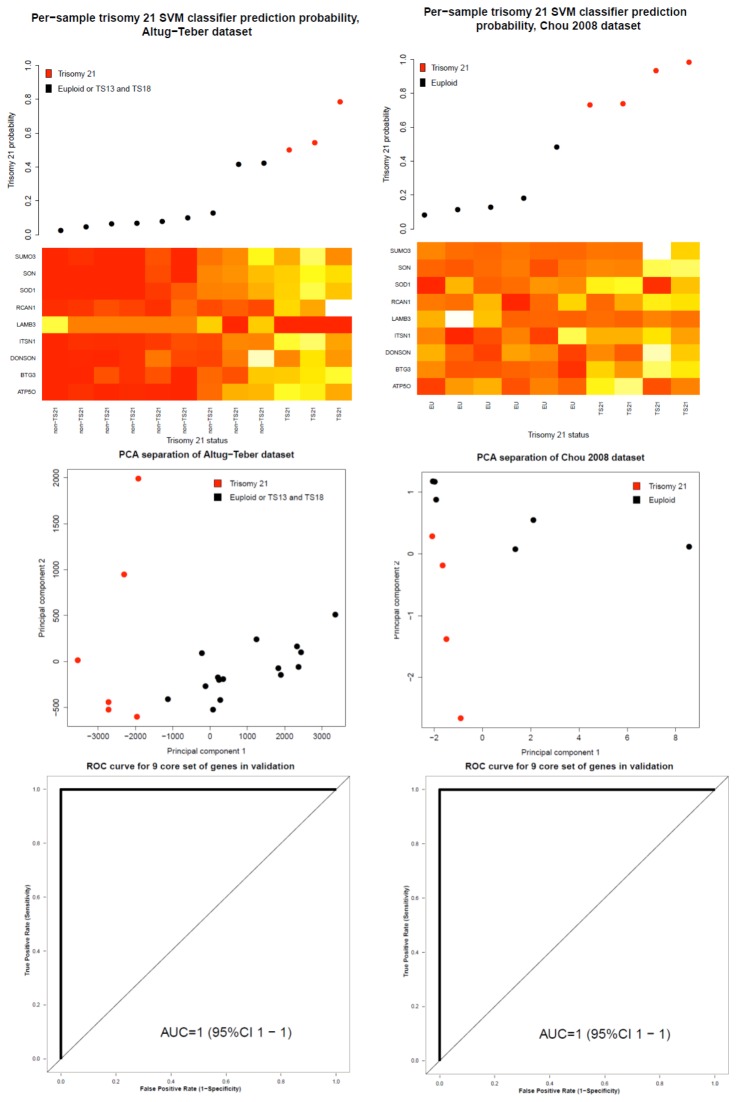
A universal biomarker panel with the potential to predict high-risk pregnancies or adverse pregnancy outcome does not exist. Transcriptome analysis is a powerful tool to capture differentially expressed genes (DEG), which can be used as biomarker-diagnostic-predictive tool for various conditions in prenatal setting. In search of biomarker set for predicting high-risk pregnancies, we performed global expression profiling to find DEG in Ts21. Subsequently, we performed targeted validation and diagnostic performance evaluation on a larger group of case and control samples. Initially, transcriptomic profiles of 10 cultivated amniocyte samples with Ts21 and 9 with normal euploid constitution were determined using expression microarrays. Datasets from Ts21 transcriptomic studies from GEO repository were incorporated. DEG were discovered using linear regression modelling and validated using RT-PCR quantification on an independent sample of 16 cases with Ts21 and 32 controls. The classification performance of Ts21 status based on expression profiling was performed using supervised machine learning algorithm and evaluated using a leave-one-out cross validation approach. Global gene expression profiling has revealed significant expression changes between normal and Ts21 samples, which in combination with data from previously performed Ts21 transcriptomic studies, were used to generate a multi-gene biomarker for Ts21, comprising of 9 gene expression profiles. In addition to biomarker's high performance in discriminating samples from global expression profiling, we were also able to show its discriminatory performance on a larger sample set 2, validated using RT-PCR experiment (AUC=0.97), while its performance on data from previously published studies reached discriminatory AUC values of 1.00. Our results show that transcriptomic changes might potentially be used to discriminate trisomy of chromosome 21 in the prenatal setting. As expressional alterations reflect both, causal and reactive cellular mechanisms, transcriptomic changes may thus have future potential in the diagnosis of a wide array of heterogeneous diseases that result from genetic disturbances.
Conflict of interest statement
Figures
References
-
- Shi L, Campbell G, Jones WD, Campagne F, Wen Z et al. (2010) The MicroArray Quality Control (MAQC)-II study of common practices for the development and validation of microarray-based predictive models. Nat Biotechnol 28: 827-838. doi:10.1038/nbt.1665. PubMed: 20676074. - DOI - PMC - PubMed
-
- Sotiriou C, Pusztai L (2009) Gene-expression signatures in breast cancer. N Engl J Med 360: 790-800. doi:10.1056/NEJMra0801289. PubMed: 19228622. - DOI - PubMed
-
- Altug-Teber O, Bonin M, Walter M, Mau-Holzmann UA, Dufke A et al. (2007) Specific transcriptional changes in human fetuses with autosomal trisomies. Cytogenet Genome Res 119: 171-184. doi:10.1159/000112058. PubMed: 18253026. - DOI - PubMed
-
- Mao R, Wang X, Spitznagel EL Jr., Frelin LP, Ting JC et al. (2005) Primary and secondary transcriptional effects in the developing human Down syndrome brain and heart. Genome Biol 6: R107. doi:10.1186/gb-2005-6-4-107. PubMed: 16420667. - DOI - PMC - PubMed
-
- FitzPatrick DR, Ramsay J, McGill NI, Shade M, Carothers AD et al. (2002) Transcriptome analysis of human autosomal trisomy. Hum Mol Genet 11: 3249-3256. doi:10.1093/hmg/11.26.3249. PubMed: 12471051. - DOI - PubMed
Publication types
MeSH terms
Associated data
- Actions
- Actions
LinkOut - more resources
Full Text Sources
Other Literature Sources
Medical
Molecular Biology Databases
Research Materials
