. 2013;15(5):R89.
doi: 10.1186/bcr3485.

Assessing tumor contrast in radiographically dense breast tissue using Diffuse Optical Spectroscopic Imaging (DOSI)

Assessing tumor contrast in radiographically dense breast tissue using Diffuse Optical Spectroscopic Imaging (DOSI)

Anaïs Leproux et al. Breast Cancer Res. 2013.

Abstract

Introduction: Radiographic density adversely affects the performance of X-ray mammography and can be particularly problematic in younger and high-risk women. Because of this limitation, there is significant ongoing effort to develop alternative cancer screening and detection strategies for this population. This pilot study evaluates the potential of Diffuse Optical Spectroscopic Imaging (DOSI) to image known tumors in dense breast tissue.

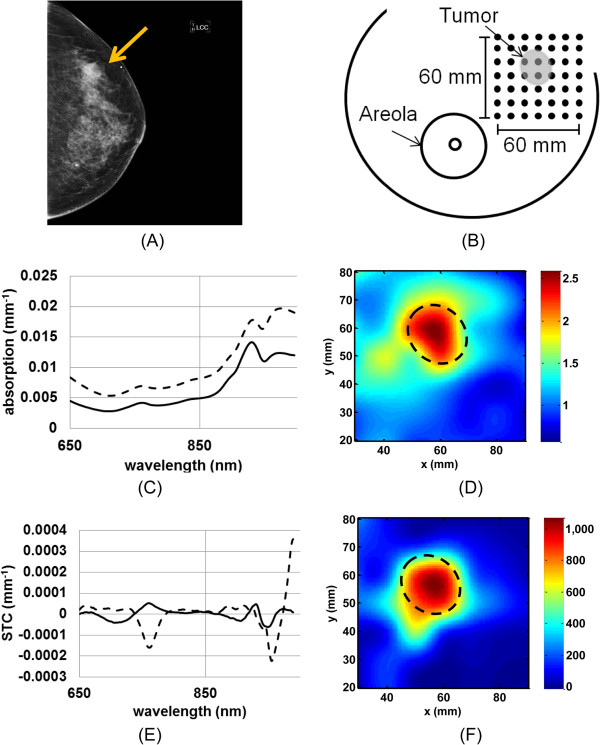
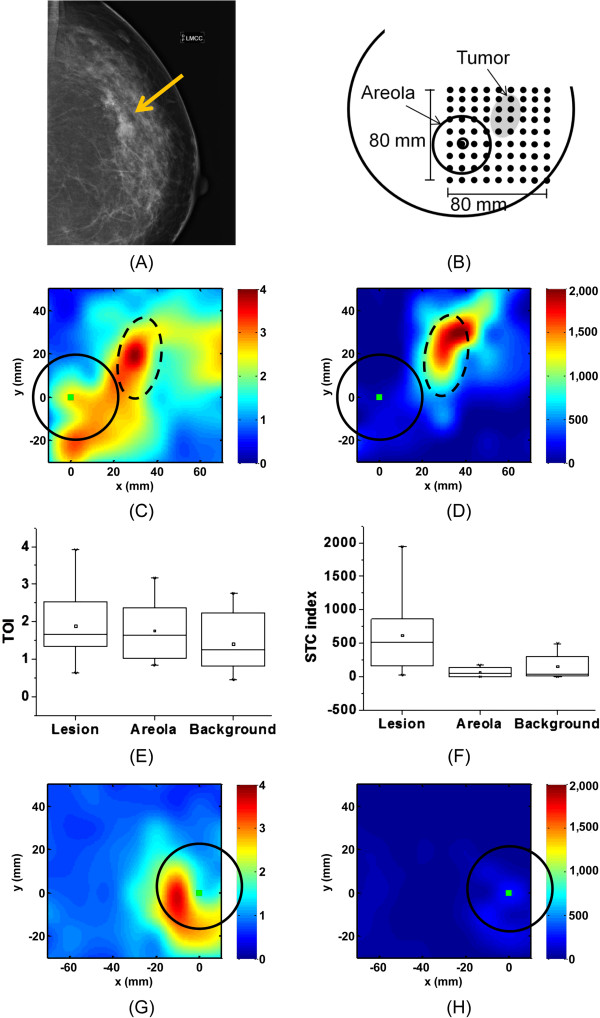
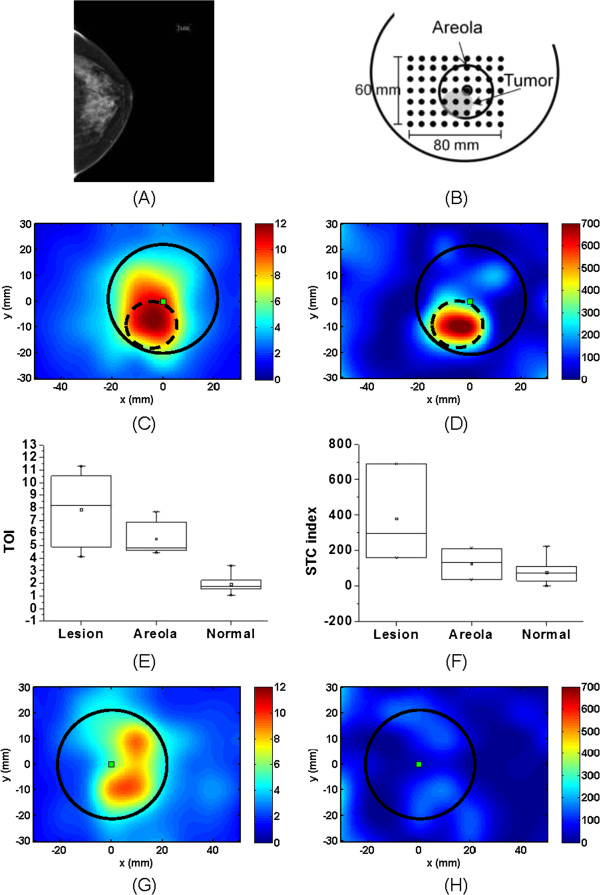
Methods: We performed a retrospective analysis on 24 radiographically dense breast cancer subjects measured with DOSI over a four-year period (Breast Imaging Reporting and Data System - BI-RADS, category 3 and 4, average age = 39 ± 7.6, average maximum size 31 ± 1 7 mm). Two previously-described DOSI contrast functions, the tissue optical index (TOI) and the specific tumor component (STC), which are based upon the concentrations and spectral signatures of hemoglobin, water and lipids, respectively, were used to form 2D optical images of breast tumors.

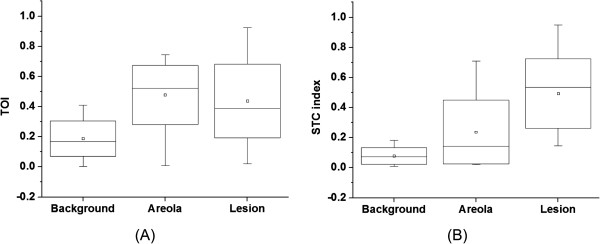
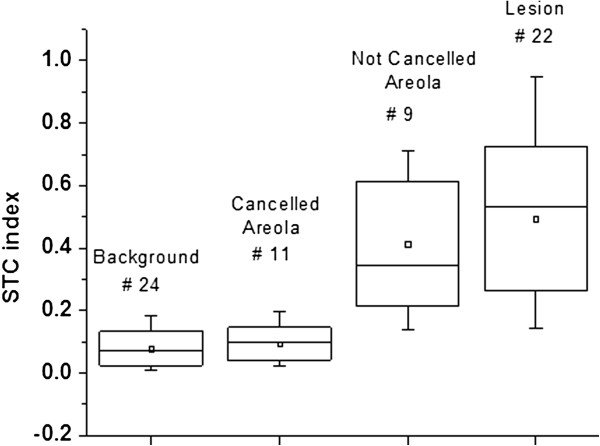
Results: Using TOI and STC, 21 out of 24 breast tumors were found to be statistically different from the surrounding highly vascularized dense tissue and to be distinguishable from the areolar region. For these patients, the tumor to normal contrast was 2.6 ± 1.2 (range 1.3 to 5.5) and 10.0 ± 7.5 (range 3.3 to 26.4) for TOI and STC, respectively. STC images were particularly useful in eliminating metabolic background from the retroareolar region which led to identification of two out of four retroareolar tumors.

Conclusions: Using both the abundance and the disposition of the tissue chromophores recovered from the DOSI measurements, we were able to observe tumor contrast relative to dense breast tissue. These preliminary results suggest that DOSI spectral characterization strategies may provide new information content that could help imaging breast tumors in radiographically dense tissue and in particular in the areolar complex.


Figures

Figure 1
Figure 1
DOSI measurement with typical recovered absorption and STC spectra in tumor and normal tissue. A) Mammogram, left craniocaudal view, of a 39-year-old female subject with a 21 mm IDC in the left breast with a BI-RADS 3 density. The arrow points at the tumor. B) Schematic of the DOSI measurement grid for this subject. DOSI measurement locations are 10 mm apart in x and y directions. For this subject, the 60 x 60 mm2 grid covers the lesion and some normal tissue. C) Absorption spectra in lesion (dotted line), and background (solid line). D) TOI map. E) STC spectra in lesion (dotted line), and background (solid line). F) STC index map. Increased TOI and STC index values are found in the tumor area, highlighted with the dash line circle. BI-RADS, Breast Imaging Reporting and Data System; DOSI, Diffuse Optical Spectroscopic Imaging; IDC, Invasive ductal carcinomas; STC, Specific tumor component; TOI, Tissue optical index.
Figure 2
Figure 2
DOSI results of subject #5, IDC in the left breast, breast density BI-RADS 4. (A) Mammogram, left medio-craniocaudal view. The arrow highlights the tumor location. (B) Schematic representation of the DOSI measurement in the ipsilateral breast. (C) TOI map of the ipsilateral breast. (D) STC index map of the ipsilateral breast. (E) TOI values in tumor, areola and normal tissue of the ipsilateral breast. (F) STC index values in tumor, areola and normal tissue of the ipsilateral breast. (G) TOI map of the contralateral breast. (H) STC index map of the contralateral breast. The square represents the nipple location. The areolas are highlighted with the solid line circle, and the tumor by the dash line circle. BI-RADS, Breast Imaging Reporting and Data System; DOSI, Diffuse Optical Spectroscopic Imaging; STC, Specific tumor component; TOI, Tissue optical index.
Figure 3
Figure 3
DOSI results of subject #17, a 42 y.o. woman with a retroareolar 23 mm IDC. (A) Mammogram, left craniocaudal view. (B) Schematic representation of the DOSI measurement. (C) TOI map of the ipsilateral breast. (D) STC index map of the ipsilateral breast. (E) TOI values in tumor, areola and normal tissue of the ipsilateral breast. (F) STC index values in tumor, areola and normal tissue of the ipsilateral breast. (G) TOI map of the contralateral breast. (H) STC index map of the contralateral breast. The square represents the nipple location. The areolas are highlighted with the solid line circle, and the tumor by the dash line circle. IDC, Invasive ductal carcinomas; STC, Specific tumor component; TOI, Tissue optical index.
Figure 4
Figure 4
Box plot of the TOI and STC index in tumor, areola and normal tissue. (A) TOI values in the visible tumor, areola and normal tissue of the ipsilateral breast. (B) STC index values in the visible tumor, areola and normal tissue of the ipsilateral breast. STC, Specific tumor component; TOI, Tissue optical index.
Figure 5
Figure 5
Box plot of STC index: no contrast in 11 out of 20 areolas. STC index values in the background normal tissue, STC Cancelled Areola, STC Not Cancelled Areola, and visible tumor. The number of patients for each region of interest is shown above each box. STC, Specific tumor component.

References

    1. Hersh MR. Imaging the dense breast. Appl Radiol. 2004;15:22.
    1. Buist DSM, Porter PL, Lehman C, Taplin SH, White E. Factors contributing to mammography failure in women aged 40–49 years. J Natl Cancer Inst. 2004;15:1432–1440. doi: 10.1093/jnci/djh269. - DOI - PubMed
    1. Bevers TB, Anderson BO, Bonaccio E, Buys S, Daly MB, Dempsey PJ, Farrar WB, Fleming I, Garber JE, Harris RE, Helvie M, Hoover S, Krontiras H, Shaw S, Singletary E, Sugg Skinner C, Smith ML, Tsangaris TN, Wiley EL, Williams C. National Comprehensive Cancer Network. Breast cancer screening and diagnosis. J Natl Compr Canc Netw. 2009;15:1060–1096. - PubMed
    1. Berg WA, Blume JD, Cormack JB, Mendelson EB, Lehrer D, Böhm-Vélez M, Pisano ED, Jong RA, Evans WP, Morton MJ, Mahoney MC, Larsen LH, Barr RG, Farria DM, Marques HS, Boparai K. ACRIN 6666 Investigators. Combined screening with ultrasound and mammography vs mammography alone in women at elevated risk of breast cancer. JAMA. 2008;15:2151–2163. doi: 10.1001/jama.299.18.2151. - DOI - PMC - PubMed
    1. Mandelson MT, Oestreicher N, Porter PL, White D, Finder CA, Taplin SH, White E. Breast density as a predictor of mammographic detection: comparison of interval- and screen-detected cancers. J Natl Cancer Inst. 2000;15:1081–1087. doi: 10.1093/jnci/92.13.1081. - DOI - PubMed

Publication types