. 2013 Dec;24(12):993-1006.
doi: 10.1089/hum.2013.153. Epub 2013 Oct 30.

Human cone visual pigment deletions spare sufficient photoreceptors to warrant gene therapy

Affiliations

Human cone visual pigment deletions spare sufficient photoreceptors to warrant gene therapy

Artur V Cideciyan et al. Hum Gene Ther. 2013 Dec.

Abstract

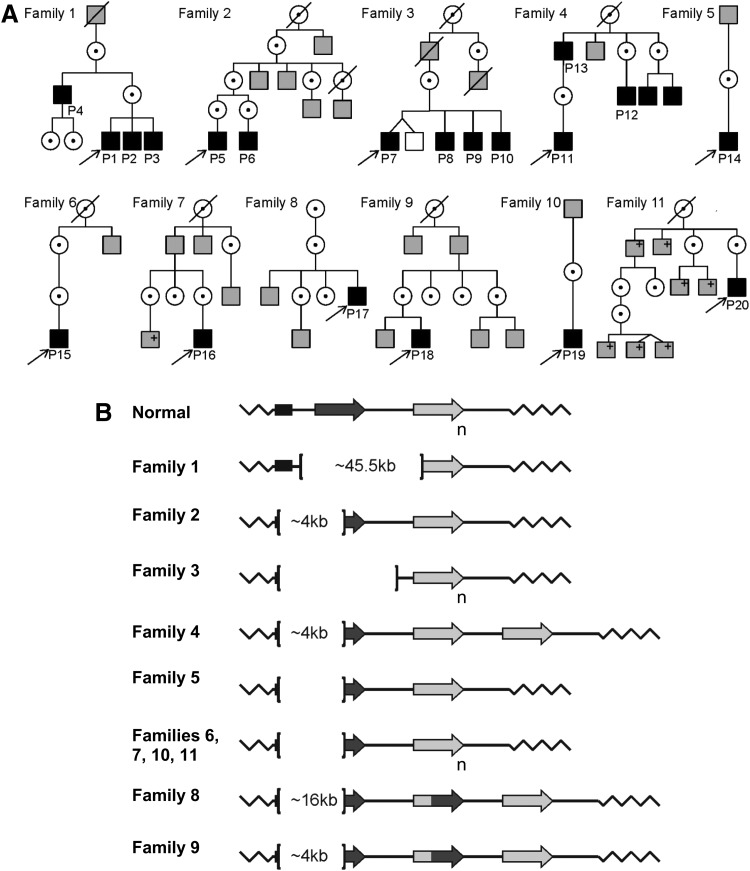
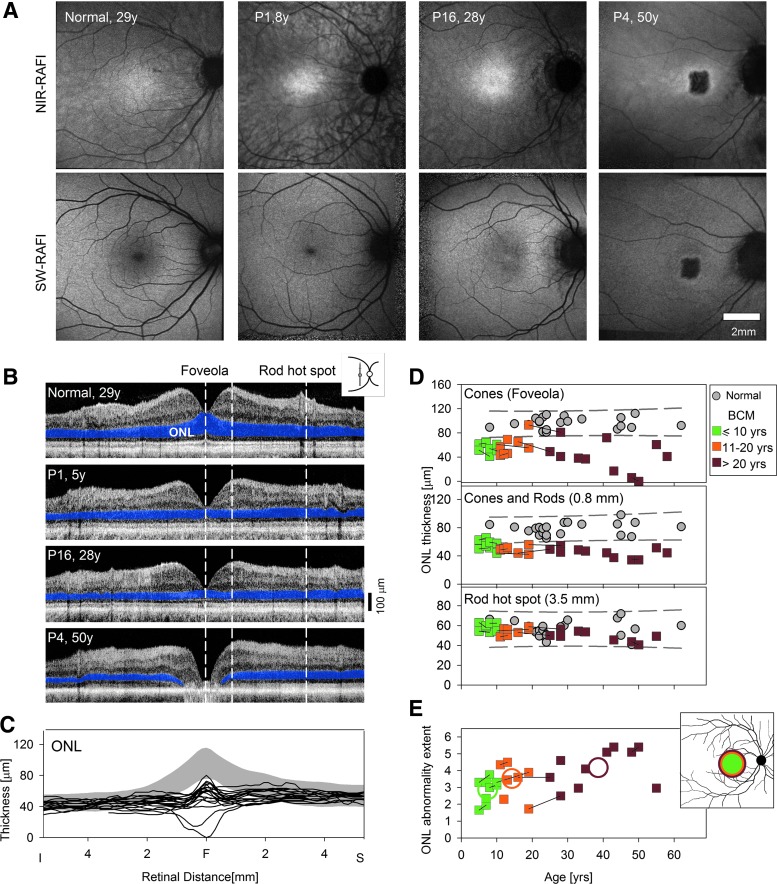
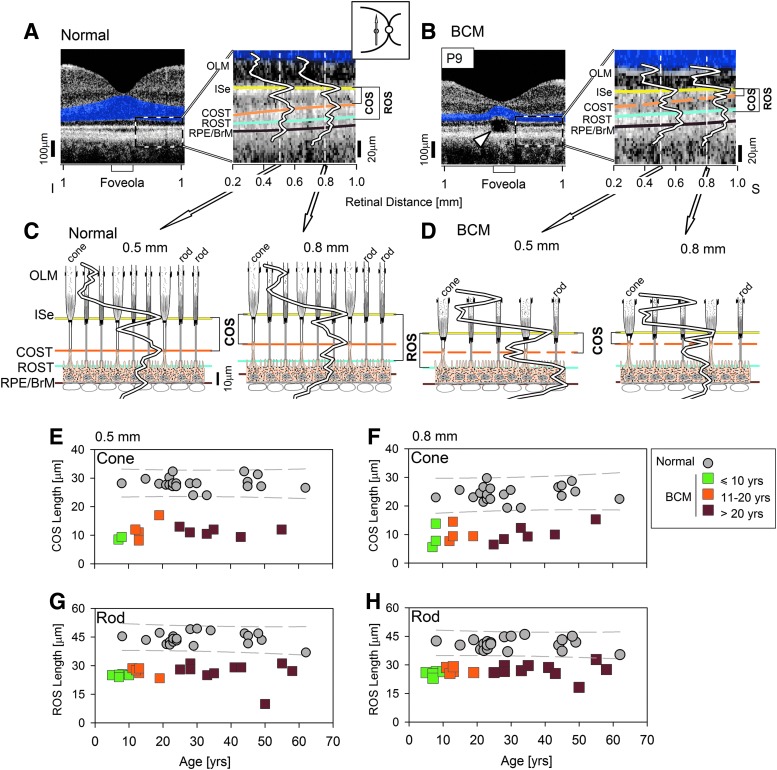
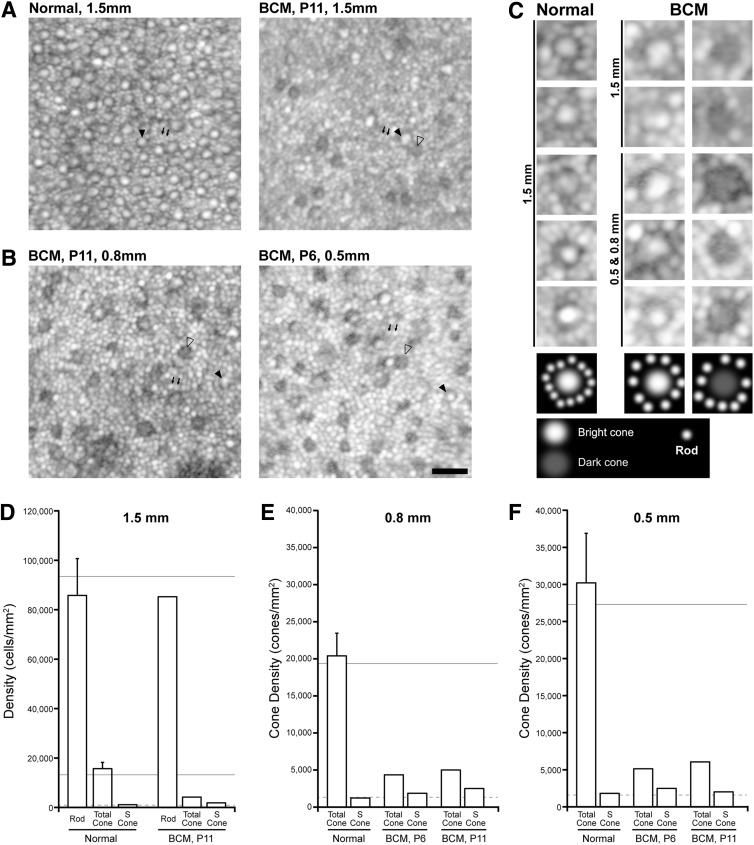
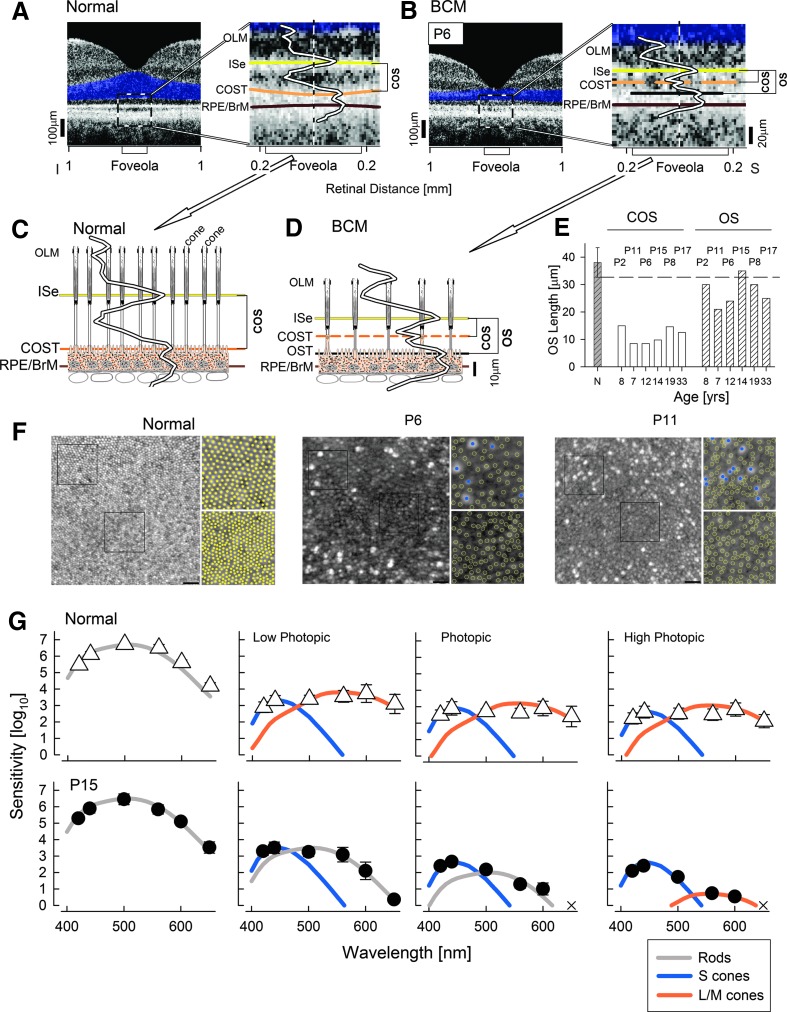
Human X-linked blue-cone monochromacy (BCM), a disabling congenital visual disorder of cone photoreceptors, is a candidate disease for gene augmentation therapy. BCM is caused by either mutations in the red (OPN1LW) and green (OPN1MW) cone photoreceptor opsin gene array or large deletions encompassing portions of the gene array and upstream regulatory sequences that would predict a lack of red or green opsin expression. The fate of opsin-deficient cone cells is unknown. We know that rod opsin null mutant mice show rapid postnatal death of rod photoreceptors. Using in vivo histology with high-resolution retinal imaging, we studied a cohort of 20 BCM patients (age range 5-58) with large deletions in the red/green opsin gene array. Already in the first years of life, retinal structure was not normal: there was partial loss of photoreceptors across the central retina. Remaining cone cells had detectable outer segments that were abnormally shortened. Adaptive optics imaging confirmed the existence of inner segments at a spatial density greater than that expected for the residual blue cones. The evidence indicates that human cones in patients with deletions in the red/green opsin gene array can survive in reduced numbers with limited outer segment material, suggesting potential value of gene therapy for BCM.


Figures

<b>FIG. 1.</b>
FIG. 1.
Pedigrees and genotypes of BCM families. (A) Pedigrees of the 11 families. Black-filled squares, males diagnosed with BCM based on clinical evaluations and molecular testing; gray-filled squares, affected males by history;+, positive for familial BCM mutation; unfilled squares, unaffected males by history; dotted circles, carrier females. (B) Schematic representation of BCM genotypes. In individuals with normal color vision, the X-chromosomal OPN1LW/OPN1MW gene array consists of a proximal long-wavelength-sensitive opsin (OPN1LW) gene (dark-gray arrow), and one or more middle-wavelength-sensitive opsin (OPN1MW) genes (light-gray arrow) arranged in a head-to-tail tandem repeat. Subscript “n” indicates one or more M pigment genes. L/M hybrid genes are shown (dark-/light-gray arrow). Each gene is preceded by a proximal promoter and the expression is controlled by a single LCR upstream of the array (black rectangle). Genetic analyses implied that the OPN1LW/OPN1MW gene clusters in all patients of this study were impaired by large deletions affecting the LCR and varying parts of the opsin gene cluster with the exception of Family 1, which had an intact LCR with a deletion spanning the OPN1LW and OPN1MW genes. Brackets demarcate the deletions; deletion size is indicated inside the brackets where defined. BCM, blue-cone monochromacy; LCR, locus control region.
<b>FIG. 2.</b>
FIG. 2.
Younger BCM patients show normal RPE but abnormal thinning of the photoreceptor nuclear layer. (A) En face imaging of melanin and lipofuscin fluorophores of the RPE using NIR-RAFI and SW-RAFI, respectively, in a normal subject (age 29; myope, −6D) and three BCM patients. The small dark foveal region in the normal and P1 on SW-RAFI is the result of absorption of the excitation light by dense macular pigment; the larger dark region in the central macula of P4 on NIR-RAFI and SW-RAFI represents RPE atrophy. Retinal blood vessels and the optic nerve head also appear darker than the background. All images are shown contrast stretched for visibility of features. (B) Cross-sectional scans along the vertical meridian crossing the fovea in the same four eyes as shown in (A). ONL, where the photoreceptor nuclei reside, is highlighted (blue). Vertical dashed lines delineate the foveola dominated by cone photoreceptors, 0.8 mm superior retina with cone and rod photoreceptors, and the rod hot spot dominated by rod photoreceptors. (C) ONL thickness vertically across the central 10 mm of retina is graphically displayed for a group of normal subjects (gray represents mean±2SD; n=22; age range 8–62 years), and the BCM data (lines). (D) ONL thickness at the foveola (upper), 0.8 mm superior retina (middle), and the rod hot spot (lower) as a function of age in patients (colored symbols: green, age <10; orange, age range 10–20; brown, age >20 years) and normal controls (gray symbols). The 95% prediction interval of linear regression fit to the normal data is shown (gray dashed lines). Symbols connected with lines represent patients with multiple visits. (E) The extent of ONL abnormality along the vertical meridian as a function of age. Individual patient data are displayed as in (D). Average results for the three age groups are shown with colored circles. Inset, schematic of the average extent of ONL abnormality for the three age groups overlaid to scale on a representative retinal view. ONL, outer nuclear layer; RPE, retinal pigment epithelium.
<b>FIG. 3.</b>
FIG. 3.
Abnormal cone and rod photoreceptor outer segments in BCM. (A and B) Left panels: An optical coherence tomography along the vertical meridian in a representative normal (A) and BCM patient P9 (B). Right panels: Enlarged view of the region immediately superior to the foveola. Four of the five hyperscattering bands are painted for visibility: ISe (yellow), COST (orange), ROST (cyan), and RPE/BrM (brown). OLM layer is also labeled. LRPs are shown at 0.5 and 0.8 mm eccentricity. Dashed orange line in the BCM patient represents intermittent visibility of the COST peak. Cavitation in P9 causes structural loss of the ISe and distal layers at the foveola (arrowhead). The lengths of ROS and COS are bracketed. (C and D) LRPs from the two regions (0.5 and 0.8 mm superior) are overlaid onto models of retina showing the region at rod and cone inner and outer segments and the RPE. Axial dimensions are to scale, but lateral dimensions are not. (E–H) COS and ROS lengths at the 0.5 and 0.8 mm superior retina as a function of age in patients. Individual patient symbols and colors as in Fig. 2. Individual normal controls (gray symbols), and the 95% prediction interval of linear regression fit to the normal data (gray dashed lines) are shown. BrM, Bruch's membrane; COS, cone outer segment; COST, COS tips; ISe, ellipsoid region of photoreceptor inner segments; LRP, longitudinal reflectivity profile; OLM, outer limiting membrane; ROS, rod outer segment; ROST, ROS tips; RPE, retinal pigment epithelium.
<b>FIG. 4.</b>
FIG. 4.
Residual cone structure in BCM. (A) The photoreceptor mosaic visible with AOSLO at superior retina 1.5 mm eccentric to the fovea in a normal subject and P11. Normal (left) shows larger regularly spaced spots representing cones (filled arrowhead) with more numerous, smaller rods (small arrows) interleaved across the mosaic. In comparison, P11 (right) shows a different pattern of bright cones with normal reflectivity (filled arrowhead) and dark cones with impaired/diminished reflectivity (unfilled arrowhead), and more numerous smaller rods (small arrows). (B) The photoreceptor mosaic in two BCM patients at 0.8 and 0.5 mm eccentricity also showed rods along with two populations of cones. Scale bar=20 μm. (C) Enlarged examples of normal and BCM structures at different eccentricities. Schematic drawings (lowest panel) define the interpretation assigned to the intensity patterns observed. Normally waveguiding/reflecting bright cones have a characteristic reflectance profile (bright center with a dark ring and adjacent rods). Dark cones have a substantially reduced or missing central reflective component. (D–F) Quantitative measurements of rod and/or cone density derived from the AOSLO images (open bars), compared with previous estimates from histology (solid horizontal lines). Error bars are 1 SD. The dashed line indicates the expected (mean normal) S-cone density, assuming that S cones comprise 6–7% of the total normal cone population. In all cases, the patients with BCM had a lower cone density than that seen in normal subjects, but a higher total cone density than would be expected for just the S-cone submosaic, indicating that at least some of the cones in these images are L/M cones. AOSLO, adaptive optics scanning laser ophthalmoscope.
<b>FIG. 5.</b>
FIG. 5.
Photoreceptor inner and outer segments at the BCM foveola, and evidence of red/green cone-mediated visual function. (A and B) Left panels: An optical coherence tomography along the vertical meridian in a representative normal subject (A) and BCM P6 (B). Right panels: Enlarged view of the foveolar region. Hyperscattering bands are painted for visibility as in Fig. 3. The additional hyperscattering band at the BCM foveola is painted black. LRPs are overlaid. The lengths of COS and the additional OS in the BCM patient are bracketed. (C and D) LRPs are overlaid onto models of foveolar retina showing only cones in the normal (C) and a mixture of cones and another cell type in the BCM (D). Axial dimensions are to scale, but lateral dimensions are not. (E) Histograms of OS length measurements at the foveola of six BCM patients who lacked large cavitations. Shorter COS lengths and longer OS lengths are grouped; age and patient numbers are specified. Hashed gray bar to the left represents mean (±2SD) COS length for the normal (N). (F) The photoreceptor mosaic visible with AOSLO at the foveola in a normal subject compared with BCM patients P6 and P11. Normal (left) shows a contiguous mosaic of cones decreasing in diameter and increasing in density toward the center of the foveola. In comparison, P6 and P11 show a disrupted foveal mosaic made up of a central region of photoreceptors with a reduced density and reflectivity compared with normal and a surrounding ring of highly reflective bright photoreceptors. Square insets for each panel show an image from ∼0.1 mm from the foveal center (top) and an image at the foveal center (bottom). In the normal, it is not possible to determine the spectral subtype of the cones in these images, which are marked as filled yellow circles. In P6 and P11, the S cones are marked as filled blue circles, while the weakly reflective structures are marked as open yellow circles. Scale bar=20 μm. (G) Spectral sensitivity functions in normal subjects and BCM patient P15 at a retinal location centered at 0.6 mm eccentric to the foveola. Scotopic conditions recorded under dark adaptation; photopic conditions recorded on steady achromatic lights increasing from 1 to 20 cd/m2. Theoretical functions describing rod (gray), S-cone (blue), and L-/M-cone (orange) sensitivities are shown after vertical shifts to fit relevant normal and BCM data. X marks the stimuli not seen by the patient. OS, outer segment.

Similar articles

Cited by

References

    1. Applebury M.L., Antoch M.P., Baxter L.C., et al. (2000). The murine cone photoreceptor: a single cone type expresses both S and M opsins with retinal spatial patterning. Neuron 27, 513–523 - PubMed
    1. Ayyagari R., Kakuk L.E., Coats C.L., et al. (1999). Bilateral macular atrophy in blue cone monochromacy (BCM) with loss of the locus control region (LCR) and part of the red pigment gene. Mol. Vis. 5, 13. - PubMed
    1. Baseler H.A., Brewer A.A., Sharpe L.T., et al. (2002). Reorganization of human cortical maps caused by inherited photoreceptor abnormalities. Nat. Neurosci. 5, 364–370 - PubMed
    1. Blackwell H.R., and Blackwell O.M. (1957). Blue mono-cone monochromacy: a new color vision defect. J. Opt. Soc. Am. 47, 338
    1. Blackwell H.R., and Blackwell O.M. (1961). Rod and cone receptor mechanisms in typical and atypical congenital achromatopsia. Vis. Res. 1, 62–107

Publication types

Supplementary concepts