

doi: 10.1039/c3an01168b.
Simple enrichment and analysis of plasma lysophosphatidic acids
Affiliations
- PMID: 24067566
- PMCID: PMC3929374
- DOI: 10.1039/c3an01168b
Item in Clipboard
Simple enrichment and analysis of plasma lysophosphatidic acids
Analyst.
.
Abstract
A simple and highly efficient technique for the analysis of lysophosphatidic acid (LPA) subspecies in human plasma is described. The streamlined sample preparation protocol furnishes the five major LPA subspecies with excellent recoveries. Extensive analysis of the enriched sample reveals only trace levels of other phospholipids. This level of purity not only improves MS analyses, but enables HPLC post-column detection in the visible region with a commercially available fluorescent phospholipids probe. Human plasma samples from different donors were analyzed using the above method and validated by LC-ESI/MS/MS.
Figures
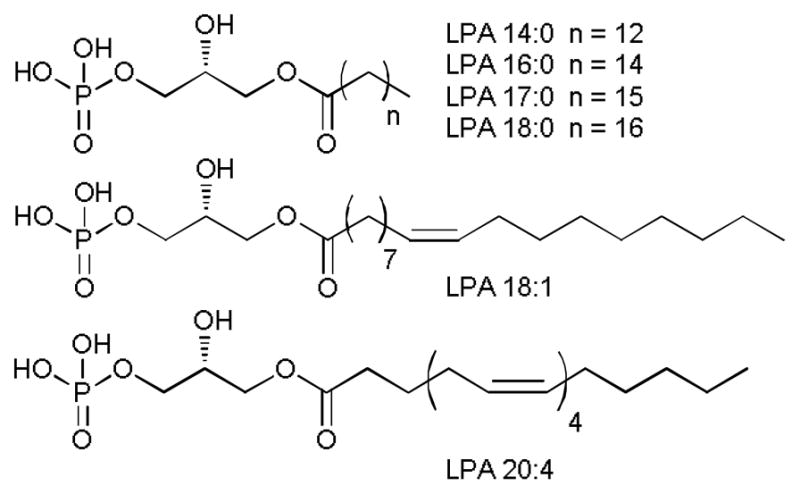
Structures of lysophosphatidic acids (LPAs).
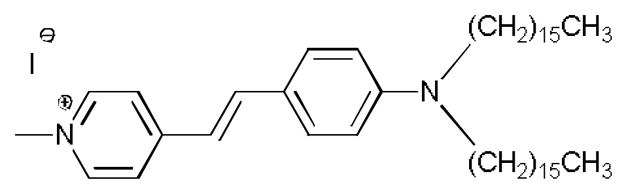
Structure of 4-(4-(Dihexadecylamino)styryl)-N-methylpyridinium iodide (DiA), used in the post-column fluorescence detection of LPA subspecies.
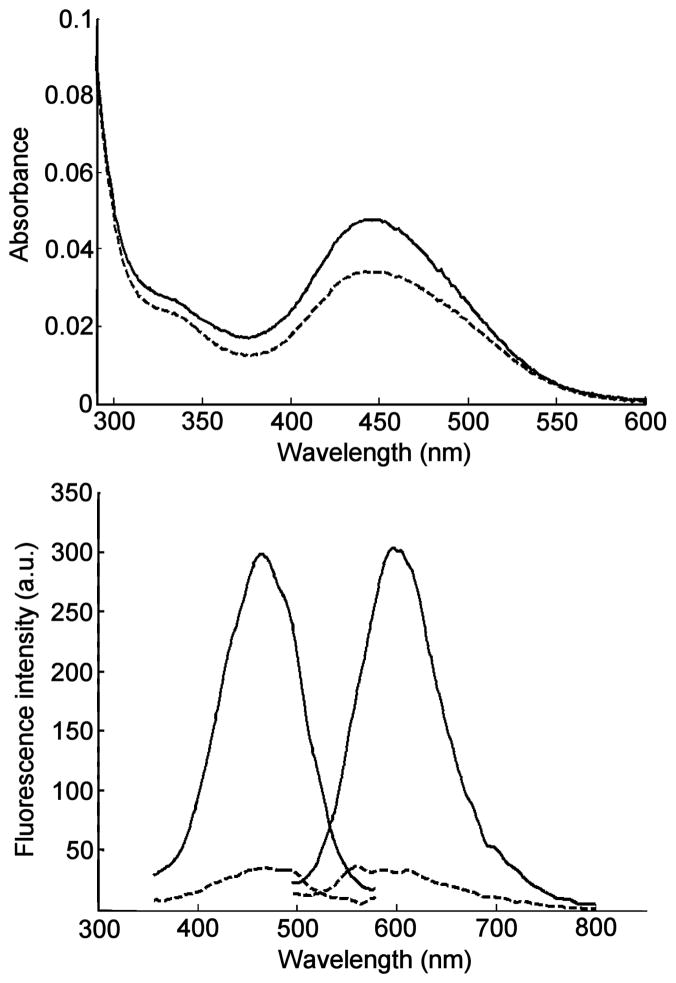
Absorption spectra (top) and fluorescence spectra (bottom) of 3 μM aqueous solutions of DiA alone (dashed lines) and in the presence of 10 μM LPA 18:0 (solid lines). Excitation/emisson wavelengths: 470/590 nm.
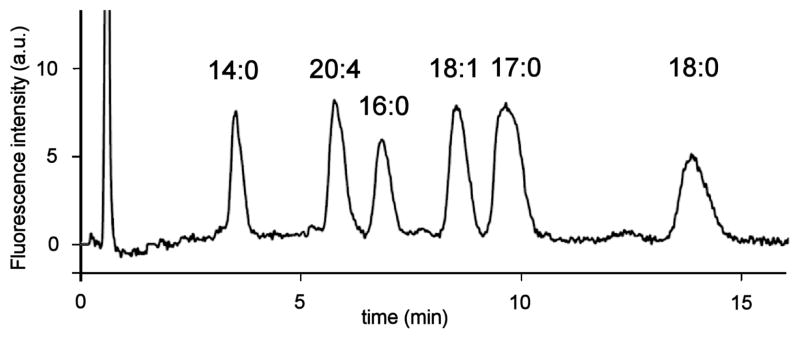
HPLC trace of a LPA mixture (10 μM LPA 14:0, 16:0, 18:0, 18:1, 20:4 and 20 μM LPA 17:0). Chromatographic conditions: column: Luna™ C-8, 3 μm, 50 × 2.0 mm; mobile phase: MeOH:phosphate buffer (50 mM, pH 2.5) 16:5; flow rate: 0.32 mL/min; injection volume: 20 μL; sample concentration: 10 μM in MeOH:H2O 9:1; post-column reagent: 10 μM DiA in H2O; reagent flow rate: 0.62 mL/min; excitation/emission wavelengths: 450/570 nm.
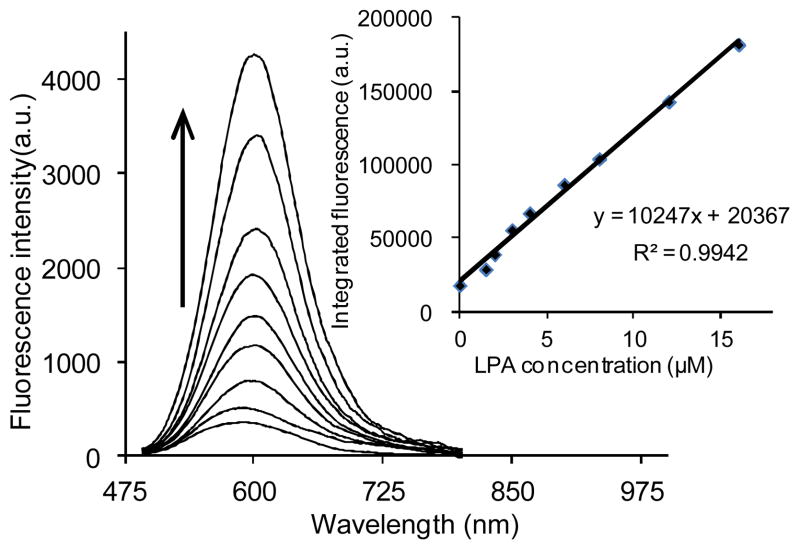
Emission spectra and calibration curve (inset) of 2.67 μM DiA upon titration with LPA (18:0).
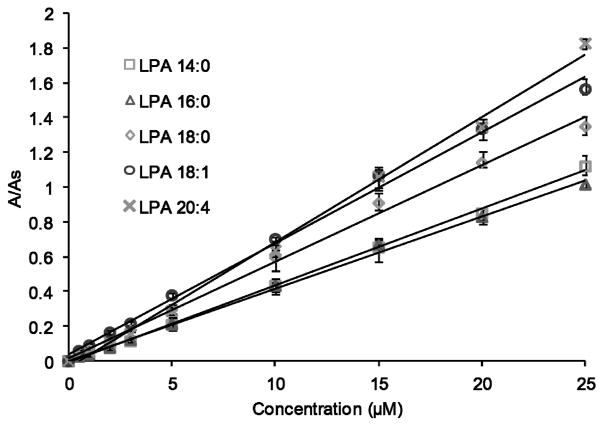
Calibration curves of specific LPA subspecies obtained by HPLC-post column fluorescence detection. The area ratio is the peak area of individual LPAs divided by the peak area of the internal standard (LPA 17:0). Data points represent the average of 4 runs.
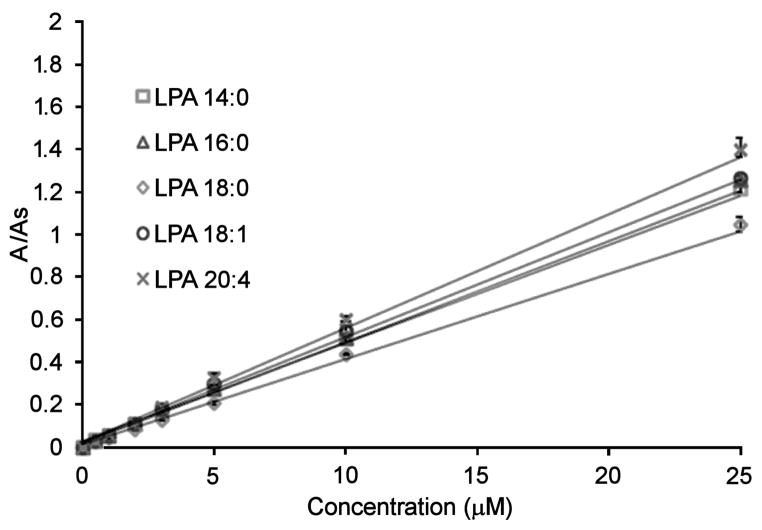
Calibration curves of LPAs using the LC-ESI/MS/MS method. The area ratio is the peak area of individual LPAs divided by the peak area of the internal standard (LPA 17:0).
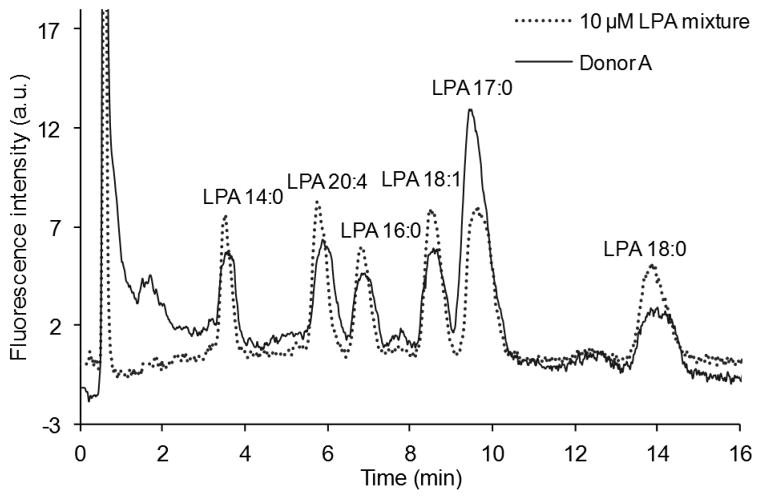
Chromatograms of a mixture containing 10 μM of each LPA (LPA 14:0, 16:0, 17:0, 18:0, 18:1 and 20:4) and LPAs isolated from human plasma (donor A) using the post-column detection method.
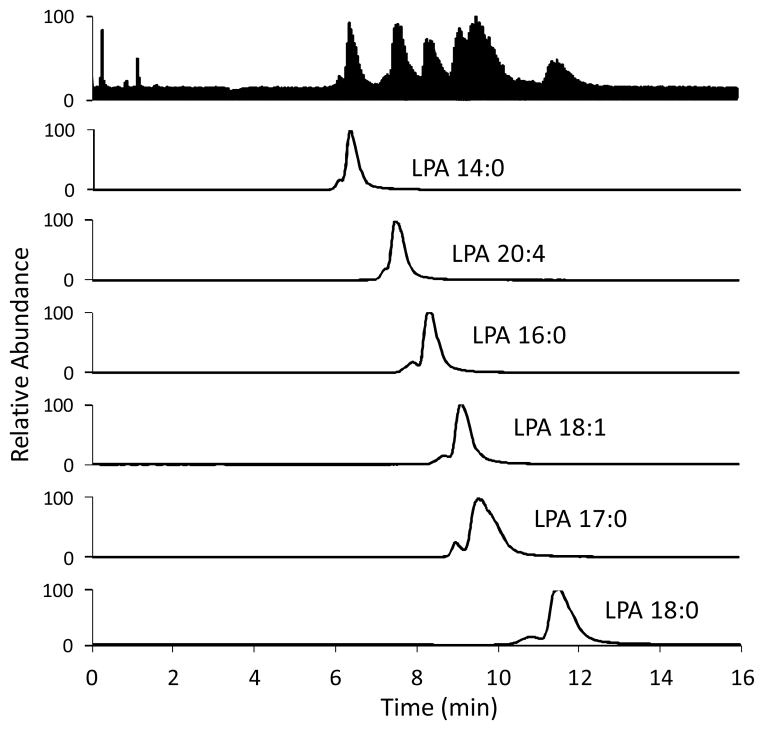
LC-ESI/MS/MS traces of a 10 μM standard mixture of LPAs. Column: Luna™ C-8 (50 × 2 mm, 3 μm) at 40 °C. Injection volume: 10 μL. Mobile phase: 9:1 MeOH:aqueous HCOOH (pH 2.5) at a flow rate of 0.4 mL/min. Parent and daughter ions were detected in the negative ion mode, sprayer voltage; 3.0 kV, capillary temperature at 300 °C.
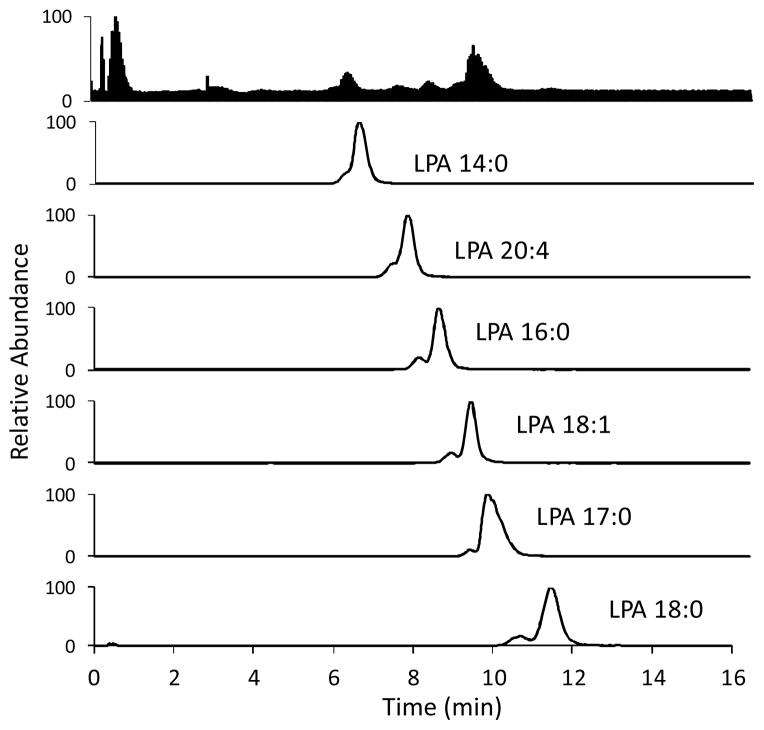
LC-ESI/MS/MS traces of a plasma sample (donor A). Conditions are the same as in Fig. 9.
Similar articles
-
Quantitative determination of lysophosphatidic acid by LC/ESI/MS/MS employing a reversed phase HPLC column.J Chromatogr B Analyt Technol Biomed Life Sci. 2008 Mar 15;864(1-2):22-8. doi: 10.1016/j.jchromb.2008.01.031. Epub 2008 Feb 2. J Chromatogr B Analyt Technol Biomed Life Sci. 2008. PMID: 18262478
-
Templated polymers enable selective capture and release of lysophosphatidic acid in human plasma via optimization of non-covalent binding to functional monomers.Analyst. 2015 Nov 21;140(22):7572-7. doi: 10.1039/c5an01597a. Analyst. 2015. PMID: 26455441 Free PMC article.
-
High-throughput analysis of sphingosine 1-phosphate, sphinganine 1-phosphate, and lysophosphatidic acid in plasma samples by liquid chromatography-tandem mass spectrometry.Clin Chem. 2009 Jun;55(6):1218-22. doi: 10.1373/clinchem.2008.113779. Epub 2009 Mar 26. Clin Chem. 2009. PMID: 19325012
-
Methods for quantifying lysophosphatidic acid in body fluids: a review.Anal Biochem. 2014 May 15;453:38-43. doi: 10.1016/j.ab.2014.02.021. Epub 2014 Mar 5. Anal Biochem. 2014. PMID: 24613261 Review.
-
[Clinical introduction of lysophosphatidic acid and autotaxin assays].Rinsho Byori. 2010 Jun;58(6):631-5. Rinsho Byori. 2010. PMID: 20662276 Review. Japanese.
Cited by
-
Challenges in accurate quantitation of lysophosphatidic acids in human biofluids.J Lipid Res. 2014 Aug;55(8):1784-96. doi: 10.1194/jlr.D050070. Epub 2014 May 28. J Lipid Res. 2014. PMID: 24872406 Free PMC article. Clinical Trial.
-
Facile Titrimetric Assay of Lysophosphatidic Acid in Human Serum and Plasma for Ovarian Cancer Detection.J Cancer Prev. 2023 Jun 30;28(2):31-39. doi: 10.15430/JCP.2023.28.2.31. J Cancer Prev. 2023. PMID: 37434795 Free PMC article.
-
Acting as a Molecular Tailor: Dye Structural Modifications for Improved Sensitivity toward Lysophosphatidic Acids Sensing.ACS Omega. 2022 Dec 28;8(1):1067-1078. doi: 10.1021/acsomega.2c06420. eCollection 2023 Jan 10. ACS Omega. 2022. PMID: 36643514 Free PMC article.
-
Detection of the Ovarian Cancer Biomarker Lysophosphatidic Acid in Serum.Biosensors (Basel). 2020 Feb 14;10(2):13. doi: 10.3390/bios10020013. Biosensors (Basel). 2020. PMID: 32075013 Free PMC article.
-
Multiple biomarker algorithms to predict epithelial ovarian cancer in women with a pelvic mass: Can additional makers improve performance?Gynecol Oncol. 2019 Jul;154(1):150-155. doi: 10.1016/j.ygyno.2019.04.006. Epub 2019 Apr 13. Gynecol Oncol. 2019. PMID: 30992143 Free PMC article. Clinical Trial.
References
-
- Feng L, Mills GB, Prestwich GD. Expert Opin Ther Pat. 2003;13:1619.
-
- Frisca F, Sabbadini RA, Goldshmit Y, Pebay A. In: International Review of Cell and Molecular Biology. Jeon KW, editor. Vol. 296. Vol. 296. 2012. p. 273. - PubMed
Publication types
MeSH terms
Substances
Grants and funding
LinkOut - more resources
Full Text Sources
Other Literature Sources
Miscellaneous