Comparative Study
. 2013 Dec;87(24):13150-60.
doi: 10.1128/JVI.01415-13. Epub 2013 Sep 25.

Comparative analysis of adeno-associated virus capsid stability and dynamics

Affiliations
Comparative Study

Comparative analysis of adeno-associated virus capsid stability and dynamics

Vamseedhar Rayaprolu et al. J Virol. 2013 Dec.

Abstract

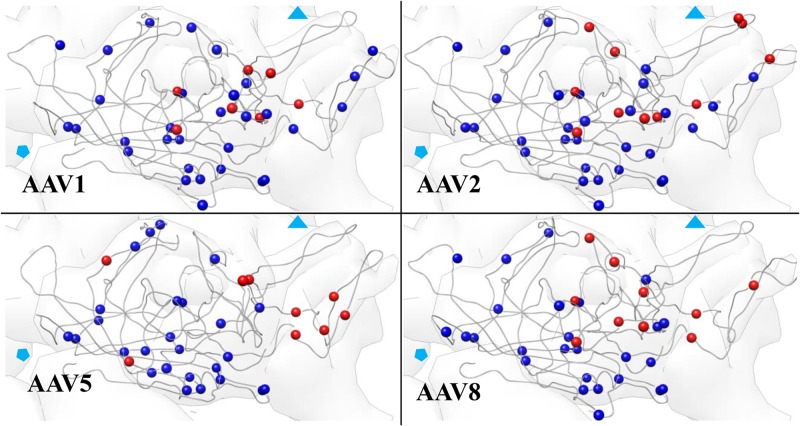
Icosahedral viral capsids are obligated to perform a thermodynamic balancing act. Capsids must be stable enough to protect the genome until a suitable host cell is encountered yet be poised to bind receptor, initiate cell entry, navigate the cellular milieu, and release their genome in the appropriate replication compartment. In this study, serotypes of adeno-associated virus (AAV), AAV1, AAV2, AAV5, and AAV8, were compared with respect to the physical properties of their capsids that influence thermodynamic stability. Thermal stability measurements using differential scanning fluorimetry, differential scanning calorimetry, and electron microscopy showed that capsid melting temperatures differed by more than 20°C between the least and most stable serotypes, AAV2 and AAV5, respectively. Limited proteolysis and peptide mass mapping of intact particles were used to investigate capsid protein dynamics. Active hot spots mapped to the region surrounding the 3-fold axis of symmetry for all serotypes. Cleavages also mapped to the unique region of VP1 which contains a phospholipase domain, indicating transient exposure on the surface of the capsid. Data on the biophysical properties of the different AAV serotypes are important for understanding cellular trafficking and is critical to their production, storage, and use for gene therapy. The distinct differences reported here provide direction for future studies on entry and vector production.


Figures

Fig 1
Fig 1
Structure and conservation of adeno-associated viruses. (A) Surface topology of AAV2, shown as a depth-cued model, with blue regions being further from the particle center and white closer. (B) Icosahedral grid overlaid on a structural model of AAV2. Four subunits are shown in different colors to emphasize interdigitation. Symbols indicate 2-fold (oval), 3-fold (triangle), and 5-fold (pentagon) axes. The capsid is in the same orientation as in panel A. (C) Superimposition of Cα positions of the VP3 monomers of AAV1, AAV2, AAV5, and AAV8. Amino acid sequence conservation is shown in the color scheme; purple is highest, and gold is lowest. The core of the subunit is highly conserved, with the sequence variability being primarily in loops I to IX. The N and C termini are also indicated. The triangle, pentagon, and oval indicate the positions of the 3-, 5- and 2-fold axes. (D) Sequence identity between serotypes. Data were obtained from multiple sequence alignment of AAV1, AAV2, AAV5, and AAV8 using ClustalW.
Fig 2
Fig 2
Temperature dependence of particle disassembly. (A) Measurements of fluorescence intensity during heating show that AAV serotypes denature at different temperatures. Increases in intensity are associated with binding of Sypro orange with hydrophobic pockets that become accessible as the protein unfolds. (B) Differential scanning calorimetry profiles. Data are the normalized averages from three temperature scan experiments. Data were collected at pH 7 for AAV1 (dotted line), -2 (solid line), -5 (dashed line), and -8 (dotted and dashed line).
Fig 3
Fig 3
DSF measurements of fluorescence intensity during heating of an AAV serotype mixture. AAV2 and AAV5 show distinct melting temperatures when analyzed as a mixture after coincubation for 2 h. Data are the normalized averages from three temperature scan experiments. The curve for expected results was calculated by linear addition of melting profiles of pure serotype reactions shown in Fig. 2.
Fig 4
Fig 4
Thermal stability of AAV particles after heating. AAV capsids were heated at 37, 45, 65, 75, and 85°C for 3 min and then analyzed by negative-stain electron microscopy. Representative images at a magnification of ×31,000 show a serotype dependence on the temperature at which morphological changes, including complete disruption, occur. Heating experiments were repeated 3 times using particles from different virus preparations. Images were selected to show presence or absence of intact particles, not total number across grids.
Fig 5
Fig 5
Proteolysis of AAV serotypes monitored using SDS-PAGE. (A) SDS-PAGE gel for the 4 serotypes, proteinase K (PK), and bovine serum albumin (BSA). Each serotype was subjected to proteinase K treatment at three time points (0, 10, and 60 min). Bands a, b, and c have molecular masses of 55 kDa, 37 kDa, and 33 kDa, respectively. (B) Graphical representation of the proteolytic trends of the 4 serotypes observed on the gels, with the x axis showing time and y axis the relative intensity. Error bars show ±1 standard deviation.
Fig 6
Fig 6
Distribution of potential and observed protease sites in VP3. The position of potential trypsin cleavage sites in each AAV are shown in blue, and lysines and arginines at which cleavage occurs are shown in red. Solid symbols show the position of the 3- and 5-fold symmetry axes.
Fig 7
Fig 7
Icosahedral locations of cleavage sites. (A) Top and side views of 3 subunits of AAV2 VP3. Proteolytic sites on each subunit are marked with a different color. The hollow black symbols indicate the approximate symmetry fold axes. (B) Average distance (Å) of the cleaved residues shown in panel A from each icosahedral symmetry axis. (C) Representative image of the icosahedral symmetry axes (f, fold; l, left; r, right; m, main) and the approximate distances of a representative residue (609 of AAV2) from each of these axes.

References

    1. Halder S, Ng R, Agbandje-McKenna M. 2012. Parvoviruses: structure and infection. Future Virol. 7:253–278
    1. Muzyczka N, Berns KI. 2001. Parvoviridae: the viruses and their replication, p 2327–2360 In Knipe DM, Howley PM. (ed), Fields virology, 4th ed. Lippincott Williams and Wilkins, New York, NY
    1. Agbandje-McKenna M, Kleinschmidt J. 2011. AAV capsid structure and cell interactions. Methods Mol. Biol. 807:47–92 - PubMed
    1. Agbandje-McKenna M, Chapman MS. 2006. Correlating structure with function in the viral capsid, p 125–139 In Kerr JR, Cotmore SF, Bloom ME, Linden R, Parrish CR. (ed), Parvoviruses. Hodder Arnold Publication, London, United Kingdom
    1. Gao G, Vandenberghe LH, Alvira MR, Lu Y, Calcedo R, Zhou X, Wilson JM. 2004. Clades of adeno-associated viruses are widely disseminated in human tissues. J. Virol. 78:6381–6388 - PMC - PubMed

Publication types

Substances