. 2014 Feb;95(2):357-67.
doi: 10.1189/jlb.1012531. Epub 2013 Sep 25.

Targeted STAT3 disruption in myeloid cells alters immunosuppressor cell abundance in a murine model of spontaneous medulloblastoma

Affiliations

Targeted STAT3 disruption in myeloid cells alters immunosuppressor cell abundance in a murine model of spontaneous medulloblastoma

Catalina Abad et al. J Leukoc Biol. 2014 Feb.

Abstract

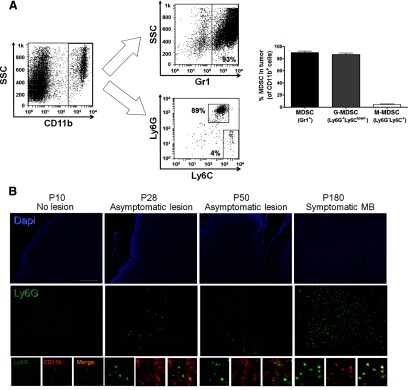
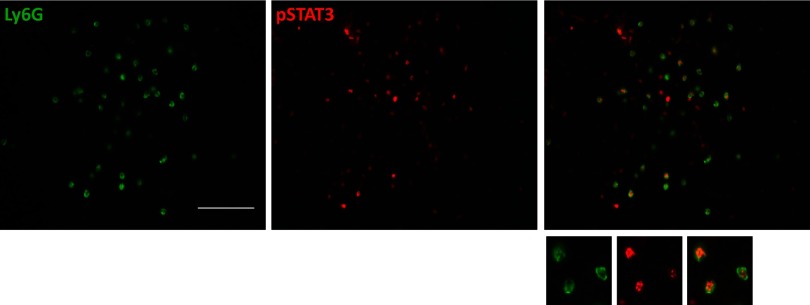
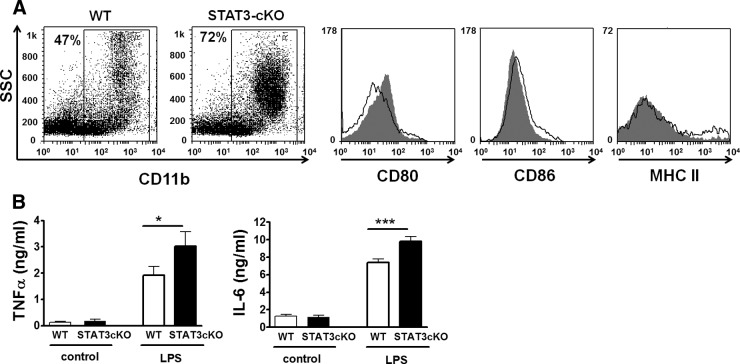
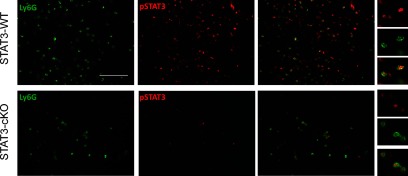
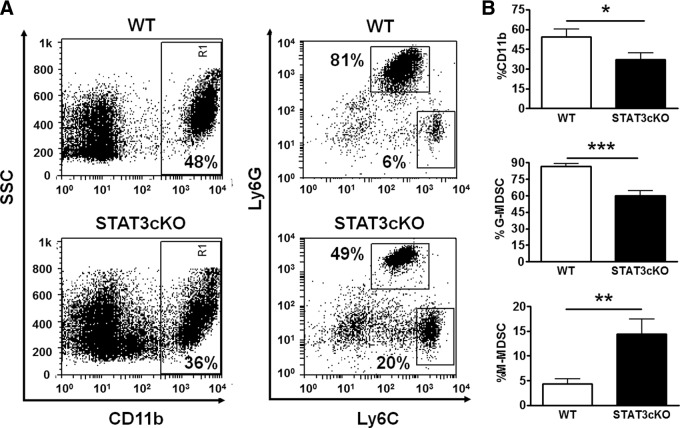
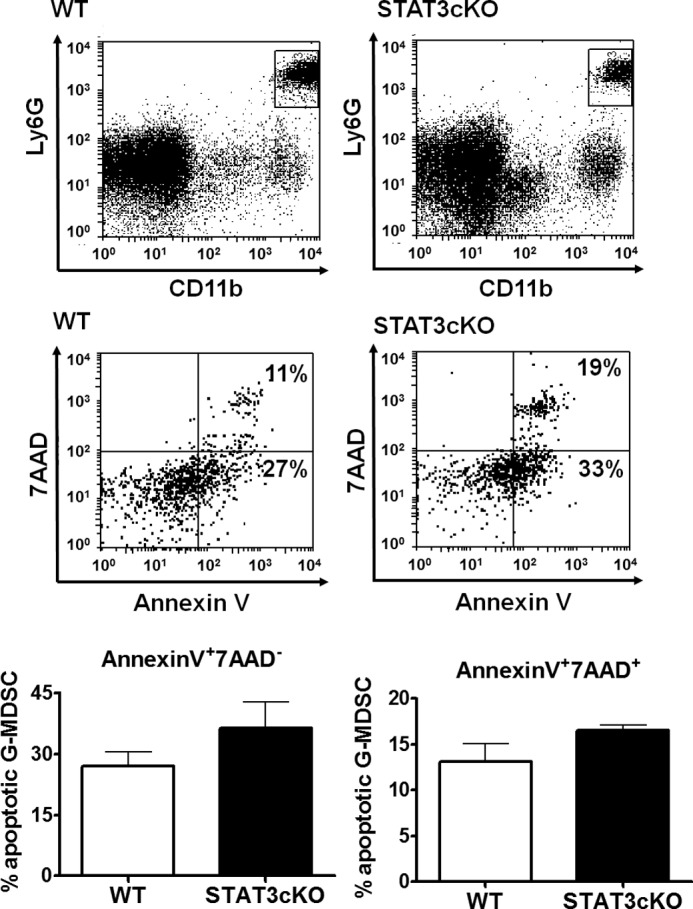
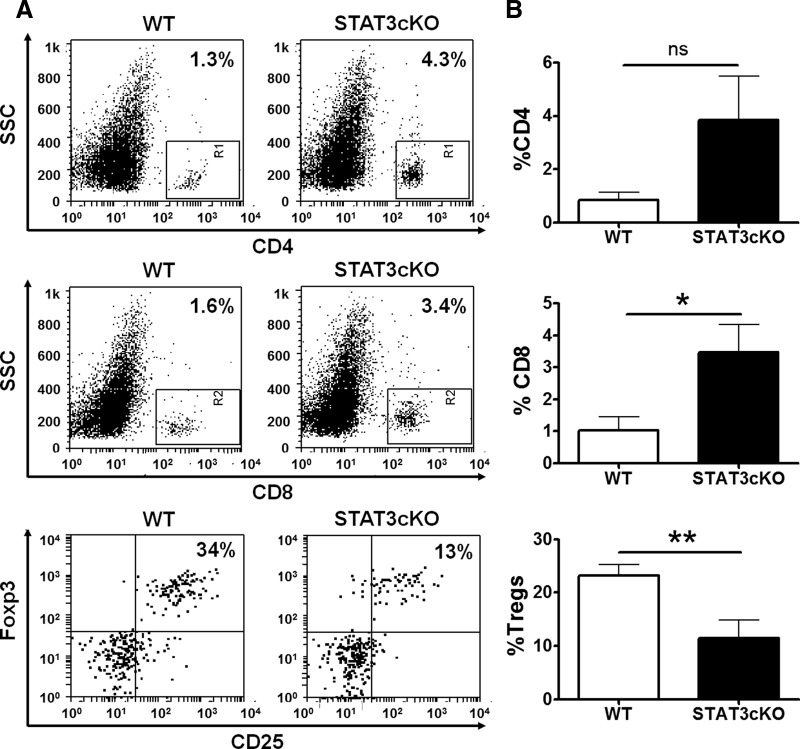
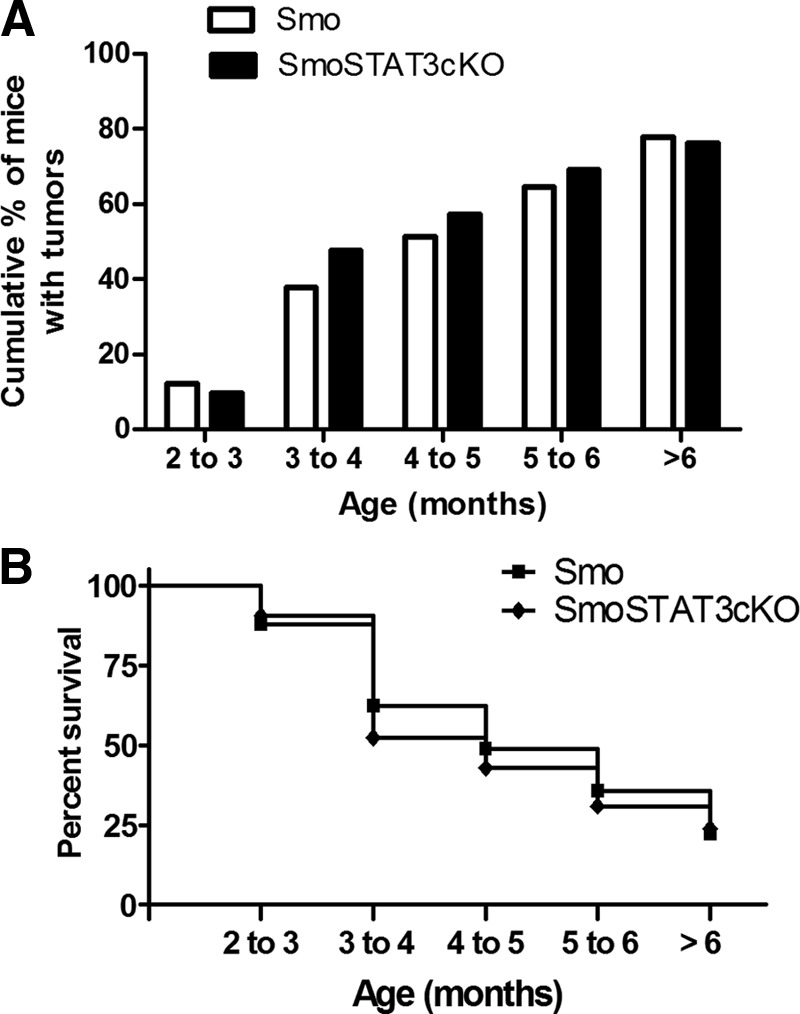
Although the immune system may provide early protection against cancer, tumors may exploit the healing arm of the immune system to enhance their growth and metastasis. For example, myeloid derived suppressor cells (MDSCs) are thought to promote tumor growth by several mechanisms, including the suppression of T cell activity. It has been suggested that STAT3 activation in myeloid cells modulates multiple aspects of MDSC physiology, including their expansion and activity. Whereas most animal studies investigating tumor immunology have used tumor implants, we used transgenic mice (Smo*) that spontaneously develop medulloblastoma brain tumors to investigate the temporal accumulation of MDSCs within tumors and how myeloid STAT3 disruption affects MDSC and other immune cell types. We found distinct populations of MDSC in medulloblastoma tumors, with a high prevalence of CD11b(+)Ly6G(+)Ly6C(low/-) cells, described previously by others as G-MDSCs. These were found early in tumor development, in premalignant lesions located on the surface of the cerebellum of 28-day-old mice. In fully developed tumors, pSTAT3 was found in the majority of these cells. Conditional STAT3 gene disruption in myeloid cells resulted in an enhanced proinflammatory phenotype of macrophages in Smo* mice. Moreover, a significant reduction in the abundance of G-MDSCs and Tregs was observed within tumors along with an increased presence of CD4(+) and CD8(+) cells. Despite these alterations in immune cells induced by myeloid STAT3 disruption, we found no effect on tumor incidence in Smo* mice with this deletion.

Keywords: STAT3; immunosuppression; myeloid-derived suppressor cell.


Figures

Figure 1.
Figure 1.. MDSCs are present in medulloblastoma tumors from Smo* mice.
(A) Flow cytometry analysis of immune cell suspensions prepared from adult Smo* mice medulloblastoma tumors (n=9) using CD11b, Gr1, Ly6G, and Ly6C markers. Cells were first gated on the CD11b+ population and then analyzed for Gr1 or Ly6C/Ly6G expression. Representative FACS plots (left) and average quantification (right) are shown. Graph shows percent of cells within the CD11b+ population. SSC, Side-scatter. (B) Immunofluorescence analysis of CD11b+Ly6G+ cell presence in cerebellar lesions of Smo* mice collected at different stages: Postnatal Day (P) 10 (no lesions observed, preserving normal cerebellar structures), P28 (cell-dense, ectopic lesions are observed), P50, and P180 (symptomatic, fully developed tumor is present). CD11b, red; Ly6G, green; nuclei (DAPI), blue. One experiment from three is shown. Original scale bar, 100 μm.
Figure 2.
Figure 2.. STAT3 pathway activation in Ly6G+ cells from medulloblastoma in Smo* mice.
Symptomatic tumors in Smo* mice show coexpression of activated pSTAT3 (red) and Ly6G (green) within the tumors. Representative images of three experiments are shown. Original scale bar, 100 μm.
Figure 3.
Figure 3.. Specific reduction of STAT3 in myeloid cells leads to an enhanced proinflammatory phenotype.
A flow cytometry analysis of spleen CD11b+ cells from WT versus STAT3-cKO mice with CD80, CD86, and MHC class II markers (n=3). STAT3-cKO myeloid cells presented higher CD80, slightly reduced CD86, and no different MHC class II expressions. Representative FACS plots and histograms (white, WT; gray, STAT3-cKO) are shown. (B) In vitro response to LPS of peritoneal cells from WT versus STAT3-cKO mice. Cells were cultured in complete RPMI-1640 medium with/without LPS (100 ng/ml; E. coli), and cytokine content in supernatants was determined by ELISA. STAT3-cKO myeloid cells produced higher levels of TNF-α and IL-6 than WT cells. Student's t-test, *P < 0.05; ***P < 0.001. A representative experiment of three is shown.
Figure 4.
Figure 4.. Conditional deletion of STAT3 in myeloid cells leads to diminished pSTAT3 in Ly6G+ cells within the tumors of Smo* mice.
Sections from symptomatic Smo* WT (upper) and STAT3-cKO (lower) cerebellar tumors were stained with anti-Ly6G (green) and pSTAT3 (red) antibodies. Ly6G immunoreactive cells were abundant in tumors from WT mice but scarce in STAT3-cKO mice. pSTAT3 staining was present in most of Ly6G+ cells in WT mice tumors but lost in the same cells from STAT3-cKO mice. Original scale bar, 100 μm.
Figure 5.
Figure 5.. The prevalence of G-MDSC is reduced, but M-MDSC increased within the tumor myeloid population of STAT3-cKO versus WT mice.
A cellular suspension highly enriched in immune cells was isolated from Smo* WT or STAT3-cKO tumors, as described in Materials and Methods. Cells were stained with CD11b, Ly6G, and Ly6C antibodies and analyzed in a FACSCalibur. Within the CD11b+ population, G-MDSCs were gated as Ly6G+Ly6Clow/−, and M-MDSCs were gated as Ly6GLy6C+ cells. (A) Representative FACS plots of Smo* WT and STAT3-cKO tumors. (B) Average proportions of CD11b+ and MDSC subsets (n=8). Student's t-test, *P < 0.05; **P < 0.01; and ***P < 0.001.
Figure 6.
Figure 6.. G-MDSCs from STAT3-cKO mice tend to have increased apoptotic index compared with those from WT mice.
Apoptosis in G-MDSCs from tumors in Smo* WT or STAT3-cKO mice was measured by flow cytometry using 7-AAD and Annexin V as markers. Cells were stained with CD11b and Ly6G, and apoptotic populations were depicted within the CD11b+Ly6G+ gate. 7-AADAnnexin V+ cells were defined as early apoptotic cells and 7-AAD+Annexin V+ cells as late apoptotic/necrotic cells. Representative FACS plots (upper) and average proportions (lower) are shown.
Figure 7.
Figure 7.. CD4+ and CD8+ cells are increased, but Tregs are reduced in STAT3-cKO mice compared with WT mice tumors.
The proportions of CD4+, CD8+, and CD25+Foxp3+ cells in Smo* WT versus STAT3-cKO tumors were determined by flow cytometry. For Tregs, cells were first gated on the CD4+ population. (A) Representative FACS plots and (B) the average proportions of these cells (n=8). Student's t-test, *P < 0.05; **P < 0.01.
Figure 8.
Figure 8.. Tumor incidence is not altered in selective myeloid STAT3-cKO.
The development of medulloblastoma was monitored in Smo* WT (n=90) and Smo* STAT3-cKO (n=41) mice. (A) The cumulative percent of mice with tumors and (B) a Kaplan-Meyer representation of mouse survival. Comparison of survival curves performed using the log rank test showed no statistical differences between the survivals of the two groups of mice.

References

    1. Condamine T., Gabrilovich D. I. (2011) Molecular mechanisms regulating myeloid-derived suppressor cell differentiation and function. Trends Immunol. 32, 19–25 - PMC - PubMed
    1. Filipazzi P., Huber V., Rivoltini L. (2012) Phenotype, function and clinical implications of myeloid-derived suppressor cells in cancer patients. Cancer Immunol. Immunother. 61, 255–263 - PMC - PubMed
    1. Ueha S., Shand F. H., Matsushima K. (2011) Myeloid cell population dynamics in healthy and tumor-bearing mice. Int. Immunopharmacol. 11, 783–788 - PubMed
    1. Youn J. I., Nagaraj S., Collazo M., Gabrilovich D. I. (2008) Subsets of myeloid-derived suppressor cells in tumor-bearing mice. J. Immunol. 181, 5791–5802 - PMC - PubMed
    1. Movahedi K., Guilliams M., Van den Bossche J., Van den Bergh R., Gysemans C., Beschin A., De Baetselier P., Van Ginderachter J. A. (2008) Identification of discrete tumor-induced myeloid-derived suppressor cell subpopulations with distinct T cell-suppressive activity. Blood 111, 4233–4244 - PubMed

Publication types

MeSH terms