. 2013 Sep 25;33(39):15362-75.
doi: 10.1523/JNEUROSCI.1148-13.2013.

Fast vesicle transport is required for the slow axonal transport of synapsin

Affiliations

Fast vesicle transport is required for the slow axonal transport of synapsin

Yong Tang et al. J Neurosci. .

Erratum in

Abstract

Although it is known that cytosolic/soluble proteins synthesized in cell bodies are transported at much lower overall velocities than vesicles in fast axonal transport, the fundamental basis for this slow movement is unknown. Recently, we found that cytosolic proteins in axons of mouse cultured neurons are conveyed in a manner that superficially resembles diffusion, but with a slow anterograde bias that is energy- and motor-dependent (Scott et al., 2011). Here we show that slow axonal transport of synapsin, a prototypical member of this rate class, is dependent upon fast vesicle transport. Despite the distinct overall dynamics of slow and fast transport, experimentally induced and intrinsic variations in vesicle transport have analogous effects on slow transport of synapsin as well. Dynamic cotransport of vesicles and synapsin particles is also seen in axons, consistent with a model where higher-order assemblies of synapsin are conveyed by transient and probabilistic associations with vesicles moving in fast axonal transport. We posit that such dynamic associations generate the slow overall anterogradely biased flow of the population ("dynamic-recruitment model"). Our studies uncover the underlying kinetic basis for a classic cytosolic/soluble protein moving in slow axonal transport and reveal previously unknown links between slow and fast transport, offering a clearer conceptual picture of this curious phenomenon.


Figures

Figure 1.
Figure 1.
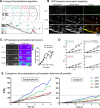
Differential dynamics of slow and fast transport proteins in cultured neurons. A, Overall experimental design (also applies to Fig. 2): Cultured hippocampal neurons were cotransfected with GFP-tagged synapsin (or synaptophysin) and soluble mCherry; and their axonal transport/presynaptic accumulation was imaged for up to 5 h at various time compressions. B, Slow axonal transport of synapsin. Selected frames from a time-lapse shows slow ingress of GFP:synapsin into axons over 5 h (arrowhead indicates “front”). Anterograde is left to right; axon segment shown is ∼80 μm away from soma/axon junction. Graph below, Rise of fluorescence intensity within the boxed ROI (“window”) above. Images were taken every 10 min for 1 h; and then every 30 min for the next 4 h. C, Kymographs from long-term transport imaging of GFP:synapsin, distance is on the x-axis, time on y-axis. Left panels, Grayscale and pseudocolor kymographs of the axon shown in B. There is slow, gradual accumulation of fluorescence in the axon over 5 h of imaging (each tick on left represents an imaging time point). Right panels, Kymographs from an axon that was imaged with a relatively higher time compression (one image every 5 s) to highlight the “wave-like” kinetics of synapsin transport. Regression analysis of the wave-front predicts average rates of 0.02–0.03 μm/s (∼1.7–2.5 mm/d), in line with known SCb rates. D, Experiments with tagged synaptophysin yielded entirely different results, where a plethora of mobile vesicles were seen under all imaging conditions. A kymograph from long-term imaging of mRFP-tagged synaptophysin (mRFP:SyPhy) in axons is shown as an example. Discrete moving vesicles are seen, unlike the slow-moving “wave” seen with synapsin.
Figure 2.
Figure 2.
Characterizing overall kinetics of slow and fast transport proteins in cultured hippocampal neurons. A, A method to quantify accumulation of slow and fast component proteins (synapsin and synaptophysin respectively) in boutons. Neurons were transfected/imaged as described in Figure 1A, and fluorescence accumulation within boutons was quantified over 5 h of imaging. Quantitative algorithms were developed to pinpoint the distance of a given bouton from the soma/axon junction (indicated by ×). For quantification, boutons from all axons analyzed were binned into quartiles (Q1–Q4), 50 μm bins based on their distance from the soma, and fluorescence accumulation in boutons within each bin was analyzed as a group. B, Selected panels on left, The axonal accumulation of GFP:synapsin and a corresponding accumulation in distal boutons over a period of 5 h (t = 0 denotes the first time point when the axons were imaged). In contrast, soluble mCherry is rapidly distributed throughout the axons, as diffusion is rapid at these short distances (middle panels). Right panels, Overlay of the two proteins: green represents synapsin; red represents mCherry. C, Left panels, An example of GFP:synapsin accumulation in boutons over 5 h; average intensities of two boutons (1 and 2) quantified on right. D, Quantification of average intensities in boutons over 5 h (normalized to initial intensities within each bouton, F0). Although both synaptophysin (triangles) and synapsin (circles) intensities incrementally rise with time, the kinetics of synapsin accumulation was slower than synaptophysin for all quartiles examined. E, Side-by-side comparison of all synaptic accumulation data; ∼50 boutons from three separate culture sets were examined for each protein. There are slower kinetics of synapsin accumulation for all boutons examined.
Figure 3.
Figure 3.
Inhibiting axonal transport of Golgi-derived vesicles in cultured neurons. A, Photoactivation strategy to evaluate slow axonal transport of synapsin (region between arrows was photoactivated). The anterograde bias of photoactivated synapsin was used as a readout of its slow axonal transport (see Materials and Methods). B, Neurons underwent various manipulations to disrupt export of Golgi-derived vesicles (also see Results), and axonal transport of synaptophysin (SyPhy):mRFP or Mito:mRFP was evaluated. C, Examples of SyPhy:mRFP kymographs from control/BFA-treated axons highlight diminutions in vesicle transport. Axons were imaged at 5 frames/s; time elapsed is on the right of the kymographs. D, Quantification of all transport data indicates that the above manipulations also decreased anterograde transport of synaptophysin and led to increases in stalled particles. However, BFA treatments did not alter axonal transport of mitochondria, suggesting specific diminutions of Golgi-derived vesicles; ∼10–20 axons (200–600 particles) from two separate culture sets were analyzed in each condition. E, Synaptic targeting of GFP-synapsin was also greatly diminished after BFA treatment, as shown in the representative images on top (normalized to the same range) and quantitation of “targeting factor” below (see Results).
Figure 4.
Figure 4.
Slow cytosolic transport is inhibited by disruptions in vesicle transport. A, Kymographs show dispersion of photoactivated PAGFP:synapsin in axons. Red arrowhead and dashed vertical line indicate the center of the photoactivated zone. In control axons (left panels), PAGFP disperses as a plume of fluorescence with an anterograde bias (left to right is proximal to distal), whereas this bias is attenuated in BFA-treated axons (right panels). B, Raw “intensity-center shifts” of the kymographs from B, depicting the anterograde displacement/slow transport of the synapsin population (see Results). C, Mean intensity-center shifts and curve-fits for all experiments with PAGFP:synapsin. There is diminution of synapsin transport by BFA, ARF-1, and 19°C incubation. D, As expected for free diffusion, there was no sustained bias of untagged PAGFP in axons, with or without BFA. N = number of axons imaged; 2–4 separate culture sets were imaged for each condition.
Figure 5.
Figure 5.
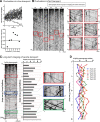
Intrinsic fluctuations in slow and fast axonal transport. A, Top, Individual PAGFP:synapsin intensity-center shifts of all axons examined for a single dataset (Fig. 4D, left, from the “control” group). There is variability in individual shifts. Bottom, To evaluate potential intrinsic fluctuations in synapsin transport within the same axon, PAGFP:synapsin was repeatedly photoactivated (at 5 min intervals) and time-lapse imaging was performed to determine intensity-center shifts at each time point. Each data point in the graph represents the average shift from a single time-lapse movie (∼>40 s of imaging time). There is variability in synapsin transport within the same axon over time. B, Synaptophysin:mRFP transport was visualized at 5 frames/s for 300 s of total imaging time using protocols that tracked all (or most) moving particles with minimal bleaching (see Materials and Methods); 30 s cropped insets on right (red boxes) highlight variations in transport frequency. C, Each kymograph was divided into 15 s bins (horizontal red lines in kymograph shown), and the number of mobile anterograde particles in each bin was quantified. Three such bins are zoomed on right. There are intrinsic fluctuations in synaptophysin transport. D, Cumulative data from several axons also highlight such transport variations from axon to axon. SyPhy, Synaptophysin.
Figure 6.
Figure 6.
Correlated fluctuations of fast and slow axonal transport. A, Tandem imaging protocol. Neurons were transfected with synaptophysin (SyPhy:mRFP) and PAGFP:synapsin, and axonal transport of both synaptophysin and synapsin was sequentially analyzed in the same axon as described in the text. Bottom, Kymographs of SyPhy and synapsin imaging from two axons. There is robust SyPhy and synapsin transport (the latter determined by intensity-center shifts) in axon 1 but diminished transport of both in axon 2. B, The number of mobile anterograde SyPhy particles were not altered in the “before” and “after” datasets, indicating that transport parameters within a given axon were generally similar during the short (60 s) of total imaging. C, Average intensity-center shifts of synapsin in axons significantly correlated with the number of motile anterograde SyPhy particles; however, no correlations were seen with retrograde/stationary particles (D). Approximately 40 axons from 5 separate culture sets were analyzed. E, Left, Using the photoactivation assay, slow axonal transport of a PAGFP-tagged synapsin fragment (PAGFP:DE) was compared with the full-length protein. This synapsin fragment lacks the domains that are involved in association of synapsin with vesicles (see Results). Anterograde bias of the DE domain was greatly attenuated. Presynaptic targeting of a GFP:DE construct was also greatly diminished (inset), confirming its weak association with vesicles (synaptic “targeting factor” quantified as in Gitler et al., 2004). Middle, Incubation of neurons with ionomycin (10 μm for 30 min), expected to dissociate synapsins from vesicles, also inhibited synapsin transport. Right, PKA activation by forskolin (50 μm for 30 min) induced a retrograde bias in synapsin transport, but the PKA activator H89 (10 μm for 30 min) did not influence the anterograde bias of synapsin (see Results).
Figure 7.
Figure 7.
Simulations of fast vesicular and cytosolic slow axonal transport. A, A virtual environment was created to simulate motile vesicles (left kymograph) and cytosolic/SCb particles (right kymograph) emerging from a hypothetical “cell body” into an “axon” (anterograde is left to right, time on y-axis). In addition to diffusion, cytosolic particles were allowed to interact with vesicles for user-defined times. Using these simulations, particle motility can be modeled over long distances and for prolonged periods of time, unattainable by conventional imaging. B, Simulated kymographs of cytosolic particles into axons with and without concurrent ingress of motile vesicles. The movement of cytosolic particles is greatly facilitated by the presence of motile vesicles. C, Intensity-center shifts (red line) were generated from the virtual kymographs (see Materials and Methods). D, Intensity-center shifts of the cytosolic/SCb population (mean ± SD shifts from four independent simulations are shown). The predicted average transport rate of the cytosolic population from these simulations was 0.02109 μm/s (∼2 mm/d), in line with known SCb rates from radiolabeling studies. E, When kymographs were scaled to reveal all moving particles, occasional persistent particles, distal to the slowly progressing “wave,” were also seen (see Results). F, Sustained anterograde shifts in simulations (red data points) were only seen when interactions between vesicles/SCb cargoes were assumed, and movement of vesicles alone (without vesicle/SCb–cargo interactions) were insufficient to generate robust transport (yellow data points).
Figure 8.
Figure 8.
Cotransport of synapsin and synaptophysin in axons and a model. A, Neurons were cotransfected with PAGFP:synapsin and synaptophysin:mRFP (SyPhy:mRFP); the PAGFP:synapsin was photoactivated in primary axons (black arrowheads indicate the photoactivated zone); and GFP/RFP fluorescence was simultaneously visualized by live imaging. There is colocalization of mobile synapsin particles with synaptophysin (white arrowhead indicates one such particle). B, Neurons were cotransfected with GFP:synapsin and SyPhy:mRFP, and GFP/RFP fluorescence was simultaneously visualized in thin, distal axons by live imaging (also see Results). Despite the diffuse fluorescence seen with GFP:synapsin, mobile synapsin particles are clearly seen over the background (top kymograph), and they colocalize with vesicles containing synaptophysin (bottom kymograph; white arrowheads indicate colocalized particle). C, Neurons were transfected and visualized as above. Selected kymographs show fortuitous instances in which axons were very thin and the diffuse glow was minimal, allowing clear visualization of synapsin/SyPhy particles (kymographs are contrast-inverted). Unequivocal instances of cotransport are seen (arrowheads). There is also colocalization in the majority of stationary particles (also see Discussion). D, A hypothetical model of SCb transport. Somatic cytosolic/soluble assemblies are transported into axons by probabilistic associations with vesicles moving in fast axonal transport. These associations are typically transient, and thus over time the bulk of cytosolic molecules is transported slowly in SCb. However, because of the stochastic nature of these associations, a small subset of cytosolic particles remain continuously associated with the vesicles and are thus seen in fast axonal transport.

References

    1. Ahmari SE, Buchanan J, Smith SJ. Assembly of presynaptic active zones from cytoplasmic transport packets. Nat Neurosci. 2000;3:445–451. doi: 10.1038/74814. - DOI - PubMed
    1. Baitinger C, Willard M. Axonal transport of synapsin I-like proteins in rabbit retinal ganglion cells. J Neurosci. 1987;7:3723–3735. - PMC - PubMed
    1. Black MM, Lasek RJ. Slow components of axonal transport: two cytoskeletal networks. J Cell Biol. 1980;86:616–623. doi: 10.1083/jcb.86.2.616. - DOI - PMC - PubMed
    1. Black MM, Chestnut MH, Pleasure IT, Keen JH. Stable clathrin: uncoating protein (hsc70) complexes in intact neurons and their axonal transport. J Neurosci. 1991;11:1163–1172. - PMC - PubMed
    1. Bourke GJ, El Alami W, Wilson SJ, Yuan A, Roobol A, Carden MJ. Slow axonal transport of the cytosolic chaperonin CCT with Hsc73 and actin in motor neurons. J Neurosci Res. 2002;68:29–35. doi: 10.1002/jnr.10186. - DOI - PubMed

Publication types